A Biometric Based: 3-D Ear Recognition System Combining Local and Holistic Features

Автор: Akkas Ali, Mohammad. Mahfuzul Islam
Журнал: International Journal of Modern Education and Computer Science (IJMECS) @ijmecs
Статья в выпуске: 11 vol.5, 2013 года.
Бесплатный доступ
This paper introduces an improved ear recognition approach based on 3 dimensional keypoint matching and combining local and holistic features. At first, the 3D keypoints are detected using the shape index image. The system consists of four primary steps: i) ear image segmentation; ii) local feature extraction and matching; iii) holistic feature extraction and matching; and iv) combination of local and holistic features at the match score level. For the segmentation purpose, we use an efficient skin segmentation algorithm, to localize a rectangular region containing the ear. For the local feature extraction and representation purpose, we use the Sparse Representation based Localized Feature Extraction. For the holistic matching component, we introduce a voxelization scheme for holistic ear representation. The match scores obtained from both the local and holistic matching components are combined to generate the final match scores.
Biometrics, Ear biometrics, 3D ear recognition, 3D keypoint detection, shape index, voxelization
Короткий адрес: https://sciup.org/15014602
IDR: 15014602
Текст научной статьи A Biometric Based: 3-D Ear Recognition System Combining Local and Holistic Features
Ear recognition has attracted much attention in recent years. Compared with other popular human features, ear has many advantages, such as face, fingerprint and gait. For example, ear is rich in features; it is a stable structure which does not change with the age; it doesn’t change its shape with facial expressions, cosmetics and hair styles and so on. Especially, when we can’t capture the well-posed face images, ear recognition technique becomes more important. Much work has been done in this field and those approaches roughly can be classified into two categories: 2D-based approaches and 3D-based approaches [1, 2].Compared with the 2D-based approaches, the 3D-based approaches are relatively insensitive to pose and lighting variations. So in recent years, more and more researchers began to pay more and more attention to the recognition approaches based on 3D ear data. Relevant research activities have significantly increased, and much progress has been made in recent years. However, most current systems perform well only under constrained environments, even requiring that the subjects be highly cooperative. Furthermore, it has been observed that the variations between the images of the same ear due to illumination and viewing direction are often larger than those caused by changes in ear identity. The introduction of the threedimensional (3-D) ear modality mitigates some of these challenges by introducing a depth dimension that is invariant to both lighting conditions and head pose. Ear images can be acquired in a similar manner to face images, and a number of researchers have suggested that the human ear is unique enough to each individual to be of practical use as a biometric. Several researchers have looked at using features from the ear’s appearance in 2D intensity images [3, 4]. A smaller number of researchers have looked at using 3D ear shape [5].
The face and the ear have become popular due to their rich set of many distinctive features as well as the possibility of easy and non-intrusive acquisition of their images. Unlike most other traits (including iris), ear and face data can also be collected using 3D scanners. Although, 2D data are easier and less expensive to acquire, they have many inherent problems such as variance to pose and illumination, and sensitivity to the use of cosmetics, clothing and other decorations. Biometric systems using 3D data are potentially free of these problems. With the advancement in modern technology, 3D sensing devices are becoming cheaper and smaller enough to be feasible for a wider range of applications. Hand geometry data (including palm or finger shape) can also be collected using 3D sensors, however, it requires explicit cooperation of the users and a specialized and comparatively larger facility to extract the geometric features correctly. Besides, these features are not known to be very distinctive. They are also not stable during the growth period of children and often limited by an individual's dexterity (e.g. from arthritis) and the use of jewelry (e.g. rings). Consequently, there have been very few approaches using 3D hand biometrics alone or with the combination of 3D face biometrics. Considering these factors, we only focus in this survey on 3D ear and face biometrics. Ample research has been performed in the last few years proposing different methods of using ear and face as biometric traits for identification and authentication purposes. However, the accuracy and the robustness required for real-world applications are still to be achieved. This implies that it would be beneficial to look at existing and proposed approaches to identify the challenges and suggest future research directions.
The rest of the paper is organized as follows. Section II describes the related works. The technical approaches are described in section III. In section IV, conclusion is added.
-
II. RELATED WORKS
Bhanu and Chen presented a 3D ear recognition method using a local surface shape descriptor [6]. Twenty range images from 10 individuals (2 images each) are used in the experiments and a 100% recognition rate is reported. In [7], Chen and Bhanu use a two-step ICP algorithm on a dataset of 30 subjects with 3D ear images. They reported that this method yielded 2 incorrect matches out of 30 persons. In these two works, ears are manually extracted from profile images. They also presented an ear detection method in [8]. In the offline step, they build an ear model template from 20 subjects using the averaged histogram of shape index. In the online step, first they use a step edge detection and thresholding to find the sharp edge around the ear boundary, and then apply dilation on the edge image and connected-component labeling to search for ear region candidates. Each potential ear region is a rectangular box, and it grows in four directions to find the minimum distance to the model template. The region with minimum distance to the model template is the ear region. They get 91.5% correct detection with 2.5% false alarm rate. No ear recognition is performed based on this ear detection method. Hurley et al. [9] developed a novel feature extraction technique by using force field transformation. Each image is represented by a compact characteristic vector, which is invariant to initialization, scale, rotation and noise. The experiment displays the robustness of the technique to extract the 2D ear. Their extended research applies the force field technique on ear biometrics [10]. In the experiments, they use 252 images from 63 subjects, with 4 images per person, and no subject is included if the ear is covered by hair. A classification rate of 99.2% is claimed on their dataset. Victor [11] and Chang [12] compared 2D ear to 2D face using the same Principal Component Analysis (PCA) recognition algorithm. The two studies came to slightly different conclusions in comparing ear biometrics and face biometrics. Both ear and face show similar performance in Chang’s study, while ear performance is worse in Victor’s study. Chang explained that the difference might be due to differing ear image quality in the two studies. Moreno et al. [13] experimented with three neural net approaches to recognize people from 2D intensity images of the ear. Their testing uses a gallery of 28 persons plus another 20 persons not in the gallery. They find a recognition rate of 93% for the best of the three approaches. Yuizono [14] implemented a recognition system for 2D intensity images of the ear using genetic search. In the experiment they had 660 images from 110 persons, with 6 images per person. They reported that the recognition rate for the registered persons was approximately 100%, and the rejection rate for unknown persons was 100%. Pun and Moon [15] have surveyed the comparatively small literature on ear biometrics. We previously looked at various methods of 2D and 3D ear recognition, and found that an approach based on 3D shape matching gave the best performance. The detailed description of the comparison of different 2D and 3D methods can be found in [16]. This work found that an ICP-based approach statistically significantly outperformed the other approaches considered for 3D ear recognition, and also statistically significantly outperformed the 2D “eigen-ear” result. Therefore an ICP-based approach is extensively investigated and used as matching algorithm in this current study. Of the publications reviewed here, only two works deal with biometrics based on 3D ear shape. The largest dataset, in number of persons, is 110. And the presence or absence of earrings is not mentioned, except for [17], in which earrings are excluded. Comparing with the publications reviewed above, the work presented in this paper is unique in several points. We report results for the largest ear biometrics study to date, in terms of number of persons, 415. Our work is able to deal with the presence of earrings. Ours is the only work to fully automatically detect the ear from a profile view and segment the ear from the surroundings. Because we use a large experimental dataset, we are also able to explore how the different algorithms scale with number of persons in the gallery.
-
III. TECHNICAL APPROACH
The system block diagram is sketched in Fig. 1. The each term of the following block diagram are explained in the below.
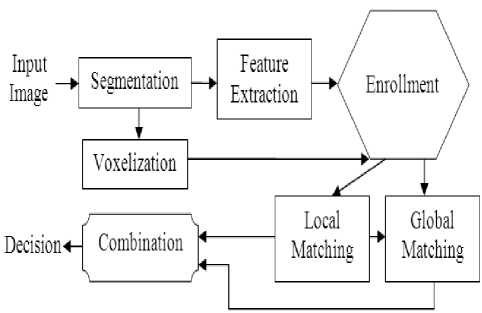
Figure1. Proposed ear recognition system
-
A. Three Dimension (3D) Ear Keypoints Detection
The 3D ear points are arranged in strips in (x, y) space with z coordinates of each point indicating its depth. At first, the shape indexes of the 3D ear data are computed. Shape index (SI) is a quantitative measure of the shape of a surface at a point p [18] that we can define as following:
SI ( p ) = 1 - -tan - 1
2 n
k 1 ( P ) + k 2 ( P ) k 1 ( P ) - k 2 ( P )
Where k 1 and k 2 are the principal curvatures of the surface, with k 1 ≥ k 2. With this definition, the range of the shape index is [0, 1]. As the principal curvatures are invariable to rotation and transformation, the shape indexes are rotation and transformation invariant.
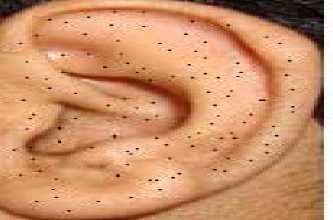
Figure 2. Key point’s detection
-
B. Skin Detection and Segmentation
Skin detection [19] is the process of finding skin colored pixels and regions in an image or a video. This process is typically used as a preprocessing step to find regions that potentially have human ear. Such regions detected are segmented and separated so that the possible area to find the ear can be reduced. The skin segmentation is done on the acquired color image of the side face. The output of the skin segmentation algorithm will be the skin segmented portion of the input image which acts as the input to the correlation matching. The most popular algorithm for skin detection is based on color skin information. Different color space information is required for the conversion of image in RGB to appropriate color to get a better result. The color space conversions like YCbCr, HSV were studied and compared. In this paper we convert the image from RGB to YCbCr, as RGB is sensitive to the variation of intensity. YCbCr space segments the image into a luminosity component and chrominance components. The main advantage is that influence of luminosity can be removed during processing an image when using YCbCr segmentation method [19].
-
B.1 Segmentation of the Region of Interest (ROI)
The process following skin segmentation is grouping or merging the parts to form candidate face region. The unconnected components and noise in the obtained output is removed. A second step performed to reduce the search area and at the same time increase the possibility to find ear is to identify the leftmost, rightmost, top and bottom skin pixels and automatically crop the image with the estimated pixels. This helps to omit the uninterested region of search. This method of reducing area of search gives positive signs to the computational time of localization thereby increasing the efficiency of the algorithm. ROI segmentation of ear image is to automatically and reliably segment a small region from the captured earth image and ear image extraction is to extract the ear from a ROI.
-
C. Local Feature Extraction
For local feature extraction and representation, we use sparse representation based localized feature extraction method. The local grey-level information from the normalized ear images often describes the ear shape and the appearance of the surface texture. One possible approach to effectively represent the distribution of such local texture information is to compute their spatial orientation across multiple scales. Such spatial orientation information can be acquired using the convolution with the popular multi-scale and multi-orientation filters. However the convolution with such filters, e.g. Gabor filters, Ordinal filters, or second Derivative of Gaussian filters, is computationally expensive. Therefore our approach is to construct an over complete dictionary using a set of binarized masks which are designed to recover the localized orientation information from the normalized ear images. The elements of this dictionary M are defined by [m1,…….,mr]εRn*r with k ≤ n. The elements of dictionary M, i.e., m, are introduced to estimate the spatial orientation of dominant local greylevel appearances in one of the possible directions. These elements are constructed from a set of points Sθ on a finite grid R2q, where Rq = {0, 1,.…, q-1} with q as a positive integer, and can be defined as in the following:
S o = ^
{ ( x , y )| y = tan( s ) x ( x - x 0) + y 0 , x e R q } ° * ^ |
{ ( x , y )| x = x о x e R q } , 0 = П [2]
Where θ ε [0, π] and denotes the angle between line Sθ and the positive x-axis, and Sθ is the line passing through the center (x0, y0) of R2q. We use the sparse representation to model computationally efficient Localized Radon Transform (LRT) based dictionary which encodes the spatial orientation of local gray-level relationship that constitutes the localized ear shape and texture features. The sparse representation uses image patches which are uniformly sampled from the normalized (and enhanced) ear image, with adjacent patch centers of l * l LRT mask. The sparse representation, i.e. coefficients ax, y, of each of such vectorized patch gx, y ε Rn centered at (x, y), requires solution for the following l1-regularized optimization problem:
min a x,y || Da x , y - g x , y || 2 + X || a x , y || 1 [3]
-
D. Local Feature Representation
The sparse representation of the local orientation features for each of the normalized ear image patch is achieved by solving the regularized optimization problem as depicted in above equation using FISTA [20] and then clipping all negative ai, j’s to zeros. Therefore all the negative coefficients are effectively removed in such formulation. The four HIS descriptors are then concatenated to form a 64-dimensional feature vector. The shape index value of the keypoint is appended to the feature vector to increase its discriminative potential and reduce the probability that keypoints exhibiting different shape types are matched in the feature matching stage.
-
E. Local Feature Matching
In the local feature representation, a 3-D ear surface is described by a sparse set of keypoints, and associated with each keypoint is a descriptive SPHIS feature descriptor that encodes the local surface information in an object-centered coordinate system. The objective of the local feature matching is to match these individual keypoints in order to match the entire surface. To allow for efficient matching between gallery and probe models, all gallery images are first processed. The extracted keypoints and their respective local features are stored in the gallery. Each feature represents the local surface information in a manner that is invariant to surface transformation. A typical 3-D ear image will produce approximately hundred overlapping features at a wide range of positions that form a redundant representation of the original surface. In the local feature matching stage, given a probe image, a set of keypoints and their respective SPHIS descriptors are extracted using the same parameters as those used in the feature extraction of the gallery images.
-
F. Holistic Feature Extraction
For a gallery model, the ear surface output from the detection component is normalized to a standard pose. The centroid of the surface is firstly mapped to the origin of the coordinate system. Then, the principal components corresponding to the two largest Eigen values of the surface are calculated. The surface is then rotated such that the two principal components are aligned with the x and y axes of the coordinate system. The probe model is then registered onto the gallery model by applying the transformation obtained by the local matching stage for each point on the probe model.
-
G. Holistic Feature Representation
The holistic representation employed in this work is a voxelization of the surface. A voxelization is defined as a process of approximating a continuous surface in a 3-D discrete domain [21]. It is represented by a structured array of volume elements (voxels) in a 3-D space. A voxel is analogous to a pixel, which represents 2-D image data in a bitmap. The representation employed in this work is the binary voxelization. This representation simply encodes the presence of a point within a voxel. A voxel that has a point enclosed within it is assigned a value of “1”, and “0” otherwise.
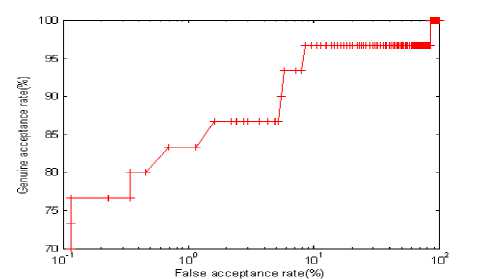
Figure 3. Curve of the experimental results.
-
H. Holistic Feature Matching
The transformation used to register a probe-gallery model pair in the local matching stage is applied to the bounding box of the probe model. The joint spatial extent of the registered probe and gallery model bounding boxes is computed. The voxel grid used to voxelize the gallery model is extended. This extended voxel grid is then used to voxelize. Additionally, the voxelization representation of the gallery model is zero padded to account for this extension. Both models have been voxelized utilizing a common voxel grid. The output of the local matching stage and the voxel grid are used to do the global matching.
-
I. Combination
We combine the local and holistic match scores using the weighted sum technique. This approach is in the category of transform-based techniques (i.e., based on the classification. In multimatcher biometric systems, a common fusion method is to directly combine the match scores provided by different matchers without converting them into posteriori probabilities. The combination of the match scores is meaningful only when the scores of the individual matchers are comparable. This requires a change of the location and scale parameters of the match score distributions at the outputs of the individual matchers. The sigmoid function score normalization [22] is used to transform the match scores obtained from the different matchers into a common domain that can be defined as following:
snj
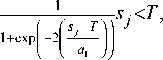
1 otherwise
( ( S j - T ))
1 + exp - 2
I I a 2 ))
Where s j and s j n are the scores before normalization and after normalization, τ is the reference operating point and α 1 and α 2 denote the left and right edges of the region in which the function is linear. The double sigmoid normalization scheme transforms the scores into the interval of [0 1], in which the scores outside the two edges are nonlinearly transformed to reduce the influence of the scores at the tails of the distribution.
The weighted sum of the normalized scores is then used to generate a final matching score.
S f = Ё >' s n [5]
j = 1
Where s j n and w j are the normalized match score and weight of the jth modality, respectively, with the condition Σ j 2 =1 w j =1. The weights can be assigned to each matcher by exhaustive search or based on their individual performance [23]. We simply choose equal weights for our local and holistic matchers.
Figure 4. Recognized ear
IV. CONCLUSIONS
A complete and fully automatic approach for human ear recognition system from 3D images is developed. This is done by matching three dimensional key points and combining local and holistic features. The efforts detailed in this research to exploit the sparse representation of local ear shape descriptors have illustrated superior performance for the automated ear recognition problem.
Список литературы A Biometric Based: 3-D Ear Recognition System Combining Local and Holistic Features
- Kyong Chang and Kevin W. Bowyer, Sudeep Sarkar and Barnabas Victor, “Comparison and Combination of Ear and Face Images in Appearance-Based Biometrics”, IEEE Transactions on Pattern Analysis And Machine Intelligence, September 2003, 25(9), pp. 1160-1165.
- Hui Chen and Bir Bhanu. “Efficient Recognition of Highly Similar 3D Objects in Range Images”, IEEE Transactions on Pattern Analysis And Machine Intelligence, January 2009, 31(1), pp. 172-179.
- K. Chang, K. Bowyer, and V. Barnabas. Comparison and combination of ear and face images in appearance based biometrics. IEEE Transaction on Pattern Analysis and Machine Intelligence, 25:1160–1165, 2003.
- M. Kass, A.Witkin, and D. Terzopoulos. Snakes: Active contour models. International Journal of Computer Vision, 1(4):321–331, 1987.
- H. Chen and B. Bhanu. Contour matching for 3D ear recognition. Seventh IEEE Workshop on Application of Computer Vision, pages 123–128, 2005.
- B. Bhanu and H. Chen. Human ear recognition in 3D. Workshop on Multimodal User Authentication, pages 91–98, 2003.
- H. Chen and B. Bhanu. Contour matching for 3D ear recognition. Seventh IEEE Workshop on Application of Computer Vision, pages 123–128, 2005.
- H. Chen and B. Bhanu. Human ear detection from side face range images. International Conference on Pattern Recognition, pages 574–577, 2004.
- D. Hurley, M. Nixon, and J. Carter. Force field energy functionals for image feature extraction. Image and Vision Computing Journal, 20:429–432, 2002.
- D. Hurley, M. Nixon, and J. Carter. Force field energy functionals for ear biometrics. Computer Vision and Image Understanding, 98(3):491–512, 2005.
- B. Victor, K. Bowyer, and S. Sarkar. An evaluation of face and ear biometrics. 16th International Conference of Pattern Recognition, pages 429–432, 2002.
- K. Chang, K. Bowyer, and V. Barnabas. Comparison and combination of ear and face images in appearance based biometrics. IEEE Transaction on Pattern Analysis and Machine Intelligence, 25:1160–1165, 2003.
- B. Moreno, A. Sanchez, and J. Velez. On the use of outer ear images for personal identification in security applications. IEEE International Carnaham Conference on Security Technology, pages 469–476, 1999.
- T. Yuizono, Y. Wang, K. Satoh, and S. Nakayama. Study on individual recognition for ear images by using genetic local search. Proceedings of the 2002 Congress on Evolutionary Computation, pages 237–242, 2002.
- K. Pun and Y. Moon. Recent advances in ear biometrics. Proceedings of the Sixth International Conference on Automatic Face and Gesture Recognition, pages 164–169, May, 2004.
- P. Yan and K.W. Bowyer. Ear biometrics using 2D and 3D images, 2005 IEEE Computer Society Conference on Computer Vision and Pattern Recognition (CVPR’05) - Workshops, page 121, 2005.
- P. Yan and K. W. Bowyer. Empirical evaluation of advanced ear biometrics, 2005 IEEE Computer Society Conference on Computer Vision and Pattern Recognition (CVPR’05) - Workshops, page 41, 2005.
- C. Dorai and A. Jain, COSMOS – A Representation Scheme for 3D Free-Form Objects, IEEE Transactions on Pattern Analysis And Machine Intelligence, October 1997, 19(10), pp. 1115-1130.
- Surya Prakash, Umarani Jayaraman and Phalguni Gupta (2009) Proceedings of International Conference on Advances in Pattern Recognition, ICAPR' 09, Kolkata, India, 213-216.
- A. Beck and M. Teboulle, “A fast iterative shrinkage thresholding algorithm for linear inverse problem,” SIAM Journal on Imaging Sciences, vol. 2, pp. 183–202, 2009.
- S.Wang and A. Kaufman, “Volume sampled voxelization of geometric primitives,” in Proc. 4th Conf. Visualization, 1993, pp. 78–84.
- R. Cappelli, D. Maio, and D. Maltoni, “Combining Þngerprint classifiers,” in Proc. Fist Int. Workshop Multiple ClassiÞer Systems, 2000, pp. 351–361.
- Ross, K. Nandakumar, and A. Jain, Handbook of Multibiometrics (International Series on Biometrics). Secaucus, NJ: Springer-Verlag, 2006.
