A Bootstrap Approach of Benchmarking Organizational Maturity Model of Software Product With Educational Maturity Model

Author: R.Manjula,J.Vaideeswaran
Journal: International Journal of Modern Education and Computer Science (IJMECS) @ijmecs
Article in issue: 6 vol.4, 2012.
Free access
This Software product line engineering is an inter-disciplinary concept. It spans the dimensions of business, architecture, process, and the organization. Similarly, Education System engineering is also an inter-disciplinary concept, which spans the dimensions of academic, infrastructure, facilities, administration etc. Some of the potential benefits of this approach include continuous improvements in System quality and adhering to global standards. The increasing competency in IT and Educational Sectors necessitates a process maturity evaluation methodology. Accordingly, this paper presents an organizational maturity model for Education system for evaluating the maturity of multi- dimension factors and attributes of an Education System. Assessment questionnaires and a rating methodology comprise the framework of this Educational maturity model. The objective and design of the questionnaires are to collect information about the Education system engineering process from the multi perspectives of academic, infrastructure, administration, facilities etc. Furthermore, we conducted one case study and reported the assessment results using the organizational maturity model presented in this paper.
SEI-CMM, BOOTSTRAP, Software quality, Process improvement, Process maturity
Short address: https://sciup.org/15011431
IDR: 15011431
Text of the scientific article A Bootstrap Approach of Benchmarking Organizational Maturity Model of Software Product With Educational Maturity Model
Published Online June 2012 in MECS DOI: 10.5815/ijmecs.2012.06.07
Clearly, the CMM for education will look very different in details than CMM for software [1]. However, there are some general properties of such a framework. First, the overall capability of a service provider can be represented by a few levels. It is now recognized that a two-level accreditation systems, like the ISO-certified or ISI-mark are suitable for some sectors like the manufacturing sector, but are not well suited for service sector. For a service sector, it is much better to have a framework that is multi-level, such that capability of delivering quality has a finer gradation. Then for each level, a few key aspects of providing the service (called the Key Process Areas or KPAs in the CMM for software) [5] at a certain level are specified. During an assessment, each of these areas are evaluated and rated with weaknesses and strengths identified. And if all the areas of a level are fully satisfied, then the organization is supposed to be at that level. For a higher level, all areas of that level and the levels below must be satisfied.
For the education sector in India, levels can be defined like in the SPICE model (which is the ISO answer to CMM) which has levels 0 to level 5. Key areas for each level can be defined.
-
III. The Education - Bootstrap Process Model
This section describes the BOOTSTRAP process taxonomy and framework. The terms and process structure of BOOTSTRAP [2] are introduced using the original form of expression and are contrasted with the unified education process system framework.
-
A. Taxonomy of the Education-BOOTSTRAP process model
The BOOTSTRAP process hierarchy and domains are listed in Table I.
TABLE I. E ducational S ystem - BOOTSTRAP C onfiguration
M odel
|
Taxonomy |
Subsystem |
Category |
Process |
Practice |
|
Process scope |
Process areas (PAs) |
Process Categories (PCs) |
Processes (PRs) |
Quality system attributes (QSAs) |
|
Size of domain |
5 |
9 |
45 |
234 |
|
Identification |
PA[i] |
PC[i,k] |
PR[i,k,r] |
QSA[i,k,r,j] |
Table I defines the configuration of the BOOTSTRAP model. As shown, the QSAs, PRs, PCs and PAs used in BOOTSTRAP are equivalent to the education practices, processes, category, and levels respectively, as defined in the unified process system framework.
In order to provide a formal identification for each entity defined at various levels of coverage known as process scopes, the indexing of PA, PC, PR and QSA are described using a naming convention as shown in Table I.
In this table, i is the number of PA; k - the number of PC in ith PA; and j - the number of QSA in rth PR, kth PC, and the ith PA.
-
B. Framework of the Education - BOOTSTRAP process model
The fundamental concept of BOOTSTRAP is a set of 234 QSAs. Based on this premise, BOOTSTRAP claims it is an attribute-based method for process assessment and improvement [Kuvaja et al., 1994a]. The QSAs of BOOTSTRAP are classified in two ways: functional and measurable technology [BOOTSTRAP Institute, 1994, Koh 2004].
2.1
PC 2.1
Up-gradation
31
2.1.1
PR 2.1.1
Educational subcontract management
1
2.1.2
PR 2.1.2
Educational organization process focus
6
2.1.3
PR 2.1.3
Student support and progression
4
2.1.4
PR 2.1.4
Supplementary practices
6
2.1.5
PR 2.1.5
Healthy practices
6
2.1.6
PR 2.1.6
Strategy planning
2
2.1.7
PR 2.1.7
Opportunities for knowledge up-gradation
6
2.2
PC 2.2
Educational Outcomes
23
2.2.1
PR 2.2.1
Learning outcomes
6
2.2.2
PR 2.2.2
Technical Competencies
5
2.2.3
PR 2.2.3
Technology driven teaching aids
3
2.2.4
PR 2.2.4
Generic Competencies
9
3
PA 3
Refined
46
3.1
PC 3.1
Continual Improvement
19
3.1.1
PR 3.1.1
Teaching – Learning and Evaluation
7
3.1.2
PR 3.1.2
Research, Consultancy and Extension
8
3.1.3
PR 3.1.3
Redefining educational quality in terms of outcomes
4
3.2
PC 3.2
Global Quality Management
27
3.2.1
PR 3.2.1
Internal Quality Assurance Cell (IQAC)
6
3.2.2
PR 3.2.2
Process management
3
3.2.3
PR 3.2.3
Personality development
5
3.2.4
PR 3.2.4
Academics
5
3.2.5
PR 3.2.5
Industry Institute Interface
3
3.2.6
PR 3.2.6
Responsiveness
5
4
PA 4
Quantifiable matured process
28
4.1
PC 4.1
Qualifiedly and Quantifiable process management
28
4.1.1
PR 4.1.1
Organizational performance results
6
4.1.2
PR 4.1.2
Quantitative and qualitative focus on teaching and learning
3
4.1.3
PR 4.1.3
Measurement Analysis and knowledge mgt.
2
4.1.4
PR 4.1.4
Maturity and stability of the institution
5
4.1.5
PR 4.1.5
Educational Quality Assurance
8
4.1.6
PR 4.1.6
Continuous Evaluation System
4
According to the functional classification, the QSAs are categorized into four process areas known as repeated, defined, refined, and quantifiable managed. According to the measurable classification, for process assessment, BOOTSTRAP specifies the QSAs at different capability levels similar to those of CMM for Software.
From the functional organization point of view, BOOTSTRAP models educational computing based process system into 5 process areas (PAs), 9 process categories (PCs), and 234 processes (PRs) as shown in Table II below.
TABLE II. E ducational S ystem - BOOTSTRAP C onfiguration M odel
|
ID |
PA (Proces s Area) |
PC (Process Category) |
PR (Process Rating) |
Description |
No of QSAs |
|
0 |
PA 0 |
Initial |
0 |
||
|
0.1 |
PC 0.1 |
Adhoc process |
0 |
||
|
PR 0.1.1 |
Adhoc |
0 |
|||
|
1 |
PA 1 |
Repeated |
106 |
||
|
1.1 |
PC 1.1 |
Physical Resource Mgt |
14 |
||
|
1.1.1 |
PR 1.1.1 |
Resource Allocation |
6 |
||
|
1.1.2 |
PR 1.1.2 |
Financial and resource, allocation |
2 |
||
|
1.1.3 |
PR 1.1.3 |
Physical facilities |
6 |
||
|
1.2 |
PC 1.2 |
Academic Resource Mgt |
19 |
||
|
1.2.1 |
PR 1.2.1 |
Learning Resources |
7 |
||
|
1.2.2 |
PR 1.2.2 |
Course Curriculum |
6 |
||
|
1.2.3 |
PR 1.2.3 |
Administrative Support |
6 |
||
|
1.3 |
PC 1.3 |
Human Resource Mgt |
73 |
||
|
1.3.1 |
PR 1.3.1 |
Leadership |
7 |
||
|
1.3.2 |
PR 1.3.2 |
Staff and Students relationship |
6 |
||
|
1.3.3 |
PR 1.3.3 |
Management and organization skills |
7 |
||
|
1.3.4 |
PR 1.3.4 |
C ommunication and social skills |
4 |
||
|
1.3.5 |
PR 1.3.5 |
Teamwork |
2 |
||
|
1.3.6 |
PR 1.3.6 |
Human Resources(faculty and staff) |
7 |
||
|
1.3.7 |
PR 1.3.7 |
Human Resources(students) |
4 |
||
|
1.3.8 |
PR 1.3.8 |
Management Responsibility |
10 |
||
|
1.3.9 |
PR 1.3.9 |
Product realization. |
5 |
||
|
1.3.10 |
PR 1.3.10 |
Measurement, analysis and improvement |
4 |
||
|
1.3.11 |
PR 1.3.11 |
Educational Change Management |
8 |
||
|
1.3.12 |
PR 1.3.12 |
Teaching-Learning and assessment practices |
9 |
||
|
2 |
PA 2 |
Defined |
54 |
-
C. Formal Description of the Education -BOOTSRAP Process Model
The formal description of the Education -BOOTSTRAP process model provides precise and accurate definitions of the structure and interrelationships of the BOOTSTRAP processes, and avoids ambiguity inherent in conventional natural language description.
-
1) CMM Bootstrap Structure
A formal description of the structure of the BOOTSTRAP process model, Educational System – BOOTSTRAP, ES-PM, is shown in Expression 1 and illustrated in Fig.2. Basically, this is a process model at the system level.
BOOTSTRAP – PM
= PA 0 || PA 1 || PA 2 || PA 3 || PA 4 (1)
= Initial || Repeated || Defined || Refined || Quantifiable matured process
Let PA x be the process area at xth level
PC x.y be the process category y at xth level.
PR x.y.z be the processes z of yth process category at xth category at xth process area
In the BOOTSTRAP process model, each process area can be extended to a number of parallel PCs as shown by a set of expressions in Step 2.
BOOTSTRAP PA 2 : Defined Process Model
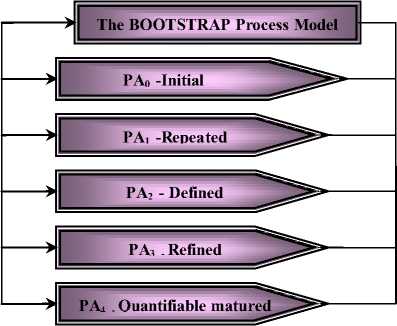
Figure 2: The Educational System - BOOTSTRAP Process model
PR .2.1.4 - Supplementary practices
PR .2.1.6 - Strategy planning
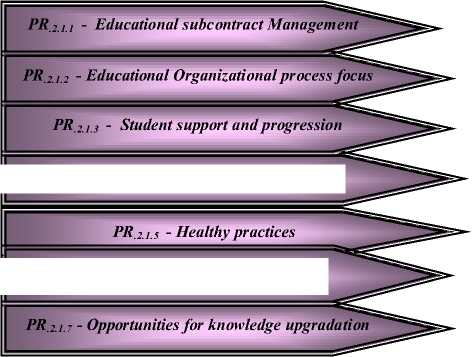
PR .2.1.7 - Opportunities for knowledge upgradation
PR .2.1.1 - Educational subcontract Management
PR .2.1.2 - Educational Organizational process focus
PR .2.1.3 - Student support and progression
PR .2.1.5 - Healthy practices
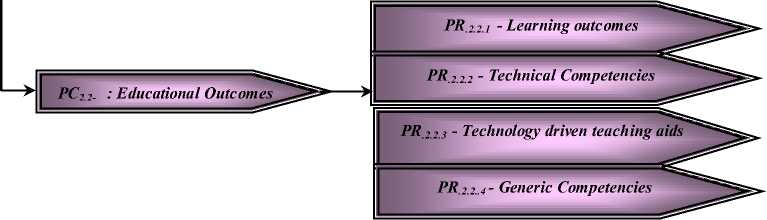
Figure 3: BOOTSTRAP Process Area, PA 2 - the methodology processes
The BOOTSTRAP processes known as PRs, at each capability level can be formally defined by a set of expressions as shown in step 3 and are illustrated in Figure 3 for PA2.
STEP-1: Bootstrap process rating,
PR = PA 0 || PA 1 || PA 2 || PA 3 || PA 4
STEP-2: Each PA can be extended to a number of parallel PC’s
PA 1 = PC 1.1 || PC 1.2 || PC 1.3
PA 2 = PC 2.1 || PC 2.2
PA 3 = PC 3.1 || PC 3.2
PA 4 = PC 4.1
STEP-3: Processes known as PRs at each capability level can be formally defined as
PA 1 = PC 1.1 || PC 1.2 || PC 1.3
= (PR 1.1.1 || PR 1.1.2 || PR 1.1.3 ) ||
(PR 1.2.1 || PR 1.2.2 || PR 1.2.3 ) ||
(PR 1.3.1 || PR 1.3.2 || PR 1.3.3 || PR 1.3.4 || PR 1.3.5 ||
PR 1.3.6 || PR 1.3.7 || PR 1.3.8 || PR 1.3.9 ||
PR 1.3.10 || PR 1.3.11 || PR 3.12 )
PA 2 = PC 2.1 || PC 2.2
= (PR 2.1.1 || PR 2.1.2 ||PR 2.1.3 || PR 2.1.4 || PR 2.1.5 ||
PR 2.1.6 || PR 2.1.7) | | (PR 2.2.1 || PR 2.2.2 || PR 2.2.3 ||
PR 2.2.4 )
PA 3 = PC 3.1 || PC 3.2
= (PR 3.1.1 || PR 3.1.2 || PR 3.1.3 )|| (PR 3.2.1 || PR 3.2.2 || PR 3.2.3 || PR 3.2.4 || PR 3.2.5 || PR 3.2.6 )
PA 4 = PC 4.1
= (PR 4.1.1 || PR 4.1.2 || PR 4.1.3 || PR 4.1.4 || PR 4.1.5 ||
PR 4.1.6)
-
iv . The Bootstrap Process Assessment Model
The BOOTSTRAP process model was systematically introduced in above section. This section explored the BOOTSTRAP process capability model and process capability determination methodology. Both of the above forms the BOOTSTRAP process assessment.
-
A. The Bootstrap Process Capability Model
This section describes the BOOTSTRAP process capability model, which includes a practice performance scale, and a process capability scale.
-
1) Practice Performance Scale
A practice performance rating scale for the QSAs in BOOTSTRAP is defined in four (plus one) levels as described in Table III. In this table, the rating thresholds provide a set of quantitative measurements for rating a QSA’s performance with the scale.
The supplementary scale 0 in Table III doesn’t apply is designed to increase the tailorability and flexibility of the BOOTSTRAP QSA rating, a sore 0 is usually treated as equivalent to 4.
-
2) Process Capability Scale
As shown in Table IV, process capability in BOOTSTRAP is determined by a five-level process capability scale, which is identified to that of CMM. A refinement of the capability scale in BOOTSTRAP is that quartiles are added to each capability level to enable further precise assessment of the process capability.
In table IV, the different distances (number of QSAs) between two adjacent levels indicate the various difficulties in capability improvement from the current level to the next higher level according to the model.
TABLE III Practice Performance Scale of the QSAs
|
Scale |
Description |
Rating threshold (%) |
|
4 |
Complete/extensive |
>=80 |
|
3 |
Largely satisfied |
66.7- 79.9 |
|
2 |
Partially satisfied |
33.3 – 66.6 |
|
1 |
Absent/Poor |
<=33.2 |
|
0 |
Doesn’t apply |
- |
It may be observed from table that for process assessment BOOTSTRAP adopted the same approach to pre-assigned the 234 QSAs into different capability levels. BOOTSTRAP overlaps the process and capability dimensions at the practice (QSA) level, CMM overlaps the two dimensions at the process (KPA) level, this means that BOOTSTRAP pre-allocates and determines the process capability levels by different QSAs while CMM does the same by different KPAs. So in BOOTSTRAP, we may say that a capability level is determined by a certain subset of its practices (QSAs); while that of CMM is determined by a certain subsets of its processes (KPAs).
-
B. The BOOTSTRAP Process capability determination methodology .
The BOOTSTRAP capability model is applied to the process model for the assessment of process capability using the formal definition of the BOOTSTRAP process model and process capability model developed in section 3.3 and 4.1
-
1) Process Performance Rating Method:
Let r QSA [i, j] be a rating of performance of the jth QSA at the ith process capability level. The r QSA [i, j] can be read according to the practice performance scale as defined in table 3, i.e.
r QSA [i, j] = 4, if the QSA’s performance is at least 80% satisfied
= 3, if the QSA’s performance is between 66.7
– 79.9% satisfied
= 2, if the QSA’s performance is between 33.3
– 66.6 % satisfied
= 1, if the QSA’s performance is less than 33.2satisfied
=0, if the QSA’s doesn’t apply in this
Assessment
TABLE IV. The BOOTSTRAP Process Capability Model
|
Capability Level (CL[i]) |
Quartiles Between CLs |
Description |
Identified QSAs (Nqsa[i]) |
Pass Threshold (Pqsa[i]) |
|
CL[0] |
Initial |
Nqsa[0] = 0 |
Pqsa[0] = 0 |
|
|
CL[1] |
CL1.1 CL1.2 CL1.3 CL1.4 |
Repeated |
Nqsa[1] = 106 |
Pqsa[1] = 89 |
|
CL[2] |
CL2.1 CL2.2 CL2.3 CL2.4 |
Defined |
Nqsa[1] = 54 |
Pqsa[1] =43 |
|
CL[3] |
CL3.1 CL3.2 CL3.3 CL3.4 |
Refined |
Nqsa[1] = 46 |
Pqsa[1] = 37 |
|
CL[4] |
CL4.1 CL4.2 CL4.3 CL4.4 |
Quantifiable Matured Process |
Nqsa[1] = 28 |
Pqsa[1] = 22 |
-
2) Process Capability Rating Method
The number of satisfied QSAs at a level i, SAT QSA [i], is assessed according to the following expression.
SAT QSA [i] = # {QSA[i,j] | Passed}
=# {QSA[i,j] | r QSA [i,j] >= 3 V r QSA [i,j] = 0} N QSAi =∑ {1 | r QSA [i,j] >= 3 V r QSA [i,j] = 0} (2)
j = 1
Where N QSAi is the number of defined QSAs at level i.
Expression 2 indicates that the number of the satisfied QSAs at a capability level can be obtained simply by counting the QSAs that satisfy or do not apply in the assessment.
A pass threshold P QSA [i], for a capability level, i in BOOTSTRAP is defined as:
P QSA [i], = N QSA [i] * 80 % (3)
This means that 80% of the QSAs defined at a level should be satisfied for fulfilling the requirements of the process capability at this level i.e.
SAT QSA [i] ≥ P QSA [i],
≥ N QSA [i] * 80% (4)
The pass thresholds at each capability level have been defined in Table 4.
BOOTSTRAP Capability levels and their related QSAs are predefined and fixed according to its methodology, as is the case for CMM. However, BOOTSTRAP allows an organization’s practices at higher levels to be taken into account in the final capability determination. This feature is explained in the next section.
-
3) Product Capability Determination Method
BOOTSTRAP adopts a dynamic capability scale for process assessment. BOOTSTRAP assesses a system capability by taking account of the practices (QSAs) at all levels. The higher level practices within organizations which, at the levels(s) higher than the maximum fulfilled capability level, are treated as merits in capability determination.
The total score for the education quality system – the number of QSAs satisfied at all levels, N QSA - is a sum of the QSAs satisfied at each level i.e.;
N QSAi
N QSA [i] = ∑ SAT QSA [i] (5) j = 1
Thus, the process capability level of a product, PCL, is calculated by the items in BOOTSTRAP, a base score and an additional technical merit score gained by practices at higher levels as described below.
PCL = Base + Additional
= max {i | SAT1 QSA [i] ≥ P1 QSA [i] } +
(SAT1 QSA [5] – SAT1 QSA [i] ) / ∑ N QSA [j] (6)
j=i+1
Where SAT1 QSA [i] and P1 QSA [i] represent the ith accumulated score and threshold up to level i, respectively. The latter can be derived based on the individual pass thresholds defined in Table IV as { P1 QSA [0], P1 QSA [1], P1 QSA [2], P1 QSA [3], P1 QSA [4]} = 0, 89, 132, 169, 191.
When a PCL obtained by Expression 6 is neither an integer nor a quartile, a quarterly rounded capability level, PCLτ , needs to be derived according to the following expression:
PCLτ = [PCL] ¼ (7)
Where [x] ¼ means round x to the nearest lower quarter. For example, [1.80] ¼ = 1.75, [3.23] ¼ = 3.0, and [4.5] ¼ = 4.5.
Thus, the product capability level in BOOTSTRAP can be obtained by substituting Expression 6 into 7
PCL prod = PCLτ
= [PCL] ¼
= max {i | SAT QSA [i] ≥ P QSA [i] } +
(SAT1 QSA [5] - SAT1 QSA [i] ) / ∑ N QSA [j] ¼ (8)
j=i+1
-
V. . Sample BOOTSTRAP Assessment
The capability rating framework and the capability determination algorithm of BOOTSTRAP have been formally described in Sections 3 and 4. This section demonstrates how to apply the BOOTSTRAP expressions and algorithm to quantitatively determine an education system capability level in BOOTSTRAP.
-
A) QSA performance rating in BOOTSTRAP
First, a set of detailed ratings of all 234 QSAs is identified. On applying Expression 2 allows the number of QSAs at a level i, SAT QSA [i] to be derived by
SAT QSA [i] = # {QSA[i,j] | Passed}
-
= # {QSA[i,j] | r QSA [i,j] >= 3 V r QSA [i,j] = 0}
N QSAi
=∑ {1 | rQSA [i,j] >= 3 V rQSA [i,j] = 0} j=1
For example, there are 28 QSAs at level 4, CL 4 , in BOOTSTRAP which are identified by subscript “4”. If only 20 QSAs {QSA 4.1 = 3, QSA 4.3 = 4, QSA 4.7 = 3, QSA 4.8 = 4, QSA 4.9 = 4, QSA 4.10 = . 0, QSA 4.11 = 3,
QSA4.12 = 0, QSA4.13 = 4, QSA4.14 = 4, QSA4.15 , =0,
QSA4.16 = 4, QSA4.17 = 3, QSA4.19 = 4, QSA4.20 =0,
QSA4.22 =4, QSA4.23 = 4, QSA4.24 = 3, QSA4.26 =4,
QSA 4.27 = 4} are satisfied, then according to Expression 1, the numbers of satisfied QSAs for CL 4 are
SAT QSA [4] = 20
A sample summary of the ratings of the 234 QSAs at 5 capability levels in BOOTSTRAP is listed in Table V. In the last two columns, P1 QSA [i] and SAT1 QSA [i] represen(t6) the ith accumulated threshold and the ith accumulated score at level i, respectively.
TABLE V. S ummary A ssessment R ecord in BOOTSTRAP
|
Capability level (CL [i] ) |
Description |
Identified QSAs (N QSA [i]) |
Pass threshold (P QSA [i] | P1 QSA [i] |
Assessment result (SAT QSA [i] | SAT1 QSA [i] |
|
CL [0] |
Initial |
0 |
0 | 0 |
0 | 0 |
|
CL [1] |
Repeated |
106 |
84.8 | 84.8 |
100 | 100 |
|
CL [2] |
Defined |
54 |
43.2 | 128 |
50 | 150 |
|
CL [3] |
Refined |
46 |
36.8 | 164.8 |
10 | 160 |
|
CL [4] |
Quantifiab le matured process |
28 |
22.4 | 187.2 |
20 | 180 |
-
B) Process capability determination in BOOTSTRAP .
Using the assessment result listed in Table V, a process capability profile of the Education development organization in BOOTSTRAP can be derived as shown in Figure 4. The data shown in the CL i 1 columns are the accumulated scores up to level i.
Figure 4a to 4d shows the Process capability profile of an education organization in BOOTSTRAP
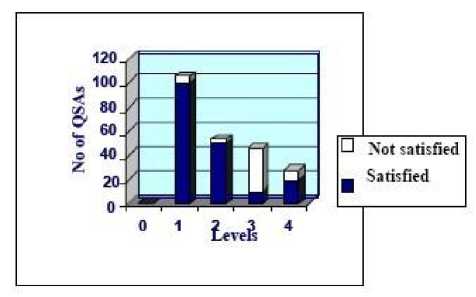
Figure 4a: # of QSA versus Levels
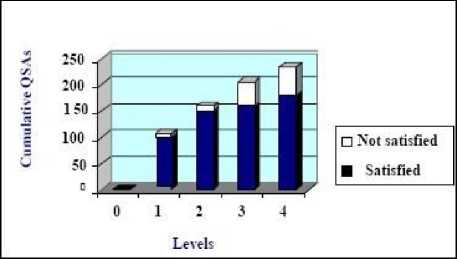
Figure 4b: Cumulative QSAs Versus Levels
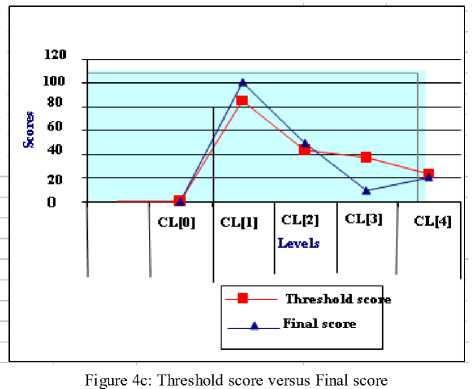
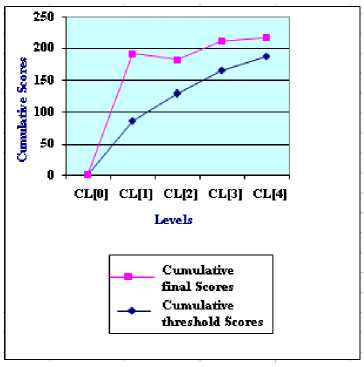
Figure 4d: Cumulative threshold Score versus Levels
-
C) Education - Capability determination in BOOTSTRAP
The capability maturity level for a product p, PCLprod[p], in BOOTSTRAP has been defined as the maximum integer level, i, plus the quartile(s) a software development organization fulfilled as in Expression 8.
Applying Expression 8 to the ratings of the 234 QSAs at the five levels summarized in Table 5, the capability level of the software development organization can be determined. Considering that:
( SAT1 QSA [1] = 100) > (P1 QSA [1] = 84.8)
( SAT1 QSA [2] = 150) > (P1 QSA [2] = 128)
( SAT1 QSA [3] = 160) < (P1 QSA [3] = 164.8)
( SAT1 QSA [4] = 180) < (P1 QSA [4] = 187.2)
This indicates that the base score in BOOTSTRAP is 3. According to Expression 8, the capability level of the education organization in BOOTSTRAP can be calculated as:
PCL proj = PCLτ
= [PCL] ¼
= max {i | SAT QSA [i] ≥ P QSA [i] } + (SAT QSA [4] –
SAT1QSA[i] ) / ∑ NQSA [j] ¼ j=i+1
= max {0,1,2 | SAT1 QSA [i] ≥ P1 QSA [i] } + (SAT1 QSA [4] 5
– SAT1QSA[i] ) / ∑ NQSA [j] ¼ j=i+1
= 2 + (SAT1QSA[4] - SAT1QSA[2] ) / ∑ NQSA [j] ¼ j=2+1
= 2 + (180 – 150)/ (46+28)
=2 + (30/74)
= 2 + 0.405 = 2.405 ¼ = 2 (Level 2)
-
V. Conclusions
In this paper, we have proposed a Capability Maturity Model for Education System benchmarked with BOOTSTRAP model, which helps in improving the practices of key educational processes and contribute to enhance the overall quality education. For this, we adopted CMM as our base model and proposed a new BOOTSTRAP-CMM-Educational model. The five levels of maturity provides a finer grained measure of the education process maturity in the scale of 0 to 4, thus facilitating the process of articulation between institutions at the same level and giving an encouraging assessment of institutions, instead of an all-or-nothing accreditation decision. Based on this model, the BOOTSTRAP-assessment methodology is derived to predict the capability level or performance level of an Educational Organization. This BOOTSTRAP-CMM-Educational model can be used for continuously evaluating the education process which serves as the mantra for effective accreditation of higher education system. Using this tool, one can predict the quality, maturity and standard of an education system more precisely and concisely compared to ISO standards. Finally, it is concluded that quality assurance is not the destination, but a journey to continuously improve the higher education system.
References A Bootstrap Approach of Benchmarking Organizational Maturity Model of Software Product With Educational Maturity Model
- Pankaj Jalote, Professor, Computer Science and Engineering, I. I. T. Kanpur, "Needed – A Capability Maturity Model for Engineering Education", 2005.
- Kuvaja P. J, Simila J, Krzanik L, Bicego A, Saukkonen S, & Koch G, "Software process assessment and improvement—the bootstrap approach", Oxford: Blackwell, 1994.
- Koch E, Kim S, "Issues on adopting software product line", In Proceedings of the 11th Asia–Pacific Conference on Software Engineering, pp. 589, 2004
- Koh E., Kim S, "Issues on adopting software product line". In Proceedings of the 11th Asia–Pacific Conference on Software Engineering, pp. 589, 2004
- "THE CAPABILITY MATURITY MODEL", The Guidelines for Improving the Software Process, Carnegie Mellon University, Software Engineering Institute, Reading, Addison Wesley.
- M.Maria, P.Larrondo, "Towards an Engineering Education Capability Maturity Model", Proceedings of the American Society for Engineering Education, Annual Conference and Exposition, 2004
- Y.C.Cheng and W.M.Tam (2003), "Multi-models of quality in education", Quality Assurance in Education, No.5(1), pp 22–31
