A classification framework to detect DoS attacks

Author: Ahmed Iqbal, Shabib Aftab, Israr Ullah, Muhammad Anwaar Saeed, Arif Husen
Journal: International Journal of Computer Network and Information Security @ijcnis
Article in issue: 9 vol.11, 2019.
Free access
The exponent increase in the use of online information systems triggered the demand of secure networks so that any intrusion can be detected and aborted. Intrusion detection is considered as one of the emerging research areas now days. This paper presents a machine learning based classification framework to detect the Denial of Service (DoS) attacks. The framework consists of five stages, including: 1) selection of the relevant Dataset, 2) Data pre-processing, 3) Feature Selection, 4) Detection, and 5) reflection of Results. The feature selection stage incudes the Decision Tree (DT) classifier as subset evaluator with four well known selection techniques including: Genetic Algorithm (GA), Particle Swarm Optimization (PSO), Best First (BF), and Rank Search (RS). Moreover, for detection, Decision Tree (DT) is used with bagging technique. Proposed framework is compared with 10 widely used classification techniques including Naïve Bayes (NB), Support Vector Machine (SVM), Multi-Layer Perceptron (MLP), K-Nearest Neighbor (kNN), Decision Tree (DT), Radial Basis Function (RBF), One Rule (OneR), PART, Bayesian Network (BN) and Random Tree (RT). A part of NSL-KDD dataset related to Denial of Service attack is used for experiments and performance is evaluated by using various accuracy measures including: Precision, Recall, F measure, FP rate, Accuracy, MCC, and ROC. The results reflected that the proposed framework outperformed all other classifiers.
Intrusion Detection, DoS Attacks, Denial of Service Attacks, Network Intrusion Detection, Machine learning, Classification, Feature Selection
Short address: https://sciup.org/15015713
IDR: 15015713 | DOI: 10.5815/ijcnis.2019.09.05
Text of the scientific article A classification framework to detect DoS attacks
There is an exponent increase in the demand of secure networks due to the modern digital era where everything is shifting on online information systems [23], [26]. Intrusion detection from the network traffic data is one of the emerging research areas now days. The Intrusion Detection System (IDS) aims to detect the abnormal flow of data in network and notifies in case of any threat [9,10]. This research introduced a classification framework using feature selection and machine learning technique to detect the Denial of Service (DoS) attacks.
The proposed framework consists of five stages: 1) Dataset selection, 2) Data pre-processing, 3) Feature Selection, 4) Detection, and 5) reflection of Results. To detect any intrusion, the IDS has to process a large amount of network data which consists of too many features/attributes [24], this problem is known as curse of dimensionality [25]. However not all the attributes equally participate in detection process and some nonrelated features can even decrease the performance of IDS. Due to this reason a feature selection process is needed to select an optimum subset of features which can improve the performance of intrusion detection process [27]. In the proposed classification framework optimum subset of features is selected by feature selection stage where Decision Tree is used as wrapper subset evaluator with four widely used search methods including: Genetic Algorithm, Particle Swarm Optimization, Best First, and Rank Search. 10 % of the preprocessed data is given as input training data to the subset evaluator. The extracted subsets of features are then further analyzed with Decision Tree (DT) classifier by using 90% of remaining preprocessed data. Nine ratios of training and test data (10:90 – 90:10) are used to extract the average accuracy of each feature-subset. Feature subset with the highest average accuracy is selected for the detection stage where Bagging is used along with DT to detect that whether the system is under attack or not. The performance of proposed framework is compared with 10 widely used supervised classifiers including: Naïve Bayes (NB), Support Vector Machine (SVM), Multi-Layer Perceptron (MLP), K-Nearest Neighbor (kNN), Decision Tree (DT), Radial Basis Function (RBF), One Rule (OneR), PART, Bayesian Network and Random Tree. Supervised machine learning techniques need the pre-classified data (training data) for training where these techniques make rules to classify the unseen data (test data) [1,2,3,4,5,6], [21,22]. This research used a portion of NSL-KDD dataset, which is related to Denial of Service attacks and performance is evaluated by using various accuracy measures including: Precision, Recall, F measure, FP rate, Accuracy, MCC, and ROC.
-
II. R elated W ork
Many researchers have been working to improve the accuracy of intrusion detection systems since last two decades. Some of the selected studies are discussed here. In [11], the researchers proposed D-FAC, an anomaly based distributed defense system. The proposed system detects the DDoS attacks and also reduces the impact. The system works by differentiating the genuine network traffic from DDoS attacks by using /-divergence metric, which is based on information theory. In experiments, the proposed system performed better in terms of Classification Rate, Detection Accuracy, False Positive Rate, Precision and F-measure. Researchers in [12] proposed a technique to detect spoofed and non-spoofed DDos attacks and also differentiated those attacks from flash crowds. For accurate detection, the proposed method implemented the source address entropy and traffic cluster entropy. The performance of proposed system is evaluated by using NS-2 simulations on Ubuntu platform with the accuracy measures of Detection Rate and False Positive Rate. Researchers in [13] purposed an Artificial Neural Network (ANN) based technique to detect and mitigate the TCP; UDP and ICMP DDoS attacks in real time environments. ANN is used to extract the hidden features, which differentiate the normal traffic from DDOS attack. The proposed approach performed better as compared to other approaches such as signature based techniques. In [14], the researchers proposed a method to differentiate the normal network traffic flow from DDoS attacks. When the proposed system detects an attack, a quarantine server separates the genuine users by using three access characteristics including (1) ‘user follows links’, (2) ‘sender accessed a popular page’, and (3) ‘the sender’s current average transmission interval’. The experiments validated that the proposed approach differentiated the normal traffic flow from attacks effectively. Researchers in [15] empirically evaluated the ability of several major information metrics to detect low rate and high rate DDoS attacks. For experiment, the researchers used ‘MIT Lincoln Laboratory’, ‘CAIDA’ and ‘TUIDS’ DDoS datasets and reflected the effectiveness of each of the used metric on detection. Researchers in [16] have used an approach to investigate the effectiveness of several web service frameworks that how well equipped they are to handle DoS attacks. The proposed approach aims to execute a large number of famous DoS attacks against a particular framework and then observe the way that framework classifies those attacks. According to results, four out of six frameworks are weak and vulnerable against at least one type of DoS attack, which reflects that many platforms including the popular ones require an urgent security improvements. Researchers in [17], presented a classification system for public clouds to detect and prevent DDoS TCP flood attacks. The proposed approach classifies the incoming packets and provides the security for the stored records. In detection phase, the system recognizes whether the incoming packet is from genuine user or from attacker. In prevention phase, the packets which are classified as abnormal are denied and the source IP address is considered as banned. In [18], the researchers have proposed a traceback method, based on entropy variations to detect DDoS. The proposed methods is different from other available traceback methods as it provides various advantages, such as it is: efficiently scalable, memory non intensive, independent of the traffic attack patterns and robust for packet pollution. In [19], the authors have presented a puppet attack, a new DOS attack which can cause the denial of service in an AMI network. In this attack, any node can be selected by the intruder as a puppet node where he can send attack packets, that puppet node can further send the attack packets to the network and consumes its bandwidth and energy which makes the packet delivery rate slow. The authors have also proposed a detection and prevention system for this attack type. In [20], the authors proposed a technique to detect DDoS attacks by using a fuzzy estimator which measures the packet inter arrival times. The proposed approach worked on two problems: detection of attacks and identification of the IP address which generates the attacks.
-
III. M aterials and M ethods
This research proposes a feature selection based classification framework to detect the DoS attacks.
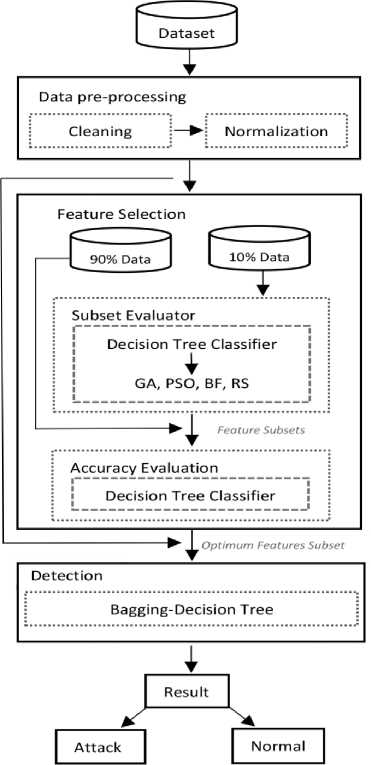
Fig.1. Proposed Classification Framework.
The proposed framework (Fig. 1) consists of five stages including: 1) Dataset selection, 2) Data preprocessing, 3) Feature Selection, 4) Detection, and 5) reflection of Results.
-
A. Dataset
The first stage deals with the extraction of relevant dataset. The dataset used in this research is available at [28] which is taken from a modified version of NSL KDD dataset [29, 30] whereas the original NSL KDD dataset was discussed in detail by [31]. The used dataset consists of 1 dependent and 41 independent features (Table 1). The dependent feature is known as output/target class and consists of either two values: ‘1 or 0’. ‘1’ reflects that the network data is abnormal (attack) and ‘0’ reflects the normal situation means ‘no attack’. The dependent feature is predicted on the basis of independent features. To analyze the performance of proposed framework, the target class is included in the dataset along with other variables so that the output results can be compared with these known values. The performance is measured in terms of various parameters such as: Precision, Recall, F measure, FP rate, Accuracy, MCC, and ROC.
Table 1. Features of NSL KDD Dataset
|
# |
Description |
# |
Description |
# |
Description |
# |
Description |
|
1 |
duration |
12 |
su_attempted |
23 |
srv_serror_rate |
34 |
dst_host_srv_diff_host_rat e |
|
2 |
src_bytes |
13 |
num_root |
24 |
rerror_rate |
35 |
dst_host_serror_rate |
|
3 |
dst_bytes |
14 |
num_file_creations |
25 |
srv_rerror_rate |
36 |
dst_host_srv_serror_rate |
|
4 |
Land |
15 |
num_shells |
26 |
same_srv_rate |
37 |
dst_host_rerror_rate |
|
5 |
wrong_fragment |
16 |
num_access_files |
27 |
diff_srv_rate |
38 |
dst_host_srv_rerror_rate |
|
6 |
urgent |
17 |
num_outbound_cmds |
28 |
srv_diff_host_rate |
39 |
protocol_type |
|
7 |
hot |
18 |
is_host_login |
29 |
dst_host_count |
40 |
service |
|
8 |
num_failed_logins |
19 |
is_guest_login |
30 |
dst_host_srv_count |
41 |
flag |
|
9 |
logged_in |
20 |
count |
31 |
dst_host_same_srv_rate |
||
|
10 |
num_compromised |
21 |
srv_count |
32 |
dst_host_diff_srv_rate |
||
|
11 |
root_shell |
22 |
serror_rate |
33 |
dst_host_same_src_port_rate |
-
B. Data Pre-Processing
Pre-processing is the second stage of proposed framework which deals with the cleaning and normalization of data. This stage facilitates the classification algorithms to bring effective results in minimum time by providing the standard and smooth data. Cleaning process works by replacing the missing values in any attribute by using an average mechanism. In this method, sum of all the values of selected features is divided by the number of total samples. On the other hand, the normalization process deals with the noisy values and keeps the feature values within a particular interval (-1 and 1).
-
C. Feature Selection
Feature selection is the third and the most important stage of classification framework which deals with the selection of an optimum set of features for effective results. This part of the proposed framework is inspired from [36]. It has been observed that in any dataset only few of the independent features can predict the target class effectively and remaining features do not participate well and even can reduce the performance of classifier if not removed. This stage is further divided into three sub stages. First sub stage starts by receiving the clean and normalized data, which is then divided into 2 subsets with 90% and 10% data. In second sub stage, feature selection is performed in which, Decision Tree is used in wrapper subset evaluator along with 4 widely used search techniques: Genetic Algorithm (GA), Particle Swarm
Optimization (PSO), Best First (BF), and Rank Search (RS). The subset with 10% clean and normalized data is used as input for this task. After this process, four subsets of features from the total 41 are extracted as shown in Table 2. In third sub stage, accuracy evaluation task is performed by using Decision Tree with each of the feature subset (selected by feature selection techniques: GA, PSO, BF, and RS).
In this task the second subset with 90% of clean and normalized data is used along with 9 proportions of training and test data (training data : test data) as shown in Table 3.
Table 2. Feature Subsets
|
FS Technique |
Selected Attributes |
No of Attributes |
|
Genetic Algorithm |
2,3,5,6,7,8,9,12,14,19,20,23,24, 26,27,29,31,34,35,36,40 |
21 |
|
Particle Swarm Optimization |
2,3,4,9,14,20,21,27,28,29,40,41 |
12 |
|
Best First Search |
2,20,31,33,40,41 |
6 |
|
Rank Search |
1,2,3,5,7,8,10,11,13,16,19,22,23 ,24,25,26,27,28,29,32,33,34,35, 36,37,38,39,40,41 |
29 |
These proportions are used for two reasons, 1) to analyze the performance dependency on the size of training data, 2) to get the average accuracy of all 9 ratios for each of the feature subset so that the feature subset with higher average accuracy can be selected for detection stage.
Table 3. Accuracy with Feature Selection Techniques
|
Partitions |
DT |
GA-DT |
PSO-DT |
BFS-DT |
RS-DT |
|
90-10 |
99.7715 |
99.7334 |
99.6954 |
99.6192 |
99.7334 |
|
80-20 |
99.7524 |
99.6382 |
99.3906 |
99.6763 |
99.7334 |
|
70-30 |
99.5811 |
99.6318 |
99.4668 |
99.5938 |
99.7080 |
|
60-40 |
99.5525 |
99.6477 |
99.4478 |
99.4668 |
99.6096 |
|
50-50 |
99.5658 |
99.5887 |
99.3830 |
99.5277 |
99.5582 |
|
40-60 |
99.4160 |
99.4351 |
99.3208 |
99.5112 |
99.5366 |
|
30-70 |
99.4287 |
99.5647 |
99.3417 |
99.4178 |
99.4233 |
|
20-80 |
99.3764 |
99.3145 |
99.2669 |
99.2764 |
99.4240 |
|
10-90 |
98.9421 |
97.9391 |
98.4808 |
98.9251 |
98.9844 |
|
Average Accuracy |
99.4873 |
99.3881 |
99.3104 |
99.4460 |
99.5234 |
Feature subset selected by RS reflected the highest average accuracy and is selected for detection stage.
-
D. Detection
Detection stage deals with the classification process in which Decision Tree is used along with Bagging. Complete dataset (cleaned and normalized) which was the output of Pre-processing phase is used as input in detection stage with 70:30 ratio of training and test data. The no of seed was increased to 3 in parameter optimization window of Bagging in Weka tool.
-
E. Results
False Positive (FP): ‘Instances which are actually negative but classified as positive’.
False Negative (FN): ‘Instances which are actually positive but classified as negative’.
True Negative (TN): ‘instances which are actually negative and also classified as negative’.
The performance of the proposed framework is evaluated through following measures: Precision, Recall, F measure, FP rate, Accuracy, MCC, and ROC.
Precision is the ratio of True Positive (TP) instances with respect to total number of modules, classified as positive [32, 33].
It is the last stage of the proposed framework and deals with the identification of data instances with the situation of ‘Attack’ or ‘Normal’. This stage thoroughly discussed in the next section. This study used Weka 3.8 for the experiments and simulations. Weka is one of the widely used data mining tool which is developed in Java language at the University of Waikato, New Zealand. It is widely accepted among students and researchers due to its portability, easy to use GUI and General Public License.
TP
Precision =--------- (TP + FP )
Recall is the ratio of True Positive (TP) instances with respect to the total number of instances which are actually positive [32, 33].
Re call =
TP
(TP + FN )
-
IV. R esults and D iscussion
This section discusses the results of proposed framework. Performance is evaluated by using various accuracy measures generated from confusion matrix (Fig. 2).
Precision * Recall * 2
F-measure =-------------------- (3)
(Precision + Recall)
False Positive Rate (FP rate), which is also known as the False Alarm Rate, is calculated as follows [7],
Actual Values
Attack (1) Normal (0)
ф ф Normal (0) о
Q ra Attack (1)
|
TP |
FP |
|
FN |
TN |
Fig.2. Confusion Matrix
FP Rate =
FP
TN + FP
Mathew’s Correlation Coefficient (MCC) is also considered as one of the widely used performance measure. It is defined as the ratio between the observed and predicted binary classifications [7], [33, 34].
The confusion matrix consists of various parameters which are as follows:
True Positive (TP): ‘Instances which are actually positive and also classified as positive’.
MCC =
________ TN * TP - FN * FP ________ 7 ( FP + TP )( FN + TP )(TN + FP )( TN + FN )
Accuracy is considered as the measurement rate of correct classification. It is the ratio of correctly classified modules to all modules [32, 34].
AUC =
1 + TPr - FPr
Accuracy =
TP + TN
TP + TN + FP + FN
The area under the ROC curve (AUC) is a measure of how well a parameter can distinguish between two classes (attack/normal) [8], [35].
During experiments, besides the proposed framework, we have also used other widely used classifiers and performed a detailed comparison in terms of Precision, Recall, F measure and FP rate, in Table 4. It can be seen that the proposed classification framework outperformed all other classifiers in both the classes (Normal, Attack).
Table 4. Performance Comparison
|
Classifier |
Class |
Precision |
Recall |
F-Measure |
FP Rate |
|
NB |
Normal |
0.894 |
0.938 |
0.916 |
0.123 |
|
Attack |
0.927 |
0.877 |
0.902 |
0.062 |
|
|
SVM |
Normal |
0.966 |
0.982 |
0.974 |
0.038 |
|
Attack |
0.980 |
0.962 |
0.971 |
0.018 |
|
|
MLP |
Normal |
0.971 |
0.990 |
0.980 |
0.032 |
|
Attack |
0.988 |
0.968 |
0.978 |
0.010 |
|
|
kNN |
Normal |
0.995 |
0.995 |
0.995 |
0.006 |
|
Attack |
0.994 |
0.994 |
0.994 |
0.005 |
|
|
DT |
Normal |
0.997 |
0.995 |
0.996 |
0.003 |
|
Attack |
0.994 |
0.997 |
0.996 |
0.005 |
|
|
RBF |
Normal |
0.968 |
0.988 |
0.978 |
0.036 |
|
Attack |
0.987 |
0.964 |
0.976 |
0.012 |
|
|
OneR |
Normal |
0.993 |
0.941 |
0.966 |
0.007 |
|
Attack |
0.938 |
0.993 |
0.965 |
0.059 |
|
|
PART |
Normal |
0.996 |
0.997 |
0.996 |
0.005 |
|
Attack |
0.997 |
0.995 |
0.996 |
0.003 |
|
|
BN |
Normal |
0.952 |
0.988 |
0.969 |
0.056 |
|
Attack |
0.986 |
0.944 |
0.965 |
0.012 |
|
|
RT |
Normal |
0.996 |
0.996 |
0.996 |
0.005 |
|
Attack |
0.996 |
0.995 |
0.996 |
0.004 |
|
|
Proposed Bagging-DT |
Normal |
0.997 |
0.997 |
0.997 |
0.003 |
|
Attack |
0.996 |
0.997 |
0.997 |
0.004 |
о
NB SVM MLP kNN DT RBF OneR PART BN RT Proposed
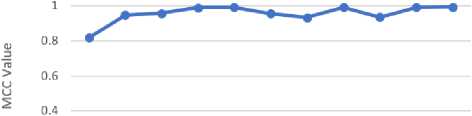
—•—MC.r 0.819 0.946 0.958 0.989 0.992 0.954 0.932 0.992 0.935 0.992 0.994
Fig.5. Comparison of MCC
Other performance measures such as: ROC, Accuracy and MCC are compared in Fig 3, Fig 4, and Fig 5 respectively. It can be seen that the proposed framework outperformed all other classifiers in each of these measures.
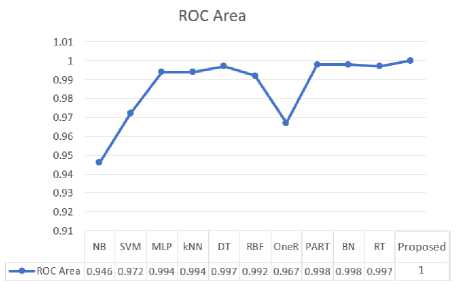
Fig.3. Comparison of ROC Area
RT
BN
PART
OneR
RBF
DT kNN MLP SVM
NB Proposed
^^^M 99.5772 96.7093
^^^^B 99.6229 96.5379 ■ 97.7034 ^^^^B 99.5887 ^^^M 99.4287 ^B 97.9205 ■ 97.2806
^^^^B 99.6801
86 88 90 92 94 96 98 100 102
■ Accuracy
Fig.4. Comparison of Accuracy
-
V. C onclusion and F uture W ork
Network intrusion detection is considered as one of the emerging research areas in the domain of network security. Intrusion detection systems aim to identify the user’s activity in the network as normal or strange (intrusion) and then respond accordingly. This research presented a classification framework by using feature selection and machine learning techniques. The proposed framework aimed to detect the Denial of Service (DoS) attacks in the network. Decision Tree (DT) in feature selection module worked as subset evaluator with four search methods including Genetic Algorithm (GA), Particle Swarm Optimization (PSO), Best First (BF), and Rank Search (RS). To extract the average accuracy of each feature subset, nine ratios of training and test data (10:90 – 90:10) are used and then the feature subset with the highest average accuracy is selected for the detection stage where Bagging is used with DT for classification. For experiment, a portion of modified NSL-KDD dataset is used and performance is evaluated by using various accuracy measures including: Precision, Recall, F measure, FP rate, Accuracy, MCC, and ROC. The performance of proposed framework is compared with 10 widely used classification techniques including Naïve Bayes (NB), Support Vector Machine (SVM), MultiLayer Perceptron (MLP), K-Nearest Neighbor (kNN), Decision Tree (DT), Radial Basis Function (RBF), One Rule (OneR), PART, Bayesian Network and Random Tree. According to results, the proposed framework outperformed all other classifiers in each accuracy measure. This research used a small portion NSL-KDD dataset so the results of proposed framework on the complete dataset can be different. Moreover, It is suggested for future work that the proposed classification framework should be used with different datasets so that its effectiveness can be analyzed.
References A classification framework to detect DoS attacks
- M. Ahmad, S. Aftab, and S. S. Muhammad, “Machine Learning Techniques for Sentiment Analysis: A Review,” Int. J. Multidiscip. Sci. Eng., vol. 8, no. 3, p. 27, 2017.
- M. Ahmad, S. Aftab, I. Ali, and N. Hameed, “Hybrid Tools and Techniques for Sentiment Analysis: A Review,” Int. J. Multidiscip. Sci. Eng., vol. 8, no. 3, 2017
- M. Ahmad and S. Aftab, “Analyzing the Performance of SVM for Polarity Detection with Different Datasets,” Int. J. Mod. Educ. Comput. Sci., vol. 9, no. 10, pp. 29–36, 2017.
- M. Ahmad, S. Aftab, and I. Ali, “Sentiment Analysis of Tweets using SVM,” Int. J. Comput. Appl., vol. 177, no. 5, pp. 25–29, 2017.
- M. Ahmad, S. Aftab, M. S. Bashir, N. Hameed, I. Ali, and Z. Nawaz, “SVM Optimization for Sentiment Analysis,” Int. J. Adv. Comput. Sci. Appl., vol. 9, no. 4, 2018.
- S. Aftab, M. Ahmad, N. Hameed, M. S. Bashir, I. Ali, and Z. Nawaz, “Rainfall Prediction in Lahore City using Data Mining Techniques,” Int. J. Adv. Comput. Sci. Appl., vol. 9, no. 4, 2018.
- N. Farnaaz and M. A. Jabbar, “Random Forest Modeling for Network Intrusion Detection System,” Procedia Comput. Sci., vol. 89, pp. 213–217, 2016.
- T. Fawcett, “An introduction to ROC analysis,” Pattern Recognit. Lett., vol. 27, no. 8, pp. 861–874, 2006.
- K. C. Khor, C. Y. Ting, and S. P. Amnuaisuk, “A feature selection approach for network intrusion detection,” Proc. - 2009 Int. Conf. Inf. Manag. Eng. ICIME 2009, pp. 133–137, 2009.
- J. Mirkovic and P. Reiher, “A taxonomy of DDoS attack and DDoS defense mechanisms,” ACM SIGCOMM Comput. Commun. Rev., vol. 34, no. 2, p. 39, 2004.
- S. Behal, K. Kumar, and M. Sachdeva, “D-FAC: A novel ϕ-Divergence based distributed DDoS defense system,” J. King Saud Univ. - Comput. Inf. Sci., 2018.
- J. Gera and B. P. Battula, “Detection of spoofed and non-spoofed DDoS attacks and discriminating them from flash crowds,” Eurasip J. Inf. Secur., vol. 2018, no. 1, 2018.
- A. Saied, R. E. Overill, and T. Radzik, “Detection of known and unknown DDoS attacks using Artificial Neural Networks,” Neurocomputing, vol. 172, pp. 385–393, 2016.
- K. Aburada, Y. Arikawa, S. Usuzaki, H. Yamaba, T. Katayama, M. Park, and N. Okazaki “Use of access characteristics to distinguish legitimate user traffic from DDoS attack traffic,” Artif. Life Robot., pp. 1-6, 2019.
- M. H. Bhuyan, D. K. Bhattacharyya, and J. K. Kalita, “An empirical evaluation of information metrics for low-rate and high-rate DDoS attack detection,” Pattern Recognit. Lett., vol. 51, pp. 1–7, 2015.
- R. A. Oliveira, N. Laranjeiro, and M. Vieira, “Assessing the security of web service frameworks against Denial of Service attacks,” J. Syst. Softw., vol. 109, pp. 18–31, 2015.
- A. Sahi, D. Lai, Y. Li, and M. Diykh, “An Efficient DDoS TCP Flood Attack Detection and Prevention System in a Cloud Environment,” IEEE Access, vol. 5, no. c, pp. 6036–6048, 2017.
- S. Yu, W. Zhou, R. Doss, and W. Jia, “Traceback of DDoS attacks using entropy variations,” IEEE Trans. Parallel Distrib. Syst., vol. 23, no. 3, pp. 412–425, 2012.
- P. Yi, T. Zhu, Q. Zhang, Y. Wu, and L. Pan, “Puppet attack: A denial of service attack in advanced metering infrastructure network,” J. Netw. Comput. Appl., vol. 59, pp. 325–332, 2016.
- S. N. Shiaeles, V. Katos, A. S. Karakos, and B. K. Papadopoulos, “Real time DDoS detection using fuzzy estimators,” Comput. Secur., vol. 31, no. 6, pp. 782–790, 2012.
- S. Aftab, M. Ahmad, N. Hameed, M. S. Bashir, I. Ali, and Z. Nawaz, “Rainfall Prediction using Data Mining Techniques: A Systematic Literature Review,” Int. J. Adv. Comput. Sci. Appl., vol. 9, no. 5, 2018.
- M. Ahmad, S. Aftab, M. S. Bashir, and N. Hameed, “Sentiment Analysis using SVM: A Systematic Literature Review,” Int. J. Adv. Comput. Sci. Appl., vol. 9, no. 2, 2018.
- G. P. M. De Farias, A. L. I. De Oliveira, and G. G. Cabral, “Extreme learning machines for intrusion detection systems,” Lect. Notes Comput. Sci. (including Subser. Lect. Notes Artif. Intell. Lect. Notes Bioinformatics), vol. 7666 LNCS, no. PART 4, pp. 535–543, 2012.
- M. H. Aghdam and P. Kabiri, “Feature selection for intrusion detection system using ant colony optimization,” Int. J. Netw. Secur., vol. 18, no. 3, pp. 420–432, 2016.
- A. R. A. Yusof, N. I. Udzir, A. Selamat, H. Hamdan, and M. T. Abdullah, “Adaptive feature selection for denial of services (DoS) attack,” 2017 IEEE Conf. Appl. Inf. Netw. Secur. AINS 2017, vol. 2018–Janua, pp. 1–4, 2018.
- P. Tang, R. A. Jiang, and M. Zhao, “Feature selection and design of intrusion detection system based on k-means and triangle area support vector machine,” 2nd Int. Conf. Futur. Networks, ICFN 2010, pp. 144–148, 2010.
- F. Zhang and D. Wang, “An effective feature selection approach for network intrusion detection,” Proc. - 2013 IEEE 8th Int. Conf. Networking, Archit. Storage, NAS 2013, pp. 307–311, 2013.
- “NSL-KDD-DoS.” [Online]. Available: https://github.com/shabibaftab/NSL-KDD-DoS/. [Accessed: 24-Apr-2019].
- “NSLKDD-Dataset.” [Online]. Available: https://github.com/InitRoot/NSLKDD-Dataset/. [Accessed: 24-Apr-2019].
- F. Botes, L. Leenen, and R. De La Harpe, “Ant colony induced decision trees for intrusion detection,” in 16th European Conference on Cyber Warfare and Security. ACPI, pp. 53–62, 2017
- M. Tavallaee, E. Bagheri, W. Lu, and A. A. Ghorbani, “A detailed analysis of the KDD CUP 99 data set,” in Proc. 2nd IEEE International Conference on Computational Intelligence for Security and Defense Applications. USA: IEEE Press, pp. 53–58, 2009
- K. O. Elish and M. O. Elish, “Predicting defect-prone software modules using support vector machines,” J. Syst. Softw., vol. 81, no. 5, pp. 649–660, 2008.
- A. Iqbal, S. Aftab, U. Ali, Z. Nawaz, L. Sana, M. Ahmad, and A. Husen “Performance Analysis of Machine Learning Techniques on Software Defect Prediction using NASA Datasets,” Int. J. Adv. Comput. Sci. Appl., vol. 10, no. 5, 2019.
- A. Iqbal and S. Aftab, “A Feed-Forward and Pattern Recognition ANN Model for Network Intrusion Detection,” Int. J. Comput. Netw. Inf. Secur., vol. 11, no. 4, pp. 19–25, 2019
- D. Rodriguez, I. Herraiz, R. Harrison, J. Dolado, and J. C. Riquelme, “Preliminary comparison of techniques for dealing with imbalance in software defect prediction,” Proc. 18th Int. Conf. Eval. Assess. Softw. Eng. ACM, pp. 1–10, 2014.
- I. S. Husam, A. A. B. Abuhamad, S. Zainudin, M. Sahani, and Z. M. Ali, “Feature selection algorithms for Malaysian dengue outbreak detection model,” Sains Malaysiana, vol. 46, no. 2, pp. 255–265, 2017.
