A Comparative Study between X_Lets Family for Image Denoising

Author: Beladgham Mohamed, Habchi Yassine, Moulay Lakhdar Abdelmouneim, Abdesselam Bassou, Taleb-Ahmed Abdelmalik
Journal: International Journal of Image, Graphics and Signal Processing(IJIGSP) @ijigsp
Article in issue: 3 vol.6, 2014.
Free access
Research good representation is a problem in image processing for this, our works are focused in developing and proposes some new transform which can represent the edge of image more efficiently, Among these transform we find the wavelet and ridgelet transform these both types transforms are not optimal for images with complex geometry, so we replace this two types classical transform with other effectiveness transform named bandelet transform, this transform is appropriate for the analysis of edges of the images and can preserve the detail information of high frequency of noisy image. De-noising is one of the most interesting and widely investigated topics in image processing area. In order to eliminate noise we exploit in this paper the geometrical advantages offered by the bandelet transform to solve the problem of image de-noising. To arrive to determine which type transform allows us high quality visual image, a comparison is made between bandelet, curvelet, ridgelet and wavelet transform, after determining the best transform, we going to determine which type of image is adapted to this transform. Numerically, we show that bandelet transform can significantly outperform and gives good performances for medical image type TOREX, and this is justified by a higher PSNR value for gray images.
Bandelet transform, Contourlet transform, Curvelet transform, Ridgelet transform, Quadtree segmentation
Short address: https://sciup.org/15013273
IDR: 15013273
Text of the scientific article A Comparative Study between X_Lets Family for Image Denoising
Image de-noising is one of the most popular research fields in image processing due to the fact that it is extremely difficult to form a general global de-noising scheme effective for all types of noise as well as all types of images. A common problem in image denoising is the blurring of the prominent edges in the image which can cause discrepancies when the denoising operation is combined with other operations such as image edge detection and segmentation. For image de-noising processing many classical methods can be applied to de-noise, such as wavelet has become a useful tool for analysis of many kinds of problems, wavelets are good at catching point singularities, but for linear singularity, wavelets transform cannot capture well. To overcome the weakness of wavelets in higher dimensions, Candes and Donoho [1] pioneered a new system of representations named ridgelets which they showed to deal effectively with line singularities in 2D, ridgelet [2] is a new perfect tool to analyze and synthesize the 2-dimensional and the high-dimensional singularities.
In the recent years, S.Mallat and E.Le Pennec proposed new transform named bandelet transform [3] construct a basis with a multiscale geometry adapted to image, can capture directional geometric image regularity and provide an optimal approximation for a more complex class of geometric images.
-
II. BANDELET TRANSFORM
Bandelet transform, introduced by E. Le Pennec and S. Mallat [4] built a base adapted to the geometric content of an image.
The bandelets are obtained from a local deformation of space to align the direction of regularity with a fixed direction (horizontal or vertical) and is reduced to a separable basis [5].
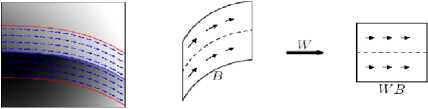
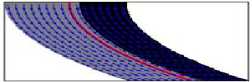
Figure 1. Example of model horizon and deformation of the field according to a geometric flow
-
A. FLOW-CURVE RELATIONSHIP
There is a constant correspondence between the flow along the vertical direction and curves whose tangent is never vertical; the flow associated with this curve is given by flow:
1 + | c ‘ ( x )| 2 V c'(x )
c ( x ) : Slope of optical flow.
We can generate the basic test bandelet according to the flow and geometric regularity of each sub-block. If there is no flow geometry in the sub-blocks, this means that the sub-block is uniformly regular so that we can use the classical separable wavelet basis for treating this sub-block. If not, the sub-block must be processed by the bandelet.
Also, the variation along geometric flow defined in the sub-block means that we can deform the sub-block in horizontal or vertical direction, in this case we can say that the sub-block is uniformly regular.
Calculates the Lagrangian allows us to determine subblock that contains the singularity [6].
L ( f , R , B ) = || f - fA I2 + a t 2 X ( R g + R b ) (2)
X : Lagrangian multiplier.
T : Quantifiction step.
RjG : is the number of bits to code the optical flew in each square.
RjB : is the number of bits to code the quantized bandelet coefficients.
fR : is the reconstructed 1D signal by thresholding the coefficients smaller than T . The optimal direction in each dyadic sub-region can be defined as
9 opt = arg 9 min L ( f , 9, T )
Then the corresponding 1D wavelet coefficients to opt t is defined as bandelet coefficients and the 9„„, optimal direction opt t is recorded for reconstructing image. [7]
-
B. QUADTREE SEGMENTATION
Segmentation operation it is a division of image space that allows us to have a set of sub-blocks.
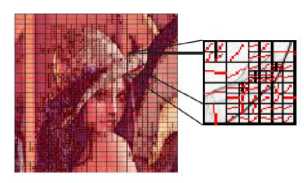
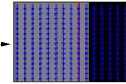
Figure 2. Example of quadtree segmentation
The operating diagram of the quadtree segmentation is the following.
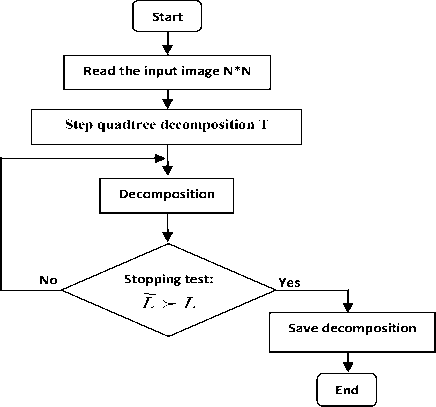
Figure 3. Segmentation quadtree diagram
The optimal segmentation is defined with [8]:
L о ( S ) = min { L о ( S ) ~ ( S ) } (4)
Where
~ ( S ) = L 0 ( S 1 ) + L 0 ( S 2 ) + L 0 ( S 3 ) + L о ( S 4 ) + L о ( S ) + X T 2 (5)
L o ( St ) : Lagrangian of sub-blocks.
-
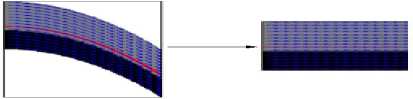
C. THE OPERATOR OF DEFORMATION
The deformation operation is a local operation on a block that contains a curve singularity to align or correct in a direction horizontal and vertical.
(a) (b)
function ф , the same construction gives a biorthogonal basis of L 2 ( fi ) .
III. DIAGRAM OF OPERATION
(c)
Figure 4. Segmentation Example of model horizon and deformation of the field according to a geometric flow. Image distortion: (a) an image having a horizontal flow, (b) its image by the operator W, (c) an image having a vertical flow, (d) the image by the operator W
(d)
Note that the two-dimensional Wavelet basis is:
ф j,n1 ( x 1 ) W j,n 2 ( x 2 )
• W j , n 1 ( x 1 ) ф n 2 ( x 2 )
W j , n 1 ( x l W j , n 2 ( x 2 )
Deformation operation gives a wavelet orthonormal basis of L ( fi ) :
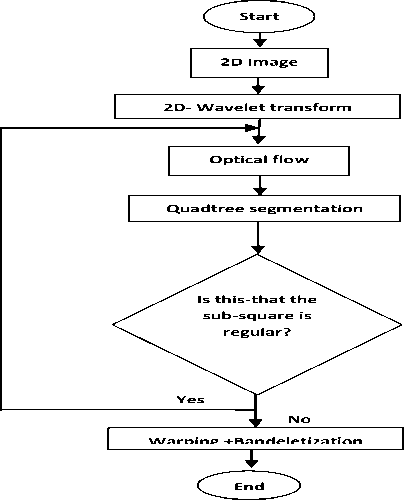
Figure 5. Bandelet transform operation diagram
Ф J,П 1 ( x 1 ) W j,n 2 ( x 2 - c ( x 1 )) • W j , n 1 ( x 1 ) ф j,n 2 ( x 2 - c ( x 1 )) ’
W j , n 1 ( x 1 ) W j , n 2 ( x 2 - c ( x 1 ))
W V
The vertical j , n and diagonal
wd
, n Wavelets have
vanishing moments along contour, they are therefore suitable for the approximation of function f is regular
WH along contour is not the case of horizontal wavelet j,n , to be replaced by new functions:
IV. QUALITYEVALUATION PARAMETER
The Peak Signal to Noise Ratio (PSNR) is the most commonly used as a measure of quality of reconstruction in image compression. The PSNR were identified using the following formulate:
MSE =
1 M . N
M - 1 N - 1Г A
. EX I ( i, j ) - 1 ( i, j )
i = 0 j = 0
W l , n 1 ( x 1 ) W j , n 2 ( x 2 - c ( x 1 ))
This is called bandeletization and we check it is implemented by a simple 1D discrete Wavelet transform [9], [10].
The orthonormal basis of bandelet of field warping is defined by:
Mean Square Error (MSE) which requires two MxN gray scale images I and I where one of the images is considered as a compression of the other is defined as:
• The PSNR is defined as:
PSNR = 10.log10
-^^[dB ]
MSE
W l,n1 (x 1 ) W j , n 2 ( x 2 - c ( x 1 )) '
W j,n1 ( x 1 ) j 2 ( x 2 - c ( x 1 ))
V jnA x 1) W j,n 2 ( x 2 - c ( x 1 )),
W lHn W Vn W JD n
j Д ) n 1 , n 2
The orthogonality property is not sufficient; we take the bandelet dimensional biorthogonal W and its scaling
Usually an image is encoded on 8 bits. It is represented by 256 gray levels, which vary between 0 and 255, the extent or dynamics of the image is 255.
• The structural similarity index (SSIM):
The PSNR measurement gives a numerical value on the damage, but it does not describe its type. Moreover, as is often noted in [11], [12], [13], it does not quite
represent the quality perceived by human observers. For medical imaging applications where images are degraded must eventually be examined by experts, traditional evaluation remains insufficient. For this reason, objective approaches are needed to assess the medical imaging quality. We then evaluate a new paradigm to estimate the quality of medical images, specifically the ones compressed by wavelet transform, based on the assumption that the human visual system (HVS) is highly adapted to extract structural information. The similarity compares the brightness, contrast and structure between each pair of vectors, where the structural similarity index (SSIM) between two signals x and y is given by the following expression:
SSIM ( x , y ) = l ( x , y ) c ( x , y ) s ( x , y ) (12)
Finally the quality measurement can provide a spatial map of the local image quality, which provides more information on the image quality degradation, which is useful in medical imaging applications. For application, we require a single overall measurement of the whole image quality that is given by the following formula:
MSSIM ( I , l )= ^ К SSIM ( l i , I i )
Where I and I are respectively the reference and т т degraded images, i and i are the contents of images at the i-th local window.
M : the total number of local windows in image. The MSSIM values exhibit greater consistency with the visual quality.
-
• CORRELATION COEFFICIENT (CC)
The correlation coefficient, r , is widely used in statistical analysis, and image processing for compared two images of the same object (or scene). The r value indicates whether the object has been altered or moved. The correlation coefficient is defined as
E(x - xm Xyi - ym )
r = । i , (14)
A Z( xi- xm )2 . Кyi- ym )2 ii
Where i is the intensity of the ith pixel in image 1, i is the intensity of the ith pixel in image 2, m is the mean intensity of image 1, and ym is the mean intensity of image 2.
The correlation coefficient has the value r = 1 if the two images are absolutely identical, r = 0 if they are completely uncorrelated, and r =— 1 if they are completely anti-correlated. [14].
-
V. RESULTS AND DISCUSSION
In this article, we give numerical experiments to test our denoising method. For this reason we opted for a set of medical images (MRI, CT, ECHO and TOREX) gray scale coded on 8 bits per pixel. These images are taken from the GE Medical System (database) [15]. The importance of our work lies in the possibility of reducing the noise for which the image quality remains acceptable. Estimates and judgments of the de-noised image quality are given by the PSNR evaluation parameters and the MSSIM similarity Index.
For each application we vary sigma value 0.06 to 0.4 and calculate the PSNR and MSSIM. The results obtained are given in Table1 and Table2.
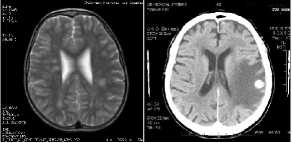
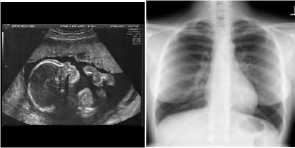
Figure 6. Popular test images (a) MRI, (b) CT, (c) ECHO, (d) TOREX
Here, we adopt test image MRI of size 512x512 encoded by 8 bits per pixel, and with quadtree quantization T=10, the experimental of this results are compared with other value of quadtree quantization T=30. The experimental results are shown in table 1.
TABLE 1. NUMERICAL RESULTS OBTAINED AFTER MRI IMAGE DE-NOISING FOR T=10 AND T=30
|
Sigma STEP (T) |
0.06 |
0.08 |
0.1 |
0.4 |
|
|
О II H |
PSNR (dB) |
29.86 66 |
28.1657 |
26.841 8 |
17.484 6 |
|
MSSIM |
0.783 5 |
0.7405 |
0.7158 |
0.4784 |
|
|
о m II H |
PSNR (dB) |
31.25 75 |
29.5726 |
28.085 9 |
18.031 4 |
|
MSSIM |
0.812 6 |
0.7783 |
0.7503 |
0.5214 |
|
-
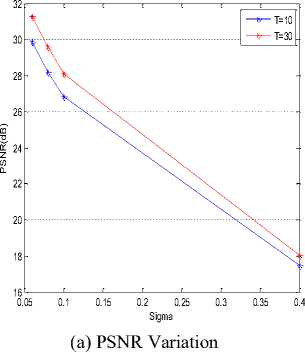
8. (c), and it also marks that the PSNR decreases and this can be explained by increasing of sigma value which represents the noise variation that any role that degrade the quality visual of image.
0. 05 0.1 0.15 0.2 0.25 0.3 0.35 0.4
After showed the effectiveness of our algorithm for T = 30, this value is fixed in the following work. We have extended this study to a set of medical images, to demonstrate the effectiveness of bandelet transform, we vary the noise variance (sigma) and calculating the evaluation parameters (PSNR, MSSIM); we obtain the following results (Table 2):
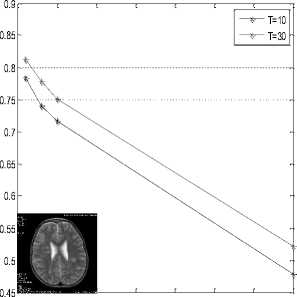
Sigma
(b) MSSIM Variation
TABLE 2. NUMERICAL RESULTS OBTAINED AFTER CT,
ECHO AND TOREX IMAGE DE-NOISING FOR T=30
|
to |
Image |
|||||
|
CT |
ECHO |
TOREX |
||||
|
PSN R(dB) |
MSS IM |
PSNR (dB) |
MSSI M |
PSNR (dB) |
MSSI M |
|
|
0.0 |
29.70 |
0.81 |
28.67 |
0.776 |
32.51 |
0.810 |
|
6 |
23 |
09 |
89 |
6 |
78 |
6 |
|
0.0 |
27.78 |
0.77 |
27.19 |
0.730 |
31.05 |
0.768 |
|
8 |
28 |
02 |
03 |
3 |
77 |
3 |
|
0.1 |
26.05 |
0.73 |
26.05 |
0.688 |
29.89 |
0.735 |
|
52 |
74 |
59 |
8 |
23 |
4 |
|
|
0.4 |
17.61 |
0.48 |
19.27 |
0.468 |
21.38 |
0.549 |
|
57 |
42 |
40 |
3 |
82 |
4 |
|
Figure 7. Comparisons of MRI denoising image using bandelet transform between T=10 to T=30
(a) (b)
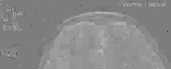
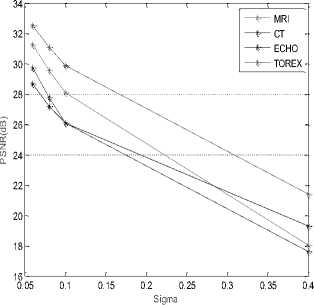
Figure 9. Comparisons between MRI, CT, ECHO and TOREX denoising image using bandelet transform for T=30
(c)
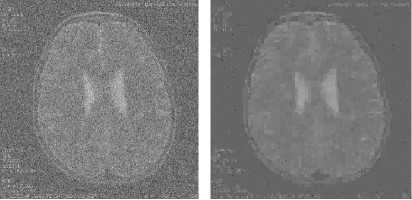
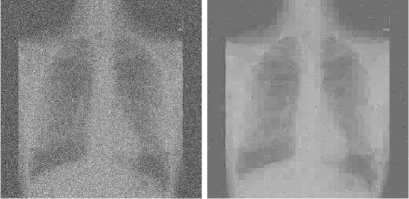
Figure 8. Denoising MRI images for different values of quadtree quantization T : (a) Noise image, (b) De-noising image for T=10, (c) De-noising image for T=30.
It can be seen from Table 1, that our algorithm presents excellent de-noising performance for T=30, Fig
(a)
(b)
(d)
(c)
(e) (f)
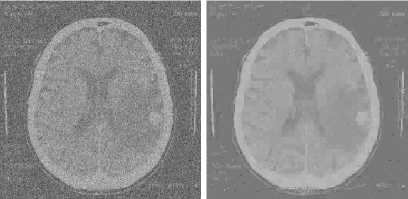
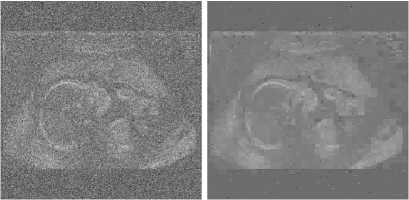
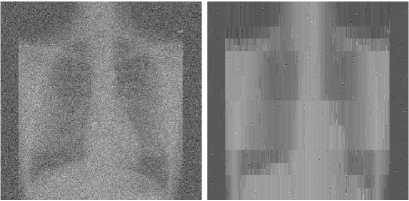
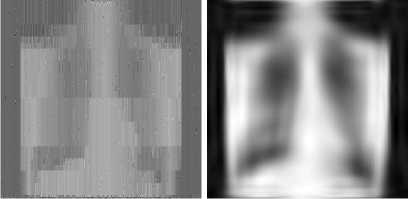
Figure 10. Denoising CT, ECHO and TOREX images for T=30:
(a) Noise CT image, (b) Denoising CT image, (c) Noise ECHO image, (d) Denoising ECHO image, (e) Noise TOREX image, (f) Denoising TOREX image
After comparing between the four curves In Fig 9. We can see that the bandelet transform is very effective and adaptable to TOREX image compared to MRI, CT images and ECHO this is justified by the values of PSNR.
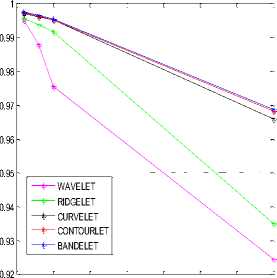
In the following, we make a comparative study of filtering between bandelet, contourlet, curvelet, ridgelet transforms and wavelet in TOREX medical image. The results obtained are as follows:
(a) (b)
(c) (d)
(e)
Figure 11. (a) Noise TOREX image, (b) Denoising TOREX image using wavelet transform, (c) Denoising TOREX image using ridgelet transform, (d) Denoising TOREX image using curvelet transform, (e) Denoising TOREX image using contourlet transform.
WAVELET RIDGELET CURVELET CONTOURLET BANDELET

Rc(bpp)
Figure 12. Comparisons between bandelet, contourlet, curvelet, ridgelet and wavelet transform for TOREX image
From Fig 12, we clearly perceive the importance of the bandelet transform compared with wavelet, ridgelet, curvelet transform and contourlet; this is proven with the PSNR values.
Fig 13 shown correlation coefficients results for a five transforms types used in de-noising domain to detect changes in an image.
0.05 0.1 0.15 0.2 0.25 0.3 0.35 0.4
SIGMA
Figure. 13 Comparisons between correlation coefficient for a five wavelet transforms
From the figure above we can say that the correlation coefficient from bandelet transform gives better results compared to other types of transforms.
After showing the performance of the de-noising medical images, we apply our algorithm to the denoising satellite images. We are interested in this application by the satellite image gray scale coded on 8 bpp of size 512x512.
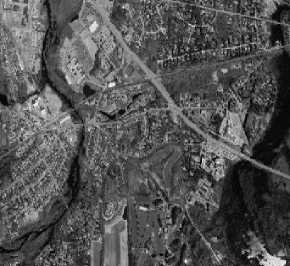
Figure 14. SATELLITE image
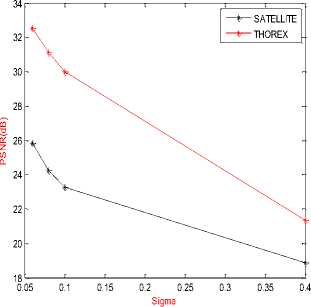
Figure 15. Comparisons between TOREX and SATELLITE denoising image using bandelet transform for T=30
(a)
(b)
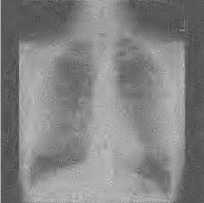
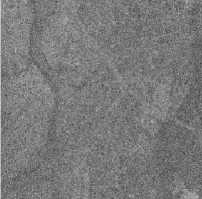
Figure. 16 Denoising SATELLITE for T=30:
-
(a) Noise SATELLITE image, (b) De-noising SATELLITE image.
From Fig 15, we see that the gain between satellite image and medical is very important, which shows the effectiveness of the de-noising image using bandelet transform for medical image (TOREX).
-
VI. CONCLUSION
In this paper, we presented a new de-noising algorithm using a new transform used in processing image, which is called bandelets transform. The proposed method was applied for comparison between two type image (medical and satellite) of size 512X512X8 pixels contaminated by random noise. The comparison between different image using bandelet transform allows us to check the superiority of the bandelet transform in medical image which’s justified by the PSNR and MSSIM highest values. Moreover, the bandelet transform provides compact representation and a major improvement compared to other classical transforms. We can assure that the bandelet transform outperforms the wavelet, the ridgelet, and the curvelet transform in term of PSNR values and visual quality which is the most pleasant among the all. The performance of the de-noising algorithm using the bandelet transform also performs well even in the cases where we have images with very high frequencies.
In the future we are going to work into defining a strategy to exploit the bandelet transform for image compression.
References A Comparative Study between X_Lets Family for Image Denoising
- B. Schiener, "Applied Cryptography", John Wiley & Sons, 1996.
- A. K. Jain, A. Ross, and S. Pankanti, "Biometrics: A Tool for Information Security," IEEE Trans on Information Forensics and Security, vol. 1, no. 2, pp. 125-143, 2006.
- A.K. Jain, A. Ross, S. Prabhakar, “An Introduction to biometric recognition”, IEEE Transactions on Circuits and Systems for Video Technology, 14(1):4-20, 2004.
- A. Ross, K. Nandkumar, and A. K. Jain. "Handbook of Multibiometrics", Springer Verlag, 2006.
- J. Daugman, "Probing the uniqueness and randomness of Iris Codes: Results from 200 billion iris pair comparisons," Proc. IEEE, vol. 94, no. 11, pp. 1927-1935, 2006.
- J. Bhatnagar, and A. Kumar, "On Estimating Some Performance Indices for Biometric Identification," Pattern Recognition, vol. 42, no. 5, pp. 1805-1818, 2009.
- Y. Adini, Y. Moses, S. Ullman, “Face recognition: the problem of compensating for changes in illumination direction”, IEEE Transactions on Pattern Analysis and Machine Intelligence, 19(7):721-732, 1997.
- R G. Gallager, "A Simple Derivation of the Coding Theorem and Some Applications," IEEE Trans on Info. Theory, vol. 11, No. 1, 1965, pp. 3-18.
- R. Duda, P. Hart, and D. Stork, "Pattern Classification", Wiley student edition, 1997.
- J. Ortega-Garcia, J. Bigun, D. Reynolds, J. Gonzalez-Rodriguez, “Authentication gets personal with biometrics”, IEEE Signal Processing Magazine, 21(2):50-62, 2004.
- M. Farenzena, L. Bazzani, A. Perina, V. Murino, and M. Cristani. “Person re-identi?cation by symmetry-driven accumulation of local features”, In Computer Vision and Pattern Recognition, pages 2360–2367, 2010.
- D. Gorodnichy and R. Hoshino “Calibrated con?dence scoring for biometric identi?cation”, In Proceedings of NIST International Biometric Performance Conference, 2010.
- S C. Dass, Y. Zhu, and A. K. Jain, "Validating a Biometric Authentication: Sample size requirements," IEEE Transactions on Pattern Analysis and Machine Intelligence, vol. 28, pp. 1902 - 1919, 2006.
- N.K. Ratha, J.H. Connell, R.M. Bolle, “Enhancing security and privacy in biometrics-based authentication systems” IBM Systems Journal, 40(3):614-634, 2001.
- R. Ryan: The importance of biometric standards. Biometric Technology Today, 17(7):7-10, 2009.
- F. Deravi: Biometrics standards. Advances in biometrics, 473-489, 2008.
- J. Bhatnagar, and A. Kumar, "On Some Performance Measures for Biometric Identification," Proc. of IEEE ICB, 2007, pp. 1035 - 1048.
- Y. Zhu, S.C. Dass, and A.K Jain, "Statistical Models for Assessing Individuality of Fingerprints," EEE Trans. on Information Forensics and Security, vol. 2, no. 3, pp. 391-401, 2007.
- J. Bhatnagar, A. Kumar, and N. Saggar, "A Novel Approach to Improve Biometric Recognition Using Rank Level Fusion," Proc. of IEEE CVPR, 2007, pp. 43-51.
- Jain, A. K., Flynn, P. J. & Ross, A. eds., 2007, “Handbook of biometrics”, Springer.
- Jain, A. K., Nandakumar, K., & Nagar, A., 2008, “Biometric Template Security”, EURASIP Journal on Advances in Signal Processing, vol. 2008, Article ID 579416.
- Li, S. Z. & Jain, A. K. eds., 2005, “Handbook of face recognition”, Springer.
- Prabhakar, S. Pankanti, S., & Jain, A. K., 2003, “Biometric recognition: security & privacy concerns”, IEEE Security & Privacy Magazine, 1(2), pp. 33-42.
- Ross, A., Nandakumar, K., & Jain, A.K., 2006, “Handbook of multibiometrics”, Springer.
- J. Bhatnagar, and A. Kumar, "Estimating Minimum Sample Size Requirements for Reliable Identification," Proc. of IEEE CVPR, 2006, pp. 18- 25.
- Rowe, R. K., 2005, “A multispectral sensor for fingerprint spoof detection Sensors”, 22(1), pp. 1-4.
- Wayman, J., Jain, A. K., Maltoni, D., & Maio, D. eds., 2005, “Biometric systems: technology, design and performance evaluation”, Springer.
