A Comprehensive Study to Analyze Student Evaluations of Teaching in Online Education

Author: Nyme Ahmed, Sultanul Arifeen Hamim, Dip Nandi
Journal: International Journal of Modern Education and Computer Science @ijmecs
Article in issue: 5 vol.16, 2024.
Free access
The rise of online education has changed the way students usually learn by making educational materials easier to get to and creating a global learning community. While online education offers numerous benefits, it is also crucial to acknowledge its certain drawbacks, such as the potential reduction in interaction between students and teachers, which might increase signs of isolation among students and impede opportunities for collaborative learning. Therefore, Student Evaluations of Teaching (SET) play a critical role in identifying areas for improvement from the students' standpoint, thereby promoting constructive communication between students and teachers. This research conducts a comparison among the traditional Educational Data Mining (EDM) techniques to find out the best-performing classifier for analyzing student evaluations of teaching online. It is accomplished by first extracting the dataset from the student evaluations of teaching at X-University and then applying six different classifiers to the dataset that were extracted. The results demonstrated that Logistic Regression, Naive Bayes, and K-Nearest Neighbors (KNN) exhibited a notably high level of accuracy compared to other classification techniques. The findings of this research will provide guidance for future researchers in applying a wider range of classification techniques to extensive datasets and in implementing the necessary adjustments to achieve superior results.
Educational Data Mining, Online Education, Student Evaluations of Teaching, Classification
Short address: https://sciup.org/15019528
IDR: 15019528 | DOI: 10.5815/ijmecs.2024.05.07
Text of the scientific article A Comprehensive Study to Analyze Student Evaluations of Teaching in Online Education
Student Evaluations of Teaching (SET) refers to a widely adopted practice in academia where students provide feedback and assessments of their learning experiences and instructors. This process involves students sharing their opinions, perceptions, and evaluations of the courses they have taken and the effectiveness of the instructors who taught those courses. SET typically includes the assessment of various aspects such as teaching methods, course content, instructor communication, and overall satisfaction with the learning experience. [1]. In the ever-evolving landscape of higher education, digital technologies have brought about profound changes, particularly in online learning. This shift has required the development of novel methods for evaluating and improving teaching efficacy, a responsibility typically fulfilled by Student Evaluations of Teaching (SET) [2]. Online education, which has witnessed exponential growth in recent years, offers unique challenges and opportunities for evaluating teaching effectiveness [3]. The traditional SET, often criticized for its reliance on subjective student perceptions and potential biases, is transforming. The integration of sophisticated data mining algorithms offers a new lens through which to interpret these evaluations, providing richer, more nuanced insights into the teaching and learning process [4].
This research aims to investigate the effectiveness of several data mining and data science techniques in analyzing SET data, specifically in an entirely online educational setting. This investigation is not solely theoretical, but rather motivated by the practical necessity to comprehend and improve the caliber of online education. The objective of the research is to explore the use of various algorithms to extract more profound insights from SET data, which is typically extensive and intricate. The importance of this study is in its capacity to impact educational practices and policy. Through the utilization of data science, educators and institutions can transcend the use of simple number scores and generic comments. By utilizing the abundant data found in online Student Evaluation of Teaching (SETs), educators can pinpoint certain areas of proficiency and deficiency, customize instructional methods, and eventually, improve the overall educational journey for students. As online learning continues to grow and evolve, the role of data science in education becomes increasingly significant. This paper seeks to contribute to the broader discourse on enhancing teaching quality in online environments, presenting data-driven insights that can inform both pedagogy and policy.
The study is comprised of six sections, which are structured as follows, an introduction is found in section 1, followed by a summary of the overall situation of student evaluations of teaching in section 2. The methodology is stated in section 3. Section 4 and 5 includes the analysis of the obtained data and findings. Lastly, section 6 consists of the conclusion and discussion.
2. Background Study 2.1. The Emergence and Significance of SET in Modern Education
In the dynamic landscape of modern education, the significance of Student Evaluations of Teaching (SET) has soared as classrooms transition to digital realms. Serving as a vital compass for universities, SET in the online environment is not merely a feedback tool but a key player in elevating teaching quality, informing tenure and promotion decisions, and showcasing institutional accountability [12]. The evaluation process in this digital domain necessitates a nuanced approach, delving into aspects unique to online learning. It involves probing the clarity of communication facilitated by online tools, ensuring seamless resource accessibility, and gauging the responsiveness of instructors in the virtual realm. Beyond the confines of traditional metrics, the performance assessment in online SET delves into the adaptability of educators to virtual platforms, the artful integration of technology, and the crafting of an inclusive and captivating online learning community [2,3]. In this digital era where education evolves, SET emerges as the compass navigating universities toward excellence, blending innovation, inclusivity, and accountability to sculpt the future of online learning.
Study [12] explored factors influencing students' perceptions of instructional efficacy using data from a Course Evaluation Survey (CES) with 3798 participants. It revealed a strong correlation between teaching efficacy and instructor demeanor, grading methodology, expertise, course characteristics, and learning outcomes. Another study [13] focused on 280 students in online marketing courses, finding that those rating online courses more effective had a weaker academic profile. The Marketing Strategy course received higher evaluations. In a study [9] with 974 participants, SET and a modified questionnaire showed around 90% positive perception of SET. It emphasized the importance of distinguishing between senior and junior faculty in assessments, establishing a robust correlation between SET ratings and student perceptions, including ties to grades and academic discipline. An investigation [14] involving 93 medical students used a computer-aided evaluation, revealing a 63.8% response rate and raising concerns about Likert-scaled areas like class size and teaching methods.
2.2. The Application of Data Mining in Analyzing SET
The integration of Educational Data Mining (EDM) in analyzing Student Evaluations of Teaching (SET) marks a significant advancement in educational research. EDM employs a range of sophisticated algorithms to delve into complex datasets, extracting valuable insights that were previously unattainable through traditional analysis methods [15]. The perspective concentrates on amalgamating algorithms with SET, with Vasconcelos (2012) proposing key rule
2.3. Selection of Classification Techniques
3. Methodology
mining, a data mining-based technique for identifying significant associations. Scientific analyses, such as those by Boring [16].
Implementing data mining in the analysis of student evaluations of teaching in online education is vital for several reasons. Firstly, data mining techniques, particularly Educational Data Mining (EDM), offer an efficient means to analyze and predict student achievements and challenges in the online learning environment. This approach enables educational institutions to enhance the quality of education delivery by identifying patterns and trends in student data, facilitating more effective teaching methods. Additionally, data mining allows for tailored interventions, helping educators identify and support struggling students through personalized learning plans or additional resources. The predictive nature of data mining algorithms aids in proactively addressing potential shortcomings, contributing to improved student outcomes. Comparative analyses of different classifiers further guide educators in selecting the most effective algorithms for assessing student evaluations of teaching. Overall, data mining plays a crucial role in adapting to the challenges of online learning, providing insights that may not be readily apparent through traditional assessment methods and paving the way for ongoing research and improvement in educational practices [1 0,11,15,25]. Parallel to sentiment analysis, some study employs several decision tree algorithms to categorize courses based on their effectiveness. These algorithms include Naïve Bayes, J48, Random Forest, and Random Tree, each offering unique strengths in pattern recognition and classification. For instance, Naïve Bayes, known for its simplicity and effectiveness, is used to predict the likelihood of a course being rated highly based on various features extracted from the SET data. The J48 decision tree, a more complex algorithm, is adept at handling large datasets and extracting intricate patterns, making it suitable for identifying specific factors that contribute to a course's effectiveness [17,18,19,20,27]. Random Forest and Random Tree algorithms add further depth to the analysis. Random Forest, comprising multiple decision trees, provides a more comprehensive view by considering a wide array of hypotheses about the data, thereby enhancing the accuracy of the predictions. The Random Tree algorithm, on the other hand, offers a simpler but effective approach, focusing on randomly selected subsets of the data to identify key trends and patterns [21,22,23,24].
Despite these advancements, there are challenges inherent in the use of data mining for SET analysis. Concerns over data privacy, the representativeness of feedback, and the potential for bias warrant careful consideration. Additionally, the complexity of interpreting qualitative data and the need for context-specific analysis underline the necessity of a balanced and ethical approach. The future of Set-in online education is likely to see further integration of artificial intelligence and machine learning techniques. These technologies promise to enhance predictive analytics in education and offer new metrics for evaluating teaching effectiveness. As online learning continues to grow, the role of data science in understanding and improving the educational experience will be increasingly significant [1,2,26].
This study specifically focuses on the application of various data mining techniques, to thoroughly analyze student evaluations. The evaluations, sourced from computer science students across three semesters, provide a diverse array of student experiences and perceptions, offering a rich dataset for analysis.
The classification and analysis of Student Evaluations of Teaching (SET) employ diverse machine learning classifiers, including Logistic Regression, Naive Bayes, Decision Tree, Random Forest, Support Vector Machine (SVM), and K-Nearest Neighbors (KNN). Logistic Regression predicts the likelihood of positive or negative course ratings based on extracted features. Naive Bayes categorizes courses by effectiveness, assuming feature independence. Decision Tree, an interpretable model, identifies specific factors impacting teaching effectiveness. Random Forest, an ensemble method, offers a comprehensive view by considering multiple hypotheses. SVM classifies courses based on effectiveness, accommodating various evaluation criteria. KNN, a simple yet effective algorithm, identifies patterns in student evaluations, aiding in course categorization [9,14,24]. Therefore, previous researchers have successfully addressed various problems in SET using the previously mentioned six classification techniques. In light of this, the six classification techniques that have been discussed will be used through the process of this study.
In Fig. 1, the experimental workflow for analyzing Student Evaluations of Teaching (SET) data is presented. The dataset, sourced from X University, encompasses 27,622 records spanning 701 sections across 35 distinct courses. Following data preprocessing for data mining, opinions undergo analysis. The SET dataset encompasses numeric values for five factors. Leveraging Weka for k-means clustering is employed to group class-level data. Subsequently, six classifiers - Logistic Regression, Naive Bayes, Decision Tree, Random Forest, Support Vector Machine, and K-Nearest Neighbors (KNN) - are utilized to identify significant factors influencing SET. The proposed workflow aims to aggregate findings for a comprehensive discussion and understanding of the SET data's underlying patterns.
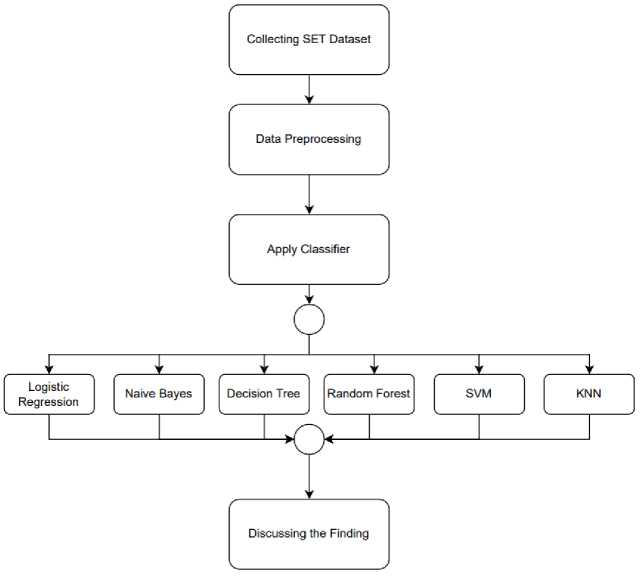
Fig. 1. Flowchart of the SET data analysis
4. Data Collection and Preprocessing
The dataset is obtained from the SET reports of computing students at X University throughout three distinct online semesters. The dataset comprises 27,622 SET records, encompassing over 35 distinct courses of Computer Science department. All students engaged in this Student Evaluation of Teaching (SET) survey via the university site after the semester. Table 1 presents the sample size of students and sections for 35 distinct courses taught consecutively in three online semesters.
Table 1. Description of the SET dataset
|
Name of the Semester |
Academic Year |
Students Count |
|
Spring |
2020-21 |
9654 |
|
Summer |
8595 |
|
|
Fall |
2021-22 |
9373 |
Every SET comprises a total of twenty questions. The purpose of these twenty questions is to assess five distinct aspects of teaching excellence, with each aspect consisting of four specific questions. The Likert scale is employed to assign a numerical value to each question, ranging from one to five. The factor names are displayed in the table 2 below.
Table 2. Key Factors of the SET dataset
|
Factor Tag |
Factor Description |
|
Factor 1 (FT1) |
Knowledge of the Subject Matter |
|
Factor 2 (FT2) |
Instructional Strategies and Motivation Techniques |
|
Factor 3 (FT3) |
Personality Traits |
|
Factor 4 (FT4) |
Student-Faculty Relation |
|
Factor 5 (FT5) |
Routine Matters |
A factor-wise rating is determined by computing the average score of its four questions. A composite rating is derived by computing the mean of these five parameters. The SET questionnaire is located in Appendix A. Table 3 below provides the titles of the courses along with their corresponding tag numbers.
Table 3. Courses name in SET dataset
|
Code |
Course Description |
|
C1 |
Introduction to Computer Studies |
|
C2 |
Introduction to Programming |
|
C3 |
Introduction to Programming Lab |
|
C4 |
Discrete Mathematics |
|
C5 |
Object Oriented Programming 1 |
|
C6 |
Introduction to Database |
|
C7 |
Data Structure |
|
C8 |
Algorithms |
|
C9 |
Object Oriented Programming 2 |
|
C10 |
Object Oriented Analysis and Design |
|
C11 |
Theory of Computation |
|
C12 |
Data Communication |
|
C13 |
Software Engineering |
|
C14 |
Artificial Intelligence and Expert System |
|
C15 |
Computer Networks |
|
C16 |
Computer Organization and Architecture |
|
C17 |
Operating System |
|
C18 |
Web Technologies |
|
C19 |
Compiler Design |
|
C20 |
Computer Graphics |
|
C21 |
Research Methodology |
|
C22 |
Advance Database Management System |
|
C23 |
Data Warehousing and Data Mining |
|
C24 |
Human Computer Interaction |
|
C25 |
Software Development Project Management |
|
C26 |
Software Requirement Engineering |
|
C27 |
Software Quality and Testing |
|
C28 |
Programming in Python |
|
C29 |
Advanced Programming with .Net |
|
C30 |
Advanced Programming in Web Technology |
|
C31 |
CS Math |
|
C32 |
Basic Graph Theory |
|
C33 |
Advanced Operating System |
|
C34 |
Computer Vision and Pattern Recognition |
|
C35 |
Network Security |
The dataset comprises 35 distinct courses, as previously stated. The courses are classified into three groups based on their overall SET score using the k-means clustering technique. We have classified these three groups as highly efficacious courses, efficacious courses, and courses requiring improvement, as indicated in table 4 below.
Table 4. Categories of class level based on the SET overall rating by using k-means clustering
|
Class Level Description for the Course |
Overall Rating of SET |
Number of Course |
|
Needs improve |
Less than 4.17 |
16 |
|
Effective |
4.17 to 4.57 |
18 |
|
Very effective |
4.58 to 5 |
1 |
Based on the overall rating of SET, three categories of courses are found, where one course is very effective, eighteen courses are effective, and sixteen courses are identified for improvement. Class level-wise course tags are provided below in below table 5.
Table 5. Grouping the courses based on overall rating of SET
|
Class Level Description for the Course |
Course Code |
|
Needs to improve (Overall Rating < 4.17) |
C7, C8, C10, C11, C12, C13, C14, C15, C17, C18, C19, C20, C26, C28, C31, C33 |
|
Effective (4.17 <= Overall Rating <= 4.57 |
C1, C2, C3, C4, C5, C6, C9, C16, C21, C22, C23, C25, C27, C29, C30, C32, C34, C35 |
|
Very effective (4.58 <= Overall Rating <= 5) |
C24 |
5. Result Analysis
Delving into the Result Analysis section of the paper on student evaluations of teaching, the exploration embarks on a systematic journey into the insights derived from diverse methodologies and models. The aim is to unravel the complexities inherent in assessing and understanding student evaluations of teaching across various dimensions. Starting by meticulously examining confusion matrices generated by Logistic Regression, Naive Bayes, Decision Tree
Classifier, Random Forest, Support Vector Machine, and K-Nearest Neighbors algorithms, scrutiny is applied to the predictive capabilities and limitations of each model. Subsequently, the focus shifts to the nuanced intricacies revealed by Classifier Accuracy Comparisons, highlighting the strengths and weaknesses of these algorithms in predicting student outcomes. The exploration extends further into the correlation matrix, shedding light on the intricate relationships among different factors and their collective impact on the Overall Rating. This multifaceted analysis not only unveils the performance metrics of individual algorithms but also contributes to a broader understanding of the interconnected variables influencing the holistic assessment of student achievement. Navigating through the Result Analysis, the section endeavors to provide a comprehensive perspective, enriching the discourse on effective methodologies for evaluating and comprehending student evaluations of teaching in educational settings.
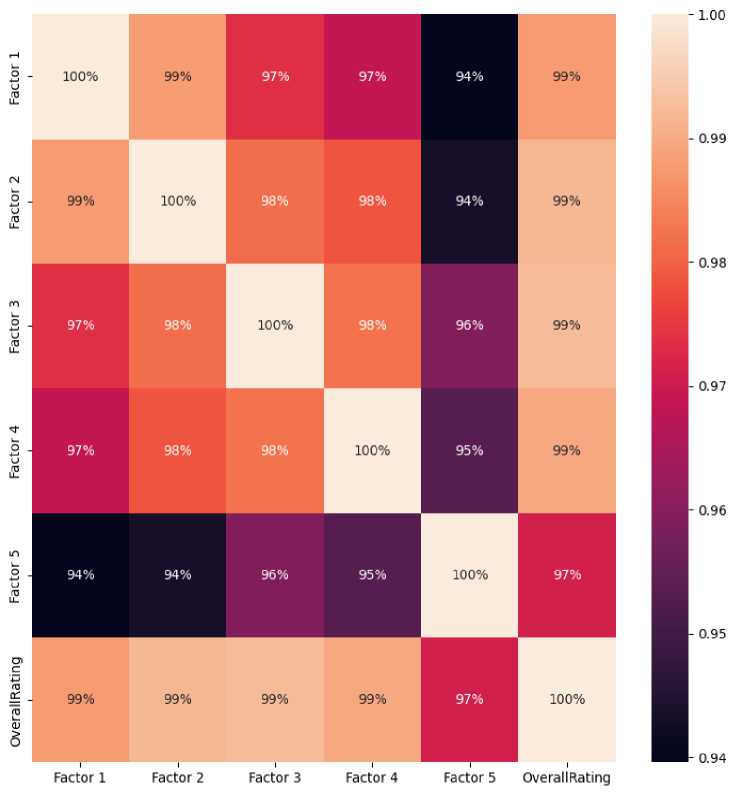
Fig. 2. Correlation matrix for the factors and overall rating of SET
In the realm of student evaluations of teaching, the correlation matrix presented in fig 2 encapsulates the intricate relationships among various factors (Factor 1 to Factor 5) and the Overall Rating, providing a nuanced understanding for researchers and educators alike. The values along the diagonal of the matrix represent the correlation of each factor with itself, yielding perfect correlations of 1.000. As we traverse the off-diagonal elements, a compelling pattern emerges. Notably, Factor 3 exhibits strong positive correlations with all other factors, ranging from 0.959 to 0.982, indicating a consistent influence on student evaluations of teaching. Similarly, Factors 1, 2, and 4 demonstrate high positive correlations above 0.97 with Overall Rating, emphasizing their collective impact on the comprehensive evaluation.
The matrix unveils that the factors are interrelated, each contributing significantly to the Overall Rating. This interconnectedness is particularly evident in the consistently high correlation coefficients observed among the factors. Factor 2, for instance, showcases a substantial positive correlation with all other factors, signifying its broad influence on diverse aspects of student evaluations of teaching. Moreover, the Overall Rating demonstrates robust correlations with each factor, underscoring the holistic nature of the evaluation process.
These findings hold profound implications for educators and policymakers, highlighting the multi-faceted nature of student evaluations of teaching. The strong correlations indicate that a comprehensive approach to student assessment, considering multiple factors, is crucial for a nuanced and accurate evaluation. This research contributes valuable insights to the educational community, informing the design of assessment frameworks that account for the intricate relationships among various performance indicators. As we delve deeper into the complex web of correlations, this study lays the groundwork for a more informed and effective approach to student evaluations of teaching, fostering a holistic understanding that goes beyond traditional assessments.
Table 6. Confusion matrices of all six algorithms
|
Confusion Matrices |
||||
|
Logistic Regression |
Actual |
|||
|
Effective |
Needs Improve |
Very Effective |
||
|
Predicted |
Effective |
89 |
0 |
0 |
|
Needs Improve |
2 |
70 |
0 |
|
|
Very Effective |
2 |
0 |
13 |
|
|
Naive Bayes |
Actual |
|||
|
Effective |
Needs Improve |
Very Effective |
||
|
Predicted |
Effective |
87 |
1 |
1 |
|
Needs Improve |
2 |
70 |
0 |
|
|
Very Effective |
0 |
0 |
15 |
|
|
Decision Tree Classifier |
Actual |
|||
|
Effective |
Needs Improve |
Very Effective |
||
|
Predicted |
Effective |
85 |
4 |
0 |
|
Needs Improve |
3 |
69 |
0 |
|
|
Very Effective |
0 |
0 |
15 |
|
|
Random Forest Classifier |
Actual |
|||
|
Effective |
Needs Improve |
Very Effective |
||
|
Predicted |
Effective |
85 |
4 |
0 |
|
Needs Improve |
2 |
70 |
0 |
|
|
Very Effective |
2 |
0 |
13 |
|
|
Support Vector Machine (SVM) |
Actual |
|||
|
Effective |
Needs Improve |
Very Effective |
||
|
Predicted |
Effective |
89 |
0 |
0 |
|
Needs Improve |
2 |
70 |
0 |
|
|
Very Effective |
6 |
0 |
9 |
|
|
K-Nearest Neighbors (KNN) |
Actual |
|||
|
Effective |
Needs Improve |
Very Effective |
||
|
Predicted |
Effective |
88 |
1 |
0 |
|
Needs Improve |
2 |
70 |
0 |
|
|
Very Effective |
0 |
0 |
0 |
|
The confusion matrices outlined in table 6 provide insights into the performance of various classifiers in assessing student evaluations of teaching. Commencing with the Logistic Regression algorithm, the emphasis lies on accurate predictions aligned along the diagonal of each matrix. In the first column, out of 93 instances of Effective student classes, 89 were correctly predicted as Effective. Simultaneously, all 70 instances in the second column were accurately predicted as Needs Improvement, and the third column saw all 13 instances correctly predicted as Very Effective.
Transitioning to the Naive Bayes classifier, the focus remains on accurate predictions along the diagonal of the matrix. In the first column, out of 89 instances of Effective student classes, 87 were correctly predicted as Effective. The second column reveals that 70 instances were accurately predicted as Needs Improvement, out of the total 71 instances in that class. The third column witnessed all 15 instances correctly predicted as Very Effective, with no misclassifications in this category. The Decision Tree Classifier, as illustrated in table 6, is characterized by accurate predictions situated along the diagonal of each matrix. In the first column, out of 89 instances of Effective student classes, 85 were correctly predicted as Effective. The second column shows that 69 instances were accurately predicted as Needs Improvement out of the total 72 instances in that class. The third column indicates that all 15 instances were correctly predicted as Very Effective, with no misclassifications in this category. Moving on to the Random Forest Classifier, the confusion matrix, presented in Table xx, is interpreted for a comprehensive understanding. The emphasis is on accurately predicted instances aligned along the diagonal of each matrix. In the first column, out of 89 instances of Effective student classes, 85 were correctly predicted as Effective. The second column shows that 70 instances were accurately predicted as Needs Improvement out of the total 72 instances in that class. The third column indicates that 13 instances were correctly predicted as Very Effective, with 2 instances misclassified in this category. For the Support Vector Machine (SVM) classifier, the confusion matrix in Table xx is explained, highlighting accurate predictions positioned along the diagonal of each matrix. In the first column, out of 89 instances of Effective student classes, all were correctly predicted as Effective. The second column reveals that 70 instances were accurately predicted as Needs Improvement out of the total 72 instances in that class. The third column indicates that 9 instances were correctly predicted as Very Effective, with 6 instances misclassified in this category. Finally, the K-Nearest Neighbors (KNN) classifier is examined based on the provided confusion matrix. The focus remains on accurately predicted instances along the diagonal of each matrix. In the first column, out of 89 instances of Effective student classes, 88 were correctly predicted as Effective. The second column shows that 70 instances were accurately predicted as Needs Improvement out of the total 72 instances in that class. The third column indicates that there were no instances misclassified as Very Effective; however, the classifier did not predict any instances in this category.
Table 7. Performance Summary of Logistic Regression Algorithm
|
Class |
Logistic Regression |
|||
|
Precision |
Recall |
F1-score |
Support |
|
|
Effective |
0.96 |
1.00 |
0.98 |
89 |
|
Needs Improve |
1.00 |
0.97 |
0.99 |
72 |
|
Very Effective |
1.00 |
0.87 |
0.93 |
15 |
Table 8. Performance Summary of Naïve Bayes Algorithm
|
Class |
Naïve Bayes |
|||
|
Precision |
Recall |
F1-score |
Support |
|
|
Effective |
0.98 |
0.98 |
0.98 |
89 |
|
Needs Improve |
0.99 |
0.97 |
0.98 |
72 |
|
Very Effective |
0.94 |
1.00 |
0.97 |
15 |
Table 9. Performance Summary of Decision Tree Classifier Algorithm
|
Class |
Decision Tree Classifier |
|||
|
Precision |
Recall |
F1-score |
Support |
|
|
Effective |
0.97 |
0.96 |
0.96 |
89 |
|
Needs Improve |
0.95 |
0.96 |
0.95 |
72 |
|
Very Effective |
1.00 |
1.00 |
1.00 |
15 |
Table 10. Performance Summary of Random Forest Algorithm
|
Class |
Random Forest |
|||
|
Precision |
Recall |
F1-score |
Support |
|
|
Effective |
0.96 |
0.96 |
0.96 |
89 |
|
Needs Improve |
0.95 |
0.97 |
0.96 |
72 |
|
Very Effective |
1.00 |
0.87 |
0.93 |
15 |
Table 11. Performance Summary of SVM Algorithm
|
Class |
Supper Vector Machine (SVM) |
|||
|
Precision |
Recall |
F1-score |
Support |
|
|
Effective |
0.92 |
1.00 |
0.96 |
89 |
|
Needs Improve |
1.00 |
0.97 |
0.99 |
72 |
|
Very Effective |
1.00 |
0.60 |
0.75 |
15 |
Table 12. Performance Summary of KNN Algorithm
|
Class |
K-Nearest Neighbors (KNN) |
|||
|
Precision |
Recall |
F1-score |
Support |
|
|
Effective |
0.98 |
0.99 |
0.98 |
89 |
|
Needs Improve |
0.99 |
0.97 |
98 |
72 |
|
Very Effective |
1.00 |
1.00 |
1.00 |
15 |
The Performance Summary of table 7 to 12 provides a comprehensive evaluation of six algorithms employed for assessing student evaluations of teaching: Logistic Regression, Naïve Bayes, Decision Tree Classifier, Random Forest, Support Vector Machine (SVM), and K-Nearest Neighbors (KNN). Each algorithm's performance is measured in terms of Precision, Recall, and F1-score across three classes: Effective, Needs Improvement, and Very Effective. The Logistic Regression model demonstrates high precision across all classes, particularly excelling in the Effective class with a precision of 0.96. Naïve Bayes exhibits balanced performance across precision, recall, and F1 -score, showcasing robust accuracy in predicting each class. The Decision Tree Classifier and Random Forest display commendable precision and recall, achieving notable F1 scores in all classes. SVM exhibits strong precision and recall for the Needs Improve class, while KNN demonstrates excellent performance across all metrics, with perfect precision, recall, and F1-score for the Very Effective class. This comprehensive summary provides valuable insights into the strengths and weaknesses of each algorithm, aiding in selecting the most suitable model for evaluating student evaluations of teaching.
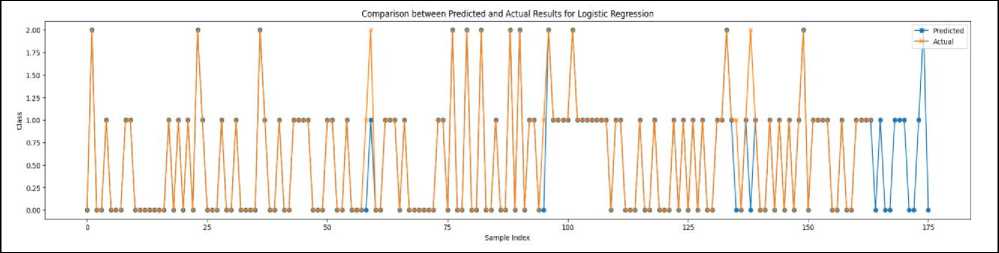
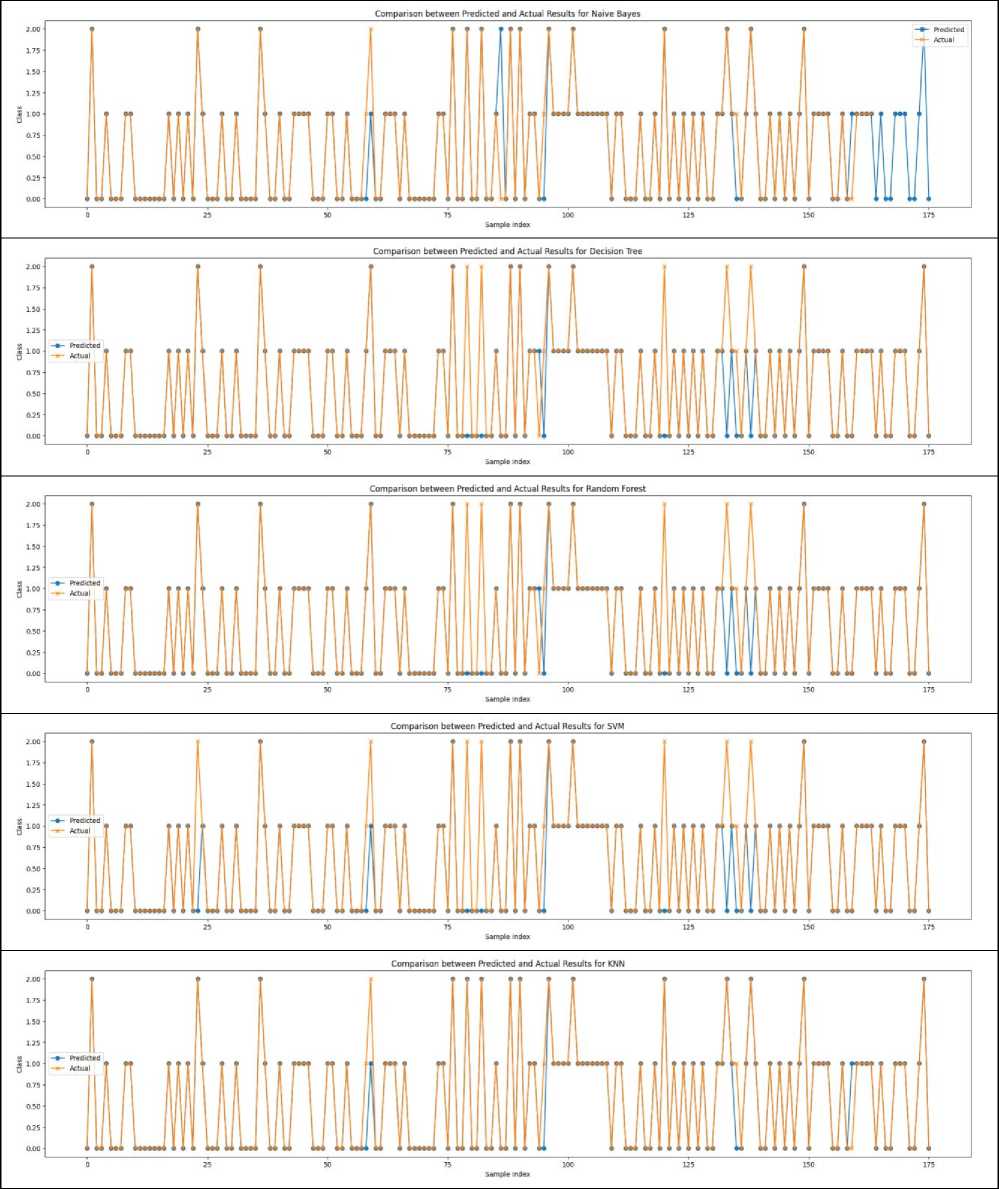
Fig. 3. Comparison between the Predicted and Actual Results of Six Algorithms
This fig 3 detailing the Comparison between Predicted and Actual results using six algorithms, namely Logistic Regression, Naive Bayes, Decision Tree Classifier, Random Forest, SVM, and KNN, unveils nuanced insights into the performance of each model in evaluating student evaluations of teaching. Remarkably, Logistic Regression, Naive Bayes, and KNN emerge as the top-performing algorithms, boasting the highest accuracy in predicting student outcomes. However, even in the case of these high-performing models, a subtle contrast is observed between the predicted values and the actual results, as depicted in the above figure. This underscores the inherent complexity of predicting student evaluations and the need for a nuanced understanding of the predictive capabilities and limitations of each algorithm.
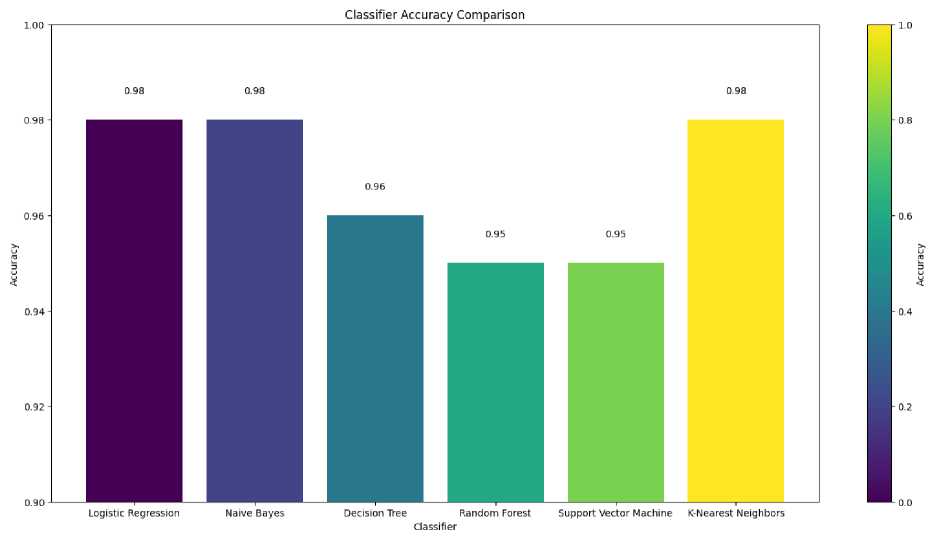
Fig. 4. Classifier Accuracy Comparison of six algorithms
Fig. 4 illustrates the outcomes of our Classifier Accuracy Comparison, offering insights into the efficacy of diverse machine learning algorithms for predicting student evaluations of teaching. Our evaluated algorithms, namely Logistic Regression, Naive Bayes, Decision Tree, Random Forest, Support Vector Machine (SVM), and K-Nearest Neighbors (KNN), have been appraised based on their individual accuracy scores. Notably, Logistic Regression and Naive Bayes emerges as a standout performer with an impressive accuracy score of 0.98, underscoring its robust proficiency in classifying student evaluations of teaching. Leveraging probabilistic models, Naive Bayes demonstrates particular prowess in navigating large datasets with high dimensionality. Following closely, K-Nearest Neighbors achieves an identical accuracy score of 0.98. Known for its non-parametric and instance-based learning approach, KNN excels in pattern recognition and classification tasks, rendering it well-suited for predicting student evaluations of teaching. The Decision Tree algorithm showcases a commendable accuracy of 0.96, highlighting its capacity to make decisions based on a series of conditions. The hierarchical structure of decision trees enhances interpretability, facilitating a deeper understanding of the decision-making processes at play. Both Random Forest and Support Vector Machine present robust accuracies at 0.95, underscoring their applicability in student evaluations of teaching. Random Forest's ensemble methodology, combining multiple decision trees, bolsters robustness and generalization. In contrast, SVM excels in identifying optimal hyperplanes for class separation in high-dimensional spaces.
6. Conclusion and Discussion
The exploration into the effectiveness of data mining and data science methods in analyzing Student Evaluations of Teaching (SET) data in online educational settings has unveiled compelling insights. The intricate relationships among factors influencing student evaluations of teaching, as highlighted in the correlation matrix, emphasize the need for a comprehensive approach to assessment. The interconnectedness of factors underscores the importance of considering multiple indicators for a nuanced and accurate evaluation of student achievement.
The performance of several classifiers is thoroughly examined by the confusion matrix studies, which highlight the advantages and disadvantages of each model for forecasting student results. Different algorithms demonstrate differing degrees of accuracy when categorizing pupils into Effective, Needs Improvement, and Very Effective categories: Logistic Regression, Naive Bayes, Decision Tree Classifier, Random Forest, Support Vector Machine, and K-Nearest Neighbors. These insights help educators and institutions choose models that are in line with their assessment objectives by offering a useful understanding of each algorithm's predictive capacity. The algorithms' strengths are further elucidated in the performance summary by means of measurements such as Precision, Recall, and F1-score. While K-Nearest Neighbors performs exceptionally well for the Very Effective class across all criteria, Naive Bayes excels in precision. This thorough analysis helps determine which models are best suited for particular assessment criteria, directing the use of data science methods to improve the caliber of instruction.
The effectiveness of machine learning algorithms is clearly highlighted by the Classifier Accuracy Comparison, where Naive Bayes stands out as a top performer. Robust accuracies are also shown by K-Nearest Neighbors, Decision Tree, Random Forest, and Support Vector Machine, indicating their applicability for student evaluations of teaching prediction. Based on the intended balance between accuracy and interpretability, this comparison analysis helps researchers and educators make well-informed decisions about algorithm selection.
This study makes a substantial contribution to the conversation on assessing the efficacy of instruction in online learning environments. Extrapolating significant insights from SET data requires the use of data mining techniques, such as various algorithms. The results highlight the necessity of a comprehensive evaluation strategy, considering how interrelated the variables affecting students' evaluations of teaching are. These findings can be used by educators and policymakers to create evaluation systems that are compatible with the intricacies of virtual learning environments. As online education continues to evolve, the integration of data science techniques holds immense potential for improving educational practices. The challenges highlighted, such as data privacy and the need for context-specific analysis, underscore the importance of a balanced and ethical approach. Future advancements in online education are likely to witness increased integration of artificial intelligence and machine learning techniques, further enhancing predictive analytics and offering new metrics for evaluating teaching effectiveness. In the future, more advanced or emerging machine learning techniques will be used to evaluate SET data, potentially revealing deeper insights due to their ability to handle complicated patterns.
Appendix A. Questions for Student Evaluations of Teaching (SET)
|
Factor |
Questions |
|
1. Knowledge of the Subject Matter |
outline or syllabus.
|
|
2. Instructional Strategies and Motivation Techniques |
students, proper decorum and orderliness in the classroom.
presentations and discussions.
discussed and acknowledges students’ good responses and participation. |
|
3. Personality Traits |
with the students inside and outside of the classroom.
|
|
4. Student-Faculty Relation |
|
|
5. Routine Matters |
|
References A Comprehensive Study to Analyze Student Evaluations of Teaching in Online Education
- Clayson, D.E., 2009. Student evaluations of teaching: Are they related to what students learn? A meta-analysis and review of the literature. Journal of marketing education, 31(1), pp.16-30.
- Ahmed, N., Rifat-Ibn-Alam, M.G.A., Akib, S.N.S. and Nandi, D., 2022. An Extensive Analysis on Computing Students' Academic Performance in Online Environment using Decision Tree. Turkish Journal of Computer and Mathematics Education (TURCOMAT), 13(1), pp.149-163.
- Shefat, S.N., Akib, M.G.A., Ahmed, N. and Nandi, D., 2022. Investigation of Computing Students’ Performances in a Fully Online Environment During COVID-19 Pandemic. Malaysian Journal of Science and Advanced Technology, pp.23-30.
- Wright, S.L. and Jenkins-Guarnieri, M.A., 2012. Student evaluations of teaching: Combining the meta-analyses and demonstrating further evidence for effective use. Assessment & Evaluation in Higher Education, 37(6), pp.683-699.
- Kiersma, M.E., Chen, A.M., Kleppinger, E.L., Blake, E.W., Fusco, N.M., Mody, V., Gillespie, M.E., Knell, M. and Zavod, R.M., 2016. Evaluation of criteria utilized in the recognition of teaching excellence awards. Currents in Pharmacy Teaching and Learning, 8(4), pp.477-484.
- Hornstein, H.A., 2017. Student evaluations of teaching are an inadequate assessment tool for evaluating faculty performance. Cogent Education, 4(1), p.1304016.
- Alhija, F.N.A., 2017. Teaching in higher education: Good teaching through students’ lens. Studies in Educational Evaluation, 54, pp.4-12.
- Appleton, J.J., Christenson, S.L. and Furlong, M.J., 2008. Student engagement with school: Critical conceptual and methodological issues of the construct. Psychology in the Schools, 45(5), pp.369-386.
- Spooren, P. and Christiaens, W., 2017. I liked your course because I believe in (the power of) student evaluations of teaching (SET). Students’ perceptions of a teaching evaluation process and their relationships with SET scores. Studies in educational evaluation, 54, pp.43-49.
- Park, E. and Dooris, J., 2020. Predicting student evaluations of teaching using decision tree analysis. Assessment & Evaluation in Higher Education, 45(5), pp.776-793.
- Sojka, J., Gupta, A.K. and Deeter-Schmelz, D.R., 2002. Student and faculty perceptions of student evaluations of teaching: A study of similarities and differences. College Teaching, 50(2), pp.44-49.
- Mohammed, T.A. and Pandhiani, S.M., 2017. Analysis of factors affecting student evaluation of teaching effectiveness in Saudi higher education: the case of Jubail University college. American Journal of Educational Research, 5(5), pp.464-475.
- Estelami, H., 2016. An Exploratory Study of the Effects of Online Course Efficiency Perceptions on Student Evaluation of Teaching (SET) Measures. American Journal of Business Education, 9(2), pp.67-82.
- Lim, S.D., Lee, J., ParK, H.S., Yu, J.R., Lee, K.Y., Sohn, I.S. and Lee, R., 2008. Experience and consideration on online course evaluation by medical students. Korean Journal of Medical Education, 20(4), pp.367-371.
- Ahmed, N., Nandi, D. and Zaman, A.G.M., 2022. Analyzing student evaluations of teaching in a completely online environment. Int. J. Mod. Educ. Comput. Sci, 6, pp.13-24.
- Zhang, W., Qin, S., Jin, H., Deng, J. and Wu, L., 2017. An empirical study on student evaluations of teaching based on data mining. Eurasia Journal of Mathematics, Science and Technology Education, 13(8), pp.5837-5845.
- Saa, A.A., Al-Emran, M. and Shaalan, K., 2020. Mining student information system records to predict students’ academic performance. In The International Conference on Advanced Machine Learning Technologies and Applications (AMLTA2019) 4 (pp. 229-239). Springer International Publishing.
- Pisani, S., Fioriti, D., Conte, M.P., Chiarini, F., Seganti, L. and Degener, A.M., 2002. Involvement of herpes simplex virus type 2 in modulation of gene expression of human papillomavirus type 18. International Journal of Immunopathology and Pharmacology, 15(1), pp.59-63.
- Asif, R., Merceron, A., Ali, S.A. and Haider, N.G., 2017. Analyzing undergraduate students' performance using educational data mining. Computers & education, 113, pp.177-194.
- Saa, A.A., 2016. Educational data mining & students’ performance prediction. International journal of advanced computer science and applications, 7(5).
- Kabakchieva, D., 2013. Predicting student performance by using data mining methods for classification. Cybernetics and information technologies, 13(1), pp.61-72.
- Chen, X. and Ishwaran, H., 2012. Random forests for genomic data analysis. Genomics, 99(6), pp.323-329.
- Boring, A., 2017. Gender biases in student evaluations of teaching. Journal of public economics, 145, pp.27-41.
- Shahiri, A.M. and Husain, W., 2015. A review on predicting student's performance using data mining techniques. Procedia Computer Science, 72, pp.414-422.
- Ahmed, N. and Shefat, S.N., 2022. Performance Evaluation of Data Mining Classification Algorithms for Predicting Breast Cancer. Malaysian Journal of Science and Advanced Technology, pp.90-95.
- Akib, M.G.A., Ahmed, N., Shefat, S.N. and Nandi, D., 2022. A Comparative Analysis among Online and On-Campus Students Using Decision Tree.
- Shefat, S.N., Ahmed, N. and Ahad, M.T., 2023. Analyzing the Impact of COVID‐19 on the Mental Health of Students. International Journal of Computer and Information System (IJCIS), 4(2), pp.79-86.
