A Content based Image Retrieval Framework Using Color Descriptor

Author: Abdelkhalak Bahri, Hamid Zouaki
Journal: International Journal of Computer Network and Information Security(IJCNIS) @ijcnis
Article in issue: 1 vol.8, 2016.
Free access
In this work, we propose an image search method by visual content (CBIR), which is based on the color descriptor. The proposed method take account the spatial distribution of colors and make the signature partially invariant under rotation. The basic idea of our method is to use circular shift (clockwise or anti-clockwise direction) and mirror (horizontal direction and vertical direction respectively) matching scheme to measure the distance between signatures. Through some experiments, we show that this approach leads to a significant improvement in the quality of results.
Color, Signature, Thumbnails, EMD, CBIR
Short address: https://sciup.org/15011488
IDR: 15011488
Text of the scientific article A Content based Image Retrieval Framework Using Color Descriptor
Published Online January 2016 in MECS
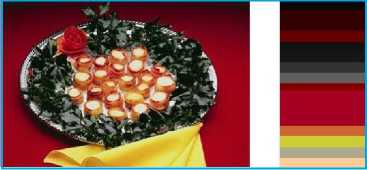
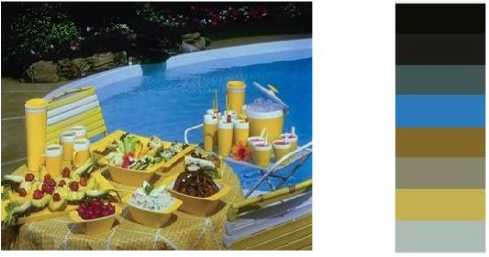
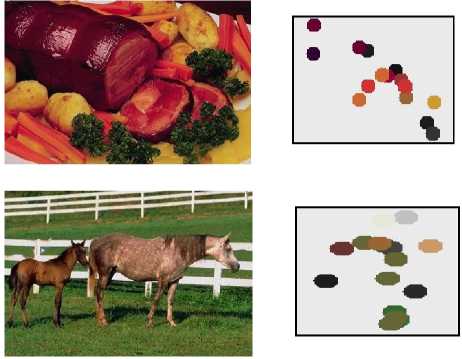
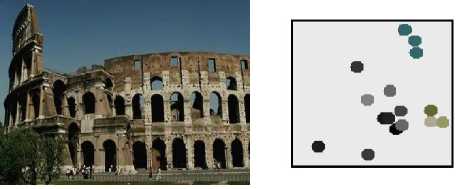
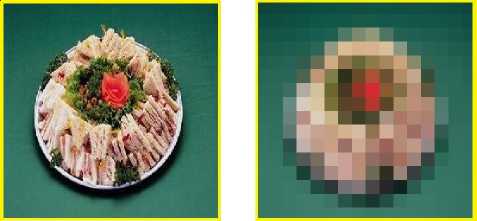
With the great development of information’s and multimedia, digital image databases are becoming wider. The image is now used by professionals as by the huge audience that has very powerful sensors and at prices within the reach of everyone. To improve the interaction of users with these databases, it is essential to develop effective and appropriate research methods. For this, the image search using visual content (CBIR), known a ramp-up in recent years. Two main tasks are outlined to develop a CBIR system. The first is the extraction of image characteristics. It consists in generating a set of characteristics in the form of signatures can well describe the images of the database. The second task is the similarity measure, which consists in calculating a distance between a query image and all images in the database, which will be ordered according to their similarity with respect to this image. In the first task we focus on the color descriptor. One of the first approaches describing the color information has been to use the color histogram [1]. However, the use of histograms to represent the color distribution has some disadvantages. From the standpoint of storage space, the multidimensional histograms are hollow, i.e. the majority of cells have no pixels. Much of the memory space is used unnecessarily. In addition, all classes have the same size, so it would be more interesting to have smaller classes in areas containing highly frequent colors, and large classes for lesser Used colors. From the viewpoint of the similarity measures employed, traditional measures only perform bin to bin comparison. Even if the histograms are ordered, the vicinity of the cells is not taken into account when they have different values. Colors signatures proposed in [2], can improve some of the problems posed by the use of histograms. Unlike histograms, signatures only store the colors that belong to the image, they do not store the empty cells (examples shown in figure 1). To calculate the color signature of an image, at first each point of the RGB representation of the image is smoothed to reduce the risk of color quantization and dither artifacts. Then the image is transformed into S-CIELab. At this stage, each image may be designed as a distribution of points in CIELab, where a point corresponds to a pixel in the image. This distribution is merged into classes of similar colors. Due to the large number of images to be processed in the basic applications of typical data, consolidation should be done efficiently. To this end, the grouping is done by using the kd-tree structure [3]. The signature S of an image is a set of point clouds s= (m,w). each cloud is represented by his mid mode (the mode of a point cloud corresponding to a local maximum of the probability density), and w number of pixels that belong to the cloud.
(a)
(b)
Fig.1. Example of color signatures. (a) original image, (b) signature color.
In this case, the image signatures obtained (presented in [4]) can be of different sizes, and do not retain the same sequence of colors. For this, metrics of type "component to component", not is applied. Distances cross-are the only components that can be applied on such signatures, the metric of Earth Mover's (EMD) [4] quoted the best metric of this type of distance it has been applied successfully with this signature type , and offered better comparison quality , the details of this metric are presented in the next section.
In this paper we present a method that take into account the spatial information’s for a color descriptor and make him partially invariant under rotation.
The rest of the paper is organised as follow. Section 2 present the EMD distance. Section 3 Describe the joint distribution of color and position. Section 3 Present our contribution. Section 4 evaluates the result search quality of our proposed approach experimentally. Finally, Section 5 concludes the paper.
-
II. The Earth Mover Distance (EMD)
Initially the EMD was introduced in computer vision by Werman et al. [5] but it is through the work of Rubner et al. [4] that this metric become popular. The EMD similarity distance is calculated as the sum of the changes needed to transform the characteristics of a distribution in another. Rubner et al. [4] proposed a model of CBIR by the use of EMD. They demonstrated his high quality for similar images search. The EMD is defined as optimal transport problem that can be solved using linear programming techniques. Rubner et al. [4] have called this remote earth mover's distance (EMD). They demonstrated that this distance is equivalent to the Mallows distance between two probabilistic distributions. In its general form, the EMD distance is seen as the minimum work required to associate a set of weighted descriptors P = {(p., w ),i = 1, ..., n} to another set of the same type. The work is calculated on the basis of a ground distance.
Mathematically, the EMD between two signatures P = {( P , , w , ) ,( P 2 , W 2 ), ..., (P n , w n )} and
Q = {( q , , u , ),( q 2 , u 2 ), ..., ( q „ , u m )}
Having the same total weight T w = T u is defined i = 1 j = 1
by:
EMD ( P , Q ) =
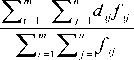
Where F={fij} denotes a set of flows. Each flow fij represents the amount transported from the i-th supply to the jth demand.
D=[di j ] the ground distance matrix, where di j is the ground distance between clusters p i and q j with the following constraints:
T .ire phonetiquement
Dictionnaue - Afficherle dictionnaiie-
Traduction dans plus de 50langues e -» nazdar!
-
• -, Langweilig
-
• -» Ichbinvierzig Jahrs alt
-
• -» .5.^..'?..^..^
e » Trapq/.ia
-
• -» Wie heiCen-Sie?
-
• -» deti
p 'аЛ А^С. . _^ i < e
# -» su to ПЗТ «- # e -» Vaer sasniB
-
• -» haydigdelim
-
• -♦ Простите
e -» mijn vriend
-
• -* Э1Г5Г ЛчГо1”-'Н1гиТ
e -» Buona omo Pnncipessa!
-
• -» mint
-
• -» ZP.T1WPS
e -» hojeestaensolara do
* "* SrSiC
. - ^.
-
• -» miracoloso
e -» hello f> 0,1 < i < n ,1 < j < m

< w , ,1 < i < n
n
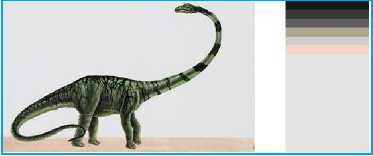
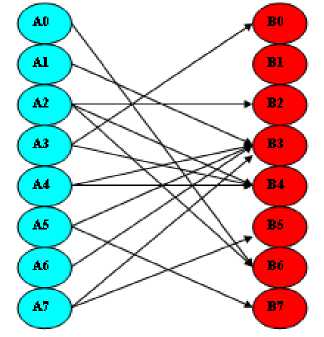
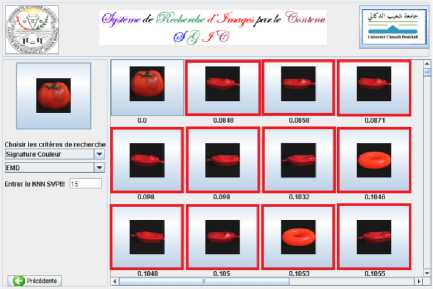
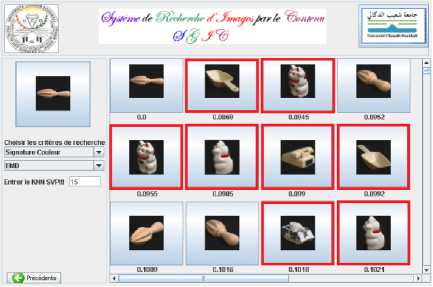
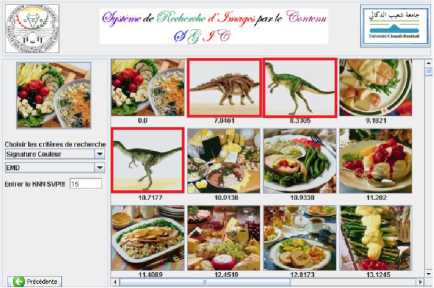
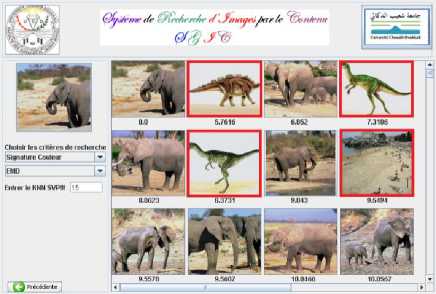
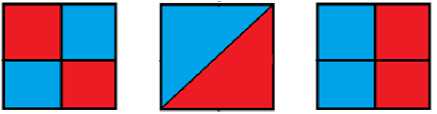
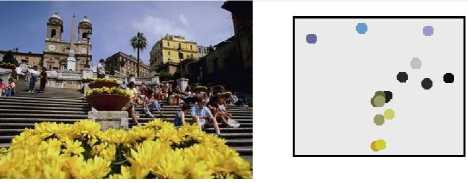
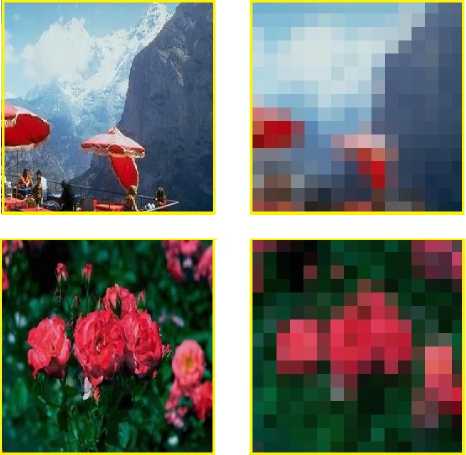
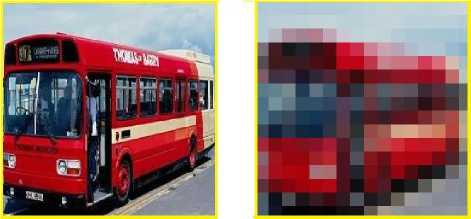
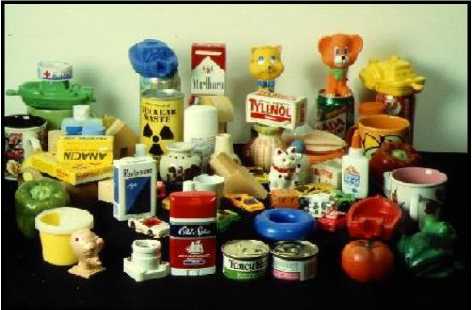
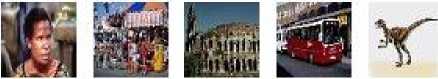
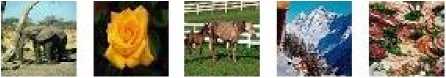
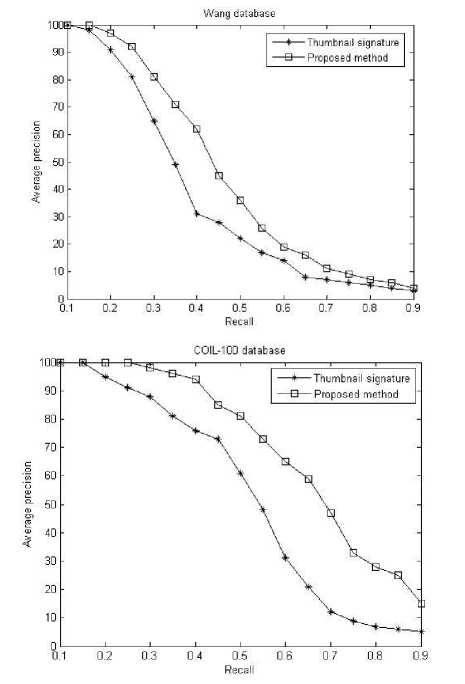
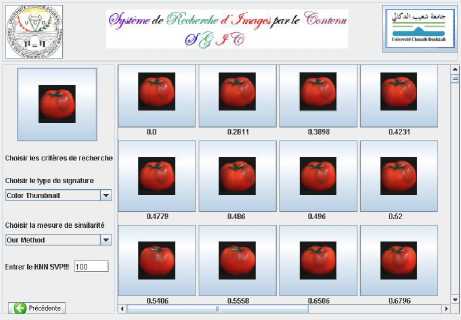
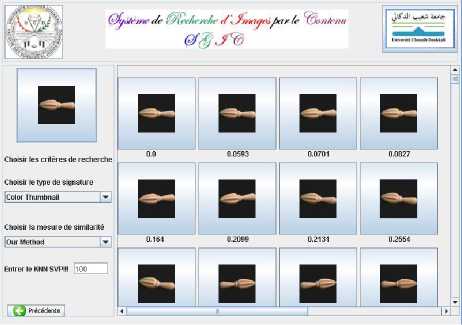
Tfij nm n m T Tfij = min(Zw i, Tu j) i =1 j = 1 i =1 j =1 Following the illustration of ground displacement, the second and third constraint requires that the entire earth is moved and all the holes are filled. In figure 4, we present an illustration of this distance. Let A and B be two color signatures of two images that are shown in figures 2 and 3 respectively. A signature represents supplies and B signature represents requests. Tables 1 and 2 shows respectively the numerical values of the signatures A and B. These two signatures are of dimensions eight, where each dimension is characterized by three attributes (L, a, b) representing the color. In addition, for each dimension is assigned a weight that is the number of color pixels. We assume that the ground distance is the Euclidean distance. Transportation costs between these two signatures are calculated as shown in Table 3. By solving the transport problem in the above conditions, we can get the optimized traffic flows, as shown in figure 4. EMD result between these two signatures is 34.43. Fig.2. Image A and their signature. Table 1. Numerical Values of signature A. L a b weight A0 56.9 -4.48 -37.9 12280 A1 49.33 -4.56 9.74 12283 A2 50.33 4.43 -46.7 12285 A3 47.82 2.34 -32.5 12304 A4 66.9 -14.8 -30.5 12283 A5 72.94 -16.4 -21.3 12290 A6 66.23 -7.77 -17.2 12289 A7 66.62 -0.29 31.25 12290 Table 2. Numerical Values of signature B. L a b weight B0 17.9 -2.96 -6.97 12287 B1 32.35 -4.89 20.41 12288 B2 20.6 2.5 -19.4 12106 B3 22.75 6.76 17.91 12470 B4 68.89 -6.97 0.16 12288 B5 69.6 -8.17 46.25 12288 B6 57.75 -0.19 -31.5 12288 Fig. 3. Image B and her signature. In this example, the colors of these two images are not the same. So it is clearly noticeable that the distances bin-to-bin can’t be applied. EMD metric solves these problems, and it is successfully applied for image retrieval systems by content. Table 3. Cost matrix between A and B signature. B0 B1 B2 B3 B4 B5 B6 B7 A0 49.78 63.24 41.32 66.36 39.96 85.15 7.72 81.43 A1 35.63 20.05 41.53 30.02 21.9 41.9 42.33 36.62 A2 51.85 70.15 40.44 70.33 51.72 95.8 17.57 90.87 A3 39.7 55.61 30.22 56.49 39.98 82.39 10.29 77.22 A4 55.65 62.36 50.68 69.02 31.76 77.13 17.3 75.44 A5 58.45 59.35 55.69 67.8 23.83 68.15 24.46 67.45 A6 49.63 50.7 46.82 57.74 17.58 63.53 18.28 61.02 A7 61.98 36.23 68.49 46.39 31.87 17.2 63.38 12.39 Fig.4. Network flows between signatures A and B. Examples of image search of our framework using color signatures and EMD metric are shown in figure 5. Fig.5. Display results in our engine. Noting that the images framed by red frames are not considered similar to the query image. Values below of result images represent their distances to the query image. From the examples shown in figure 5, one can conclude that the color information is not usually enough to research semantics images. As the images can not be well described in terms of color, there is a semantic difference between the query and the returned images, and consequently the application is bound to fail. The colors only do not allow to infer the semantic content. Therefore, this approach can create many false positives. It is therefore historically appeared necessary to introduce other image characteristics such as color space information, indices of shapes, textures etc. The literature in this area is extremely high and continues to grow. III. Joint Distribution Of Color And Position In many cases, the global color distribution excludes the positions of the color’s in the image. In our work we are only interested of methods taking account the overall spatial arrangement of colors. To characterize the composition of image it is actually important to consider this organization (figure 6). Fig.6. Spatial distribution of color. color Distributions of these images are identical. But their space organizations are very different. The methods proposed in the context of this problematic can be organized into two groups. Methods using a uniform quantization of the color space and the space of the image can be placed in the category of approaches histograms color-space. The second category of methods based on image segmentation methods. For a state of recent art, we can refer to [6]. We cite some commercial systems integrating local spatial information QBIC (IBM) [7] Watson [8] (IBM), TURN [9] AMORE (NEC) [10] WALRUS (Bell) [11] , IKONA (INRIA) [12]. In the academic field we cite Photobook (MIT) [13] BlobWorld (Berkeley) [14] VisualSEEK et WebSEEK (Columbia) [15], WBIIS (Stanford) [16] and [17]. One feature of using the histogram as a signature is the fact that the image remains invariant by translation or rotation. This great advantage is obtained compared to other approaches to the detriment of spatial information that not considered by the histogram. To reduce the effects of this major drawback, several studies endeavor to calculate the proportions of colors and their relative positions. There are also other methods which consist in dividing the image into sub-images for example in 9 equal rectangles [18] in 25 equal rectangles [19]. After decomposition, the system associates for each subimage its corresponding color histogram. With this technique, the size of vector indices will be multiplied by the number of rectangles, which increases the size of signatures (storage space) in the indexed base and therefore lengthens the computing time. Another disadvantage generated by these methods relates to the loss of invariance of the image. In this context, Rubner and Tomasi [2] proposed color signatures that include both the distribution of colors and their positions in the image (see Figure 7). However, the fact of adding spatial information to color components poses two major problems: the first is the weight (importance) to associate for colors and positions. The second disadvantage to the signature, it's not invariant to rotations. Our contribution improves this second drawback. Details of our contribution are presented in the next section. (a) (b) Fig.7. An example of color signature (distribution joint color and position). (a) Original image. (b) Color signature. IV. Our Contribution In context to associate spatial positions of the colors signatures, Hurtut T. et al. [20] have proposed color thumbnail which also includes the colors and their positions in the image in order to improve more the image description. In this paper we consider this descriptor as a basic element of our contribution. A. Thumbnails Calculation The thumbnails calculation is performed as follows: when it is possible to do this, we fix first the RGB channels of the gamma factor to obtain tristimulus values. According to the laws additive of Grassman [21], tristimulus values can then be averaged to get the thumbnails. These thumbnails are converted towards the CIE Lab psychometric space. Overall description of an image is therefore made up of n pixels f = {L., a., b., X., Y.} of his thumbnail where L, a, b are the coordinates in CIE-Lab, and X, Y position of the pixel in the thumbnail. Each of these pixels is weighted by a weight 1 / n. Formally, the overall description of an image is expressed by F = {(f, 1 / n) i = 1, ..., n} where n is the size of the thumbnail and each f is a 5dimensional vector containing the color and his position in the thumbnail. A weight 1 / n is assigned to each descriptor, because each pixel covers the same area in the image. In this particular case all descriptors have the same weight, the transport problem is simplified into a problem said assignment [22] where the descriptors can’t be divided during transport. Some examples of thumbnails are shown in Figure 8. Fig.8. Three-color thumbnail. (a) original image (256x256 pixels). (b): Classic thumbnail (16 × 16 pixels), each pixel has the average color calculated on the underlying region in the original image. T.Hurtut et al [20] have assigned a weight to the color and to the position. The value of this weight represents an unsolved problem for him. T.Hurtut et al [20] used EMD distance for the distance calculation of similarity between two thumbnails taking into account the positions of the colors. However, the weight associated to the colors and their positions are defined experimentally. In this paper, we use the definition 1 which represents the basic distance between two thumbnails. Definition 1. Basic distance Given two signatures p = {(p., 1 / n) i = 1, ..., n and Q = {(qi, 1 / n) i = 1, ..., n} Dist(P,Q) = £ 7(Pi (l) -qi (l ))2+ (Pi (a) -q, (a))2 + (p, (b ) -q, (b ))2 i =1 Wherep(l), p(a) and p(b) represent the values (L, a, b) of the ith color of the signature P. In this case, each pixel of a query image is fully assigned to pixels of the same position to other images. In general it is not easy to choose a weight value to meet the needs an intuitive comparison of the spatial colors organization. The mix between space and color is not natural, and the choice of weights = 0.5 for the colors and positions is not great a significance according the spatial organization of colors. In the next section we propose a technique that allows us to match two images taking into account their spatial organizations and make a signature partially invariant under rotation. B. Thumbnails Matching In order to resolve the rotation invariant problem to some extent, we propose to implement the technique introduced in [25] to have a signature that contains both the color and its spatial information’s and well be invariant to rotations. We adopt the circular shift (clockwise or anti-clockwise direction) and mirror (horizontal direction and vertical direction respectively) matching scheme to measure the distance between thumbnails. Then we choose the minimum one among the three as the final thumbnail distance. The distance between thumbnails can be formalized as follows: Sim(P,Q)=min(SimR(P,Q),SimH(P,Q),SimV(P,Q)) (4) Where, • SimR(P,Q) denotes the minimum value among the circular shift matching (12 times), • SimH(P,Q) denotes the minimum value of the horizontal mirror matching and • SimV(P,Q) denotes the minimum value of the vertical mirror matching respectively. The algorithm for measuring the similarity between thumbnails can be summarized as follows: Algorithm1. Similarity measure between the thumbnails Step 1: Input two thumbnails: we denote thum1 as the features of query image P and thum2 as the features of image Q Step 2: Calculate SimR ( P,Q ) For i = 1 To 12 1) Calculate the distance between thum1 and thum2 using Definition 1, and the distance stored in dist(i) 3) Shift the thum1 one bin on clockwise or anticlockwise direction and keep the Thum2 unchanged End Step 3: Get SimR(P,Q)= min i=1..12[ (dist(i) )] Step 4: Calculate SimH ( P, Q) 1) Mirror the original thum1 on horizontal direction and keep the thum2 unchanged 2) Calculate the distance between thum1 and thum2 using definition 1, and the distance stored in SimH(P,Q). Step 5: Calculate SimV(P,Q) 1) Mirror the original thum1 on vertical direction and keep the thum2 unchanged 2) Calculate the distance between thum1 and thum2 using Definition 1, and the distance stored SimV(P,Q) Step 6: Get Dist(P,Q)=min(SimR(P,Q), SimH(P,Q), SimV(P,Q)) Step 7: Output Dist(P,Q) (the final similarity between thum1 and thum2) V. Experimentations A. Images Database To assess and validate the different approaches studied and developed in this work, two bases of heterogeneous images are used, ie, the base COLOMBIA, and WANG base. These databases form well defined concepts, which each image can only belong to one class. In what follows, the description of the two bases of images used is provided. • COLOMBIA database COLOMBIA database contains images of 3D objects from different positions taken. In this paper, the collection used of this database is COIL-100 1 [23]. It consists of 100 classes of 72 image of each one, and each class is made up of an object which is applied successive rotations of 5 degrees. This database is a good example to test the invariance to rotations as in the case of our approach. An example of this database is shown in figure 9. The base COIL-100 (Colombia Object Image Library) is available online at the following address: http :// Fig.9. Samples of the 100 objects in the image database COIL-100 COLOMBIA. Using a motorized table (turntable) and a black background, each object is captured in different positions to form a class basis. The plate is turned 360 ° to change the position of the object relative to a fixed color camera. An image of the object is taken at each interval of 5 °. This corresponds to 72 different positions for each object. COIL-100 contains donc7200 size images 128 × 128 pixels. • WANG database The image database Wang [24] is a subset of the Corel database. This image database contains 1000 natural color images. These images were divided into 10 classes, each class contains 100 images. The advantage of this database is to evaluate the results. This image database has been used for classification experiments. An example of each class can be seen in Figure II.2. This images database was created by the group of Professor Wang from the Pennsylvania State University 7. Each image in this images database has a size of 384 × 256 pixels or 256 × 384 pixels. Fig.10. Examples extracted from the Wang collection. B. Data Description We tested our method on two bases mentioned above. The description of the images is carried out in two phases: in the first phase we resize the database images for will be the same size. In the second phase we create for each image of the database his corresponding thumbnail of size 256. C. Study of the Result Pertinences The purpose of this experiment is to show the effectiveness of our method taking account the spatial distribution of colors and invariance to rotation. This is to evaluate and compare the accuracy of the results obtained through relevance feedback. Fig.11. Average retrieval precision-recall curve for image retrieval with color signature and our method in the COIL-100 and Wand databases. In this experience we compare our method with the one proposed by T. Hurtut et al.[20]. In the research process, we set a query image, by comparing their thumbnails with other thumbnails images of the database, using the EMD metric (T. Hurtut approach) and our method. We have obtained a set of images sorted by order of similarity to the query image. Figure 11 present the average accuracy of performed experiments. These figures show that our method is more efficient. In figure 12, we showed retrieval examples over a two databases of images, using query-by-example in our implemented system. We take the same examples as presented in the figure 5 to show that our method presents the best performance for image retrieval. Finally, the curve and the examples presented in Figures 11 and 12 shows clearly the contribution of spatial information and the invariant under rotation of our method on the quality of image retrieval. VI. Conclusion In this paper we presented methods for the representation of distributions of image colors, with thumbnails being the best method for image retrieval. We have presented a new similarity method for image matching and retrieval. The proposed method take into account the spatial information’s for color signature, and make him partially invariant to rotation. This invariance obtained through circular shift and mirror matching scheme. We conducted several experiments on Coil100 and Wang databases. The results of experiments show that the proposed method is effective for color signature matching and retrieval. Although the performance of our approach is not the best one, it might be one of the most feasible approaches in practical applications.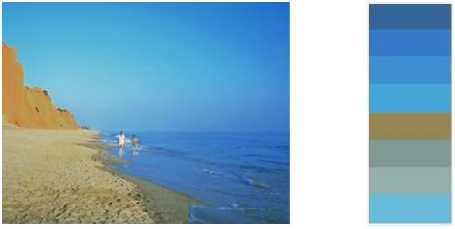
References A Content based Image Retrieval Framework Using Color Descriptor
- M.sWain, D.H.Ballard. Color indexing. International of computer vision, 32(11): 11-32. 1991.
- Y. Rubner and C. Tomasi. Perceptual metrics for image database navigation. PhD thesis,Stanford University, 2001.
- J.L. Bently. Multidimensional binary search tree used for associative searching. M. Communications of ACM, pages 509–517, 1975.
- Y. Rubner, C. Tomasi, and L.J. Guibas. The earth mover's distance as a metric for image retrieval. Int. J. Comput. Vision, 40(2):99–121, November 2000.
- M. Werman, S. Peleg, and A. Rosenfeld. A distance metric for multidimensional histograms. Computer Vision, Graphics and Image Processing, pages 328–336, 1985.
- R. Schettini, G. Ciocca, and S. Zuffi. A survey on methods for colour image indexing and retrieval in image databases. Color Imaging Science: Exploiting Digital Media, pages 183–211, 2001.
- M. Flickner, H. Niblack, W. Ashley, J. Dom, B. Gorkani, M. Hafner, D. Lee, J.and Petkovic, D. Steele, D. Yanker, and al. Query by image and video content: the qbic system. Computer, pages 23–32, 1995.
- J.R. Smith and C.S. Li. Image classification and querying using composite region templates. Computer Vision and Image Understanding, pages 165–174, 1999.
- J. Bach, C. Fuller, A. Gupta, A. Hampapur, B. Horowitz, R. Humphrey, R. Jain, and C. Shu. Virage image search engine: an open framework for image management. Proceedings of SPIE, 1996.
- S. Mukherjea, K. Hirata, and Y. Hara. Amore: A world wide web image retrieval engine. World Wide Web, pages 115–132, 1999.
- A. Natsev, R. Rastogi, and K. Shim. Walrus: a similarity retrieval algorithm for image databases. Knowledge and Data Engineering,IEEE Transactions, pages 301–316, 2004.
- N. Boujemaa, J. Fauqueur, M. Ferecatu, F. Fleuret, V. Gouet, B. Saux, and H. Sahbi. Ikona : Interactive generic and specific image retrieval. Proceedings of the International workshop on Multimedia Content-Based Indexing and Retrieval (MMCBIR.2001), pages 25–28, 2001.
- A. Pentland, R. Picard, and S. Sclaroff. Photobook : tools for content-based manipulation of image databases. Proceedings of SPIE, 2003.
- C. Carson, S. Belongie, H. Greenspan, and J. MalikBlobworld. Image segmentation using expectation maximization and its application to image querying. IEEE Transaction on Pattern Analysis and Machine Intelligence, pages 1026–1038, 2002.
- J. Smith and S. Chang. Visualseek : a fully automated content-based image query system. Proceedings of the fourth ACM international conference on Multimedia, pages 87–98,1997.
- J. Wang, G. Wiederhold, O. Firschein, and S.X. Wei. Content-based image indexing and searching using daubechies' wavelets. International Journal on Digital Libraries, pages 311–328, 1998.
- Y. Chen, M. Tsai, C. Cheng, P. Chan, and Y. Zhong. Perimeter intercepted length and color t-value as features for nature-image retrieval. Lecture Notes In Computer Science, 2007.
- Y. Gong. Image indexing and retrieval using color histogram. Multimedia Tools and Applications, Vol 2 :133–156, 1996.
- Y. HumWoo, J. DongSik, J. SehHwan, Park Jinhyung, and S. KwangSeop. Visual information retrieval via content-based approach. Pattern Recoggnition, pages 749–769, 2002.
- T. Hurtut, Y. Gousseau, and F. Schmitt. Adaptive image retrieval based on the spatial organization of colors. Computer Vision and Image Understanding, 112(2) :101–113, 2008.
- G. Wyszecki and W. Stiles. Color science: Concepts and methods, quantitative data and formulae. In 2nd Edition, 2000.
- Ford, L. R. and Fulkerson, D. R. (1956). Solving the transportation problem. Management Science, 3 :24-32.
- S.A. Nene, S.K. Nayar, and H. Murase. Columbia object image library (coil-100). Technical Report CUCS, 1996.
- Wang J.Z., Li J. and Wiederhold G. (2001) IEEE Transactions on Pattern Analysis and Machine Intelligence, 23(9), 947-963.
- Xin Shu, Xiao-JunWu, A novel contour descriptor for 2D shape matching and its application to image retrieval, doi: 10.1016/j.imavis.2010.11.001, Image Video Computing , 2011.
