A Dynamic Object Identification Protocol for Intelligent Robotic Systems

Author: Akash Agrawal, Palak Brijpuria
Journal: International Journal of Image, Graphics and Signal Processing(IJIGSP) @ijigsp
Article in issue: 8 vol.7, 2015.
Free access
Robotics has enabled the lessening of human intervention in most of the mission critical applications. For this to happen, the foremost requirement is the identification of objects and their classification. This study aims at building a humanoid robot capable of identifying objects based on the characters on their labels. Traditionally this is facilitated by the analysis of correlation value. However, only relying on this parameter is highly error-prone. This study enhances the efficiency of object identification by using image segmentation and thresholding methods. We have introduced a pre-processing stage for images while subjecting them to correlation coefficient test. It was found that the proposed method gave better recognition rates when compared to the conventional way of testing an image for correlation with another. The obtained results were statistically analysed using the ANOVA test suite. The correlation values with respect to the characters where then fed to the robot to uniquely identify a given image, pick the object using its arm and then place the object in the appropriate container.
Robotics, image segmentation, correlation coefficient, optical character recognition, object recognition
Short address: https://sciup.org/15013897
IDR: 15013897
Text of the scientific article A Dynamic Object Identification Protocol for Intelligent Robotic Systems
Published Online July 2015 in MECS DOI: 10.5815/ijigsp.2015.08.04
Currently human computer interaction has been researched to ease the process of human intervention in computing and various other day to day tasks though applications like natural language processing, braincomputer interface [1, 2], speech recognition, etc.
Another domain which also aims to achieve the same goal is robotics. Robotics has tremendous applications in present era. Currently robotic surgeries are found to be more accurate and precise in nature when compared to the traditional invasive surgeries [3].
Character recognition is an important aspect of pattern recognition which has wide spread use these days. The characters under consideration determine the complexity of the character recognition problem. The classification and identification of optical patterns in a digital image is termed as optical character recognition (OCR). The characters are basically alphanumeric or any other characters in a given language. The technique comprises of phases like segmentation, feature extraction and classification. It finds tremendous applications in an assortment of applications like document or signature verification in original papers, data source, invoices, passport documents, receipts, bank statement, mail; text-to-speech translation, etc.
An important step in character recognition from images is image segmentation. It deals with partitioning a given image into multiple segments. It is used to modify or simplify the representation of images that renders effective analysis at decreased intricacy. In [4], a method to detect the vehicle’s number plate at night is developed using Iterative Threshold Segmentation algorithm. A well-known technique used for image thresholding is the Otsu’s method [5]. In our implementation, we have introduced a preprocessing stage for images of characters before subjecting them to correlation coefficient test with the aid of image thresholding and segmentation. We then assess the correlation coefficient in two ways-by preprocessing them using our method and without any preprocessing.
The rest of the paper is organized as follows. Section II deals with the related work pertaining to the study. The implementation of the overall system is discussed in Section III. The results obtained are given in Section IV which are statistically analysed. The paper concludes in Section V.
-
II. Related Work
OCR technology has been deployed to process historical documents [6]. OCR is used especially in domains like computer vision, artificial intelligence and pattern recognition. Many classifiers have been studied exclusively to recognize handwritten characters [7]. Artificial neural networks have been considered to be a powerful classifier due to their high computation rate achieved by massive parallelism [8, 9]. Hindi characters have been recognized as in [10].
-
A. Correlation Coefficient
Correlation Coefficient is a method of assessing the amount of linear relationship that exists between two quantities under test, designed by Karl Pearson in 1895. The Pearson’s correlation coefficient is given by [11]:
r
1 i (^ j ^ m ) (У j Ут)
VI ^1 - XmY-j (У i - Ут)2
where x m and y m represents the mean of intensity values of the 1st and 2nd image respectively; x i and y i corresponds to the values of the intensities of the ith pixel in 1st and 2nd images respectively. If the two images are absolutely identical, then the value of the correlation coefficient is 1, the value of r = -1, the two images are said to be anti-correlated. A value of zero indicates that the two images are absolutely uncorrelated [12]. In [13], the impact of correlation coefficient is studied with respect to face recognition.
The correlation coefficient is vulnerable to the pincushioning, image skewing, and vignetting that is inevitable in imaging systems [14]. Pincushioning means that the edges of the image are concave. Image skewing occurs when an image slants in one direction. Vignetting is a reduction in the image intensity near the edges due to optical light collecting considerations. Such distortions are particularly prevalent in scanning electron microscope pictures [15] due to the complexities and non-linearities of electron optics. In practice, minor deviations in the object’s position relative to the camera, distortions in the pixel noise, imaging system; and other factors produce an r value less than 1, even if the object has not been moved or physically altered in any manner [15].
The aim of our implementation is to do away with the shortcomings associated with correlation coefficient like distortions in the imaging system and slight, pixel noise, deviations in the positioning of the object with respect to the camera. Hence we introduce steps wherein the image is prepared to undergo the correlation coefficient test and bestow proper results even in unconstrained environments. This technique of assessing the correlation was also compared with the conventional means of obtaining correlation coefficient, wherein the images are compared with proper preprocessing.
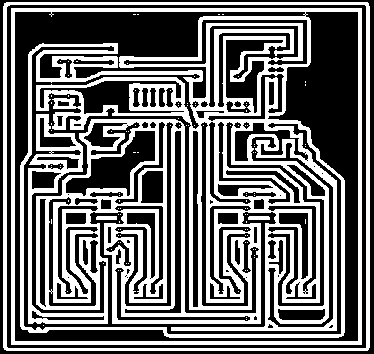
Fig. 1 PCB design
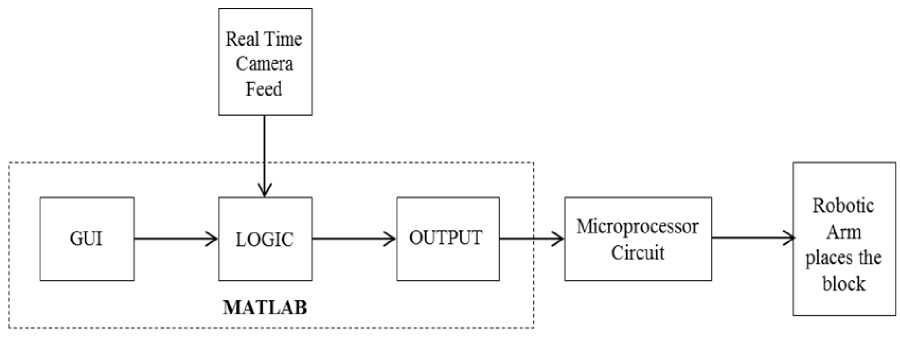
Fig. 2 Entire system design schema
-
III. Implementation
-
A. Hardware and Software requirements
The IC chips used for the implementation consisted of Atmega-8L, Voltage controller 7805, L293D, HT12D and HT12E. The motors used for the locomotion of the robot composed of geared DC motor-5-10 rpm and DC motor of 30 rpm. The camera used for image acquisition was Samsung Galaxy S3 smart phone front camera of 1.9 mega pixels. The power supply was rendered using 9V battery and SMPS based adapter of output specifications-9V, 2A. Other components like resistors of 1-10k, IN 4007 p-n junction diode, 1-10 micro farad capacitors and
LEDs were used. The schematic representation of the PCB design is as shown in Fig. 1, developed using PBC Wizard Professional edition [16].
Fig. 2 shows the schematic representation of the overall system design. Camera is connected to the computer system. This connection can be rendered in a wireless mode or by using a wired cable. In our implementation, we have connected a phone camera with the computer system using Bluetooth. After successful initialization of the camera, the image acquisition phase starts. These images are recognized using the proposed method and the signal is transmitted using RF transmitter receiver to the microcontroller (ATMEGA 8L) in a wireless mode. Accordingly, the microcontroller gives the output to L293D which in turn drives the motor. Motor drives the arm and place the block in their respective position. A success message is displayed for correct object placement in the right container. Fig. 3 shows the setup of the robotic system.
-
B. Methodology
The core of the working of the robot was the recognition of characters labelled on the objects. The pseudo code of the technique deployed is as follows:
-
1. Image acquisition from real time feed.
-
2. Image thresholding using Otsu's method.
-
3. Recognizing the number of characters in the
-
4. De-noising the image by eliminating the
-
5. Segmentation of the image and extraction of characters.
-
6. Assessment of correlation coefficient of the image with the images in the database.
image.
unwanted pixel areas.
For( number of images in the database)
{
Correlation_coefficient(processed image, database image)
If maximum (Correlation_coefficient)
{
Character match Return this image }
}
-
C. Image analysis
This section explains the analysis of the image acquired via camera. The image consisted of English alphabets and numbers in 5 different font styles in the following order:
-
2) Times New Roman
-
3) Calibri
-
4) Book Antiqua
-
5) Bookman Old Style
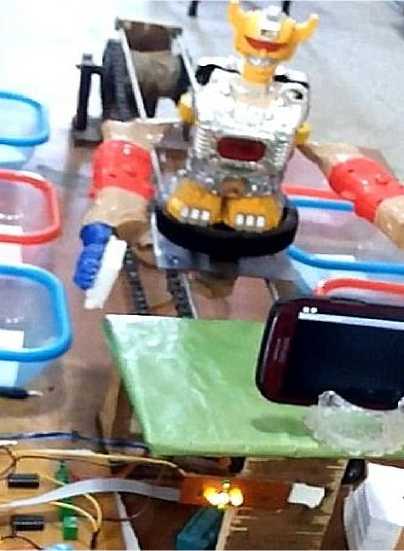
Fig. 3. Snapshot of the robotic set up.
Fig. 4 shows the image of letter “A” taken in the above 5 font styles (with white background) for analysis. To further test the accuracy of our method, we acquired the image of a character with 3 different light intensities (see Fig. 5). The naming convention followed for each image in this case is- S_FontStyleNumber_ImageNumber. The letter “S” in the naming convention denotes ‘shades’ so as to distinguish these datasets from the ones in Fig.4.
1) Arial Black
A A A A A
Al (Arial 42 (Times New дз (Calibri) 44 (Book 4ntiqua) A5 (Bookman OldBlack) Roman) Style)
Fig. 4. Character “A” in 5 different font styles (with white background).
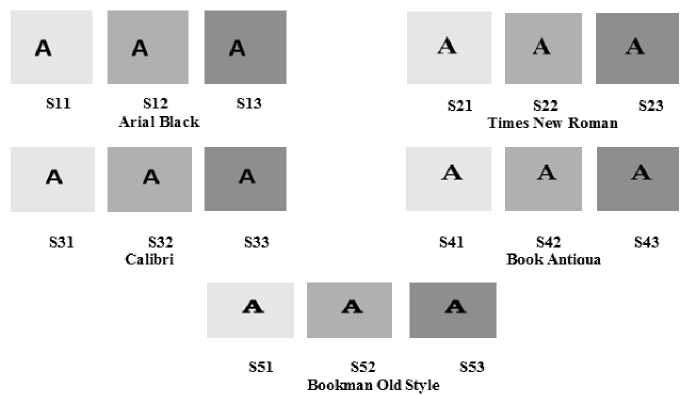
Fig. 5. Image of character “A” taken for different font styles and with varying light intensities.
-
IV. Results And Discussions
-
A. Case 1: Analysis of images with five different font styles
Fig. 6 shows the results obtained for images of five different font styles. X axis depicts the five font styles with notations A1 through A5. The ordering of these font styles is the same as mentioned in Section III.C. The correlation coefficient values obtained are plotted along Y axis. Along the X-axis, each font style is compared with the rest of the five font styles for their respective correlation coefficient values and the same are plotted. This is calculated using two methods-traditional and the proposed method. The blue bars represent the conventional method of comparison while the red bars indicate the results obtained using the proposed scheme. The red bars are comparatively higher than the blue bars which is indicative of the fact that the proposed method outperformed the conventional method of comparison of images of characters.
Single factor ANOVA for case 1
The results shown in Fig.6 are tested statistically using single factor ANOVA suite with the following hypothesis:
H 0 : All the images (with different font styles) return same results.
H 1 : All the images (with different font styles) do not return same results.
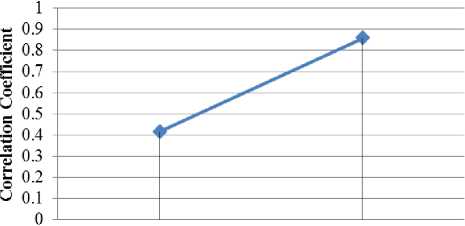
Table 1 shows the summary of statistical results. Since the p-value returned by ANOVA test (Table 2) is less than 0.05, we reject the null hypothesis. Hence, the means of the correlation coefficients aren’t equal. Hence, one of the populations of means is different from the other population of mean. Fig. 7 shows the mean of values obtained using the conventional and the developed method. Here X axis denotes the methods used while the corresponding correlation coefficient obtained are plotted along Y axis. It can be noted from the figure that the mean is higher for the developed method and the same is proved using the ANOVA test.
-
B. Case2: Analysis of images with five different font styles having 3 different shades
Fig. 7 shows the results obtained for images with five different font styles having 3 different shades (see Fig. 5). The ordering of these font styles is the same as mentioned in Section III.C. The notations Sij along the X-axis denotes images with i (i=1,2,3,4,5) different font styles and j (j=1,2,3) different shades. The notation Ai (i=1,2,3,4,5) are indicative of five different font styles for the character ‘A’. Y axis represents the correlation coefficient values obtained using the conventional (blue line) and the proposed method (red line). It can be inferred from the figure that the proposed method was better than the conventional one.
Single factor ANOVA for case 2
The results shown in Fig.8 are tested statistically using single factor ANOVA suite with the following hypothesis:
H 0 : All the images (with different font styles and shades) return same results.
H 1 : All the images (with different font styles and shades) do not return same results.
Table 3 gives the summary of statistical results for case 2. Since the p-value returned by ANOVA test (Table 3) is less than 0.05, we reject the null hypothesis. Hence, the means of the correlation coefficients aren’t equal. Hence, one of the populations of means is different from the other population of mean. Fig. 9 shows the mean of values obtained using the conventional and the developed method. Here, X axis is indicative of the methods used and Y axis corresponds to the correlation coefficient values obtained. It can be noted from the figure that the mean is higher for the developed method and the same is proved using the ANOVA test.
Table 1. Summary of statistical tests
|
Groups |
Count |
Sum |
Average |
Variance |
|
CC_Normal |
25 |
10.3958 |
0.415832 |
0.12114822 |
|
CC_Developed_method |
25 |
21.4784 |
0.859136 |
0.00894337 |
Table 2. Summary of ANOVA results
|
Source of Variation |
SS |
df |
MS |
F |
P-value |
F crit |
|
Between Groups |
2.45648046 |
1 |
2.45648046 |
37.7653992 |
1.50324E-07 |
4.04265213 |
|
Within Groups |
3.12219821 |
48 |
0.0650458 |
|||
|
Total |
5.57867867 |
49 |
Table 3 Summary of statistical tests
|
Groups |
Count |
Sum |
Average |
Variance |
|
CC_Normal |
75 |
31.1547 |
0.415396 |
0.1175459 |
|
CC using developed method |
75 |
64.3365 |
0.85782 |
0.00823056 |
Table 4 Summary of ANOVA results
|
Source of Variation |
SS |
df |
MS |
F |
P-value |
F crit |
|
Between Groups |
7.340212 |
1 |
7.340212 |
116.7184 |
2.01208E-20 |
3.90506 |
|
Within Groups |
9.307458 |
148 |
0.062888 |
|||
|
Total |
16.64767 |
149 |
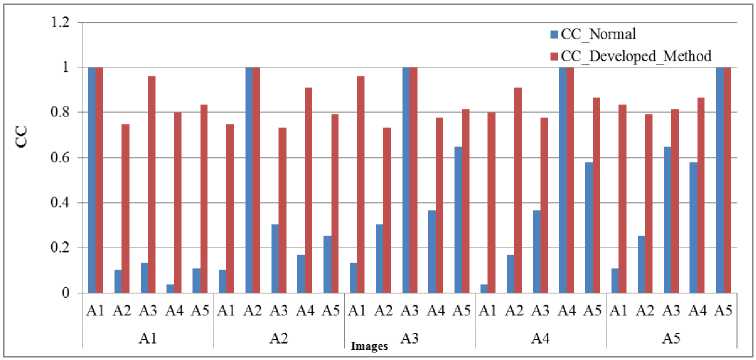
Fig. 6. Results for images with characters of different font style
CCNormal CCDevelopedmethod
Methods used
Fig. 7. Mean of correlation coefficient values for the conventional and the developed method (Case 1)
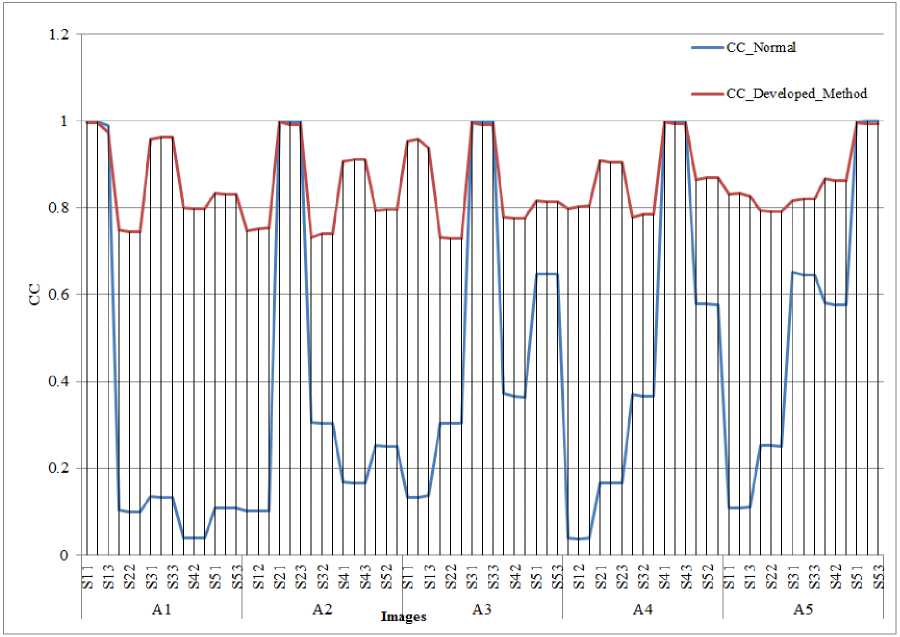
Fig. 8. Results for images for different font style and different light intensities
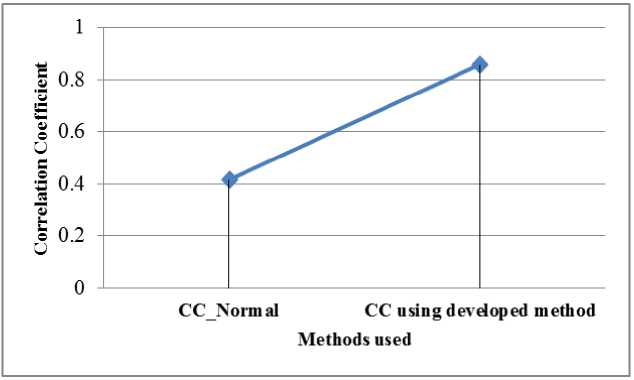
Fig. 9. Mean of correlation coefficient values for the conventional and the developed method(Case 2).
-
V. Conclusion
An intelligent robot was developed which could segregate objects based on the label that the objects contained. A technique was developed for optical character recognition for identifying the characters on the label of the object and segregate accordingly. The OCR method composed of image thresholding, character recognition, image de-noising, image segmentation and correlation coefficient. This method of obtaining the correlation coefficient was later compared against conventional way of assessing the correlation coefficient.
It was found that the proposed method of obtaining the correlation coefficient on images of characters was better than the conventional way. The proposed scheme of character recognizing robot can be extended in object recognition and can be deployed in fields like automated library, industries, space missions, etc.
The authors are immensely grateful to the valuable guidance provided by Dr. Abhishek Rawat, Assistant Professor, IITRAM, Ahmedabad, Gujarat, India .
-
[4] Akther, Maria, Md Kaiser Ahmed, and Md Zahid Hasan. "Detection of Vehicle’s Number Plate at Nighttime using Iterative Threshold Segmentation (ITS)
-
[12] Yen, Eugene K., and Roger G. Johnston. "The ineffectiveness of the correlation coefficient for image comparisons." Vulnerability Assessment Team, Los Alamos National Laboratory, MS J 565 (1996).
-
[13] Sheela Shankar, V. R. Udupi, “Assessment of the efficiency of correlation coefficient for face authentication”, Vol. No.3, Issue No.8, August 2014,IJARSE, ISSN-2319-8354(E)
-
[14] Yen, Eugene K., and Roger G. Johnston. "The ineffectiveness of the correlation coefficient for image comparisons." Vulnerability Assessment Team, Los Alamos National Laboratory, MS J 565 (1996).
-
[15] Palm, R. G., and A. De Volpi. Plastic-casting intrinsic-surface unique identifier (tag) . Argonne National Lab., IL (United States). Funding organisation: USDOE,
Washington, DC (United States), 1995.

Mr. Akash Agrawal is currently working as Assistant System Engineer in TCS Limited. His areas of interest include cognitive computing, embedded systems, image processing and robotics.
Ms. Palak Brijpuria is currently working as Assistant System Engineer in TCS Limited. Her areas of interest include image processing, software engineering and embedded systems.
References A Dynamic Object Identification Protocol for Intelligent Robotic Systems
- Geeta N, Rahul D. Gavas, "A dynamic attention assessment and enhancement tool using computer Graphics", Human-centric Computing and Information Sciences 2014 4:11. DOI:10.1186/s13673-014-0011-0
- Geeta N, Rahul D. Gavas, "Enhanced learning with Abacus and its analysis using BCI Technology", (IJMECS) International Journal of Modern Education and Computer Science, MECS journals, Hongkong. DOI: 10.5815/ijmecs.2014.09.04
- Di Gregorio, Marcelo, Andrei Botnaru, Laurent Bairy, and Francis Lorge. "Passing from open to robotic surgery for dismembered pyeloplasty: a single centre experience." SpringerPlus 3, no. 1 (2014): 580. doi:10.1186/2193-1801-3-580
- Akther, Maria, Md Kaiser Ahmed, and Md Zahid Hasan. "Detection of Vehicle's Number Plate at Nighttime using Iterative Threshold Segmentation (ITS) Algorithm." International Journal of Image, Graphics and Signal Processing (IJIGSP) 5.12 (2013): 62. DOI: 10.5815/ijigsp.2013.12.09
- Jianzhuang, Liu, Li Wenqing, and Tian Yupeng. "Automatic thresholding of gray-level pictures using two-dimension Otsu method." Circuits and Systems, 1991. Conference Proceedings, China., 1991 International Conference on. IEEE, 1991. DOI:10.1109/CICCAS.1991.184351
- Vamvakas, Georgios, Basilios Gatos, Nikolaos Stamatopoulos, and Stavros J. Perantonis. "A complete optical character recognition methodology for historical documents." In Document Analysis Systems, 2008. DAS'08. The Eighth IAPR International Workshop on, pp. 525-532. IEEE, 2008. DOI 10.1109/DAS.2008.73
- Liu, Cheng-Lin, Hiroshi Sako, and Hiromichi Fujisawa. "Performance evaluation of pattern classifiers for handwritten character recognition." International Journal on Document Analysis and Recognition 4, no. 3 (2002): 191-204, Springer. DOI: 10.1007/s100320200076
- A.K.Jain, Mohiuddin ―Artificial Neural Networks: A Tutorial‖, IEEE Computers, 29, 31-44, 1996. DOI:http://doi.ieeecomputersociety.org/10.1109/2.485891
- Due Trier, ?ivind, Anil K. Jain, and Torfinn Taxt. "Feature extraction methods for character recognition-a survey." Pattern recognition 29.4 (1996): 641-662.
- Indira, B., et al. "Classification and Recognition of Printed Hindi Characters Using Artificial Neural Networks." MECS IJ Image, Graphics and Signal Processing 6 (2012): 15-21. DOI: 10.5815/ijigsp.2012.06.03
- Lee Rodgers, Joseph, and W. Alan Nicewander. "Thirteen ways to look at the correlation coefficient." The American Statistician 42.1 (1988): 59-66. DOI:10.1080/00031305.1988.10475524
- Yen, Eugene K., and Roger G. Johnston. "The ineffectiveness of the correlation coefficient for image comparisons." Vulnerability Assessment Team, Los Alamos National Laboratory, MS J 565 (1996).
- Sheela Shankar, V. R. Udupi, "Assessment of the efficiency of correlation coefficient for face authentication",Vol. No.3, Issue No.8, August 2014,IJARSE, ISSN-2319-8354(E)
- Yen, Eugene K., and Roger G. Johnston. "The ineffectiveness of the correlation coefficient for image comparisons." Vulnerability Assessment Team, Los Alamos National Laboratory, MS J 565 (1996).
- Palm, R. G., and A. De Volpi. Plastic-casting intrinsic-surface unique identifier (tag). Argonne National Lab., IL (United States). Funding organisation: USDOE, Washington, DC (United States), 1995.
- Available at: PCB Wizard- Professional Edition http://www.new-wave-concepts.com Last Accessed- 17/01/2015
