A forecasting assessment of the affordability of a balanced diet for residents of Russian regions: an agent-based approach

Author: Mashkova Aleksandra L., Dukhi Natisha, Nevolin Ivan V., Savina Olga A.
Journal: Economic and Social Changes: Facts, Trends, Forecast @volnc-esc-en
Section: Regional economy
Article in issue: 6 т.14, 2021.
Free access
Amid the coronavirus pandemic in Russia, the financial situation of households is deteriorating, as well as their ability to provide themselves with a full-fledged and balanced diet with an optimal content of nutrients, vitamins and minerals. The aim of the work is to conduct a forecasting assessment of the affordability of a balanced diet for households in the context of various scenarios of the economic and epidemiological situation. The applied research methodology involves creating a comprehensive agent-based model reflecting the course of demographic and economic processes that determine food production, people’s income and health. When assessing the affordability of a balanced diet, we consider the number and income of households and the share of income allocated for the purchase of foodstuffs. The information content of the model is based on data arrays available at the websites of the Federal State Statistics Service of Russia, ministries and departments; we also use the data of a product prices monitoring conducted specifically for this purpose. We develop balanced diets that ensure the intake of 75 and 90% of key vitamins and minerals with the necessary caloric content. The products included in the diets are optimized by price; on the basis of the results of the prices monitoring, we estimate the cost of the diets and their affordability for the population in each region of the Russian Federation, according to the data as of 2020. The affordability of diets in different regions varies greatly: from 35% in the Chechen Republic to 95% in Moscow, with an average value of 83%. Scenario-based modeling of the affordability of high-quality food for Russian population is carried out for the period through to 2025. Under the optimistic scenario, there is a decrease in the affordability of diets to 81%; under the conservative and pessimistic scenarios, we observe a steady decline in the affordability of vitamin diets to 76 and 72%, respectively. The results we have obtained indicate serious risk of deterioration of the quality of nutrition of Russian residents; it is associated with falling incomes and rising food prices. Besides, within the framework of scenario-based calculations, we have determined the amount of subsidies to be provided to low-income population groups so that they could afford a balanced diet.
Standard of living, food affordability, balanced diet, agent-based modeling, computational experiment, prices monitoring
Short address: https://sciup.org/147236293
IDR: 147236293 | UDC: 338.439 | DOI: 10.15838/esc.2021.6.78.6
Text of the scientific article A forecasting assessment of the affordability of a balanced diet for residents of Russian regions: an agent-based approach
The decline in the population’s income and an increase in food prices during the pandemic not only affect the overall standard of living, but also threaten to worsen health by reducing the diet quality and the lack of key micronutrients that affect vital processes in the body. Dealing with this problem is one of the key directions of Russia’s economic policy. Measures introduced by the government to stabilize the prices of a number of products are an example of a regulatory policy, but not effective enough to fundamentally improve the situation.
Since the end of 2019, our team of authors has been implementing the international project “Study of anemia risk indicators among young children and adolescents in BRICS countries (India, South Africa, Russia) using machine learning and agent-based modeling”, funded by the Russian Foundation for Basic Research, the Department of Science and Technology of India, and the National Research Foundation of South Africa. The beginning of the pandemic, which coincided with project implementation, determined a special attention to economic factors affecting anemia risks, in particular the deterioration of households’ financial state and their ability to provide a balanced diet, by which we mean a diet balanced in nutrients (proteins, fats and carbohydrates), vitamins and minerals. A balanced diet for a healthy lifestyle includes fruits, vegetables, meat and cereals, with a reduced intake of salt, sugar and animal fats and an increased intake of proteins relative to carbohydrates. An unbalanced diet leads to a corresponding imbalance in micro- and macronutrients (deficiency of some and excess of others). As a result, this can lead to the development of various diseases, including iron deficiency anemia, which in childhood and adolescence causes the risks of impaired development and increased mortality. Thus, ensuring access to a balanced diet is vital for all population groups, especially the younger generation. The social and economic benefits of widespread implementation of healthy eating standards are also evident, in particular support for local producers of vegetables, fruits, and dairy products. Informing the population about the nutritional value of affordable products and their contribution to a balanced diet plays an important role1.
In the “Concept of improving food security of the CIS countries” adopted in 2010, the level of economic affordability of food is defined as the proportion of spending on food in total expenditure on all types of goods and services2. The Food Security Doctrine gives a broader interpretation, considering the food affordability as an opportunity to purchase food in amounts and assortments not less than the established rational norms of consumption, provided by the appropriate level of income of the population3.
Studies of food affordability are mainly statistically oriented [1; 2; 3]. The work [4] proposes a method of comparative analysis of food affordability in certain regions with different levels of income and food prices, based on the definition of regional standard units, reflecting the proportion of total income spent in the region under consideration on food. The methodology allows taking into account the effects of the absolute value of income, food prices in the country and the region, the balance of the consumer’s diet, the national or local proportion of spending on food. An empirical assessment of food affordability in Russia and its constituent entities identified regions with unsatisfactory levels of affordability and showed that the most vulnerable in this regard is the first quintile group, which confirms the need for state support measures.
The purpose of our work is a predictive assessment of the affordability of a balanced diet for households. This requires:
– first, to make a balanced diet of products affordable to the population;
– second, to obtain an actual estimate of the cost of such a diet in various regions of Russia;
– third, to conduct a forecast of the population’s income under the dynamics of the economic situation, subject to the influence of epidemiological risks.
An artificial society simulator developed by our team, reflecting the population, production, educational, financial and budgetary system of Russia, integrated into an agent-based model of the dynamics of anemia, is used to conduct forecasts of the Russian economy and population income dynamics.
Research methods
The main method of research is agent-based modeling – a special type of simulation modeling, which reproduces the dynamics of the system as a result of the interaction of micro-level agents. Agents in such models are characterized by the following features:
– heterogeneity, i.e. they have a set of parameters that distinguish them from each other: gender, age, marital status, occupation, income, region of residence;
– the ability to interact with each other and the environment by exchanging information, changing social status (e.g., applicants – student – graduate);
– limited rationality, which allows them to reflect the information available to them and to use functions other than maximizing expected utility in their decision-making (e.g., following the example of others or accepting the default option) [5].
The dynamics of agent-based models is nonequilibrium, since it is composed of the decisions and interactions of individual agents, which, in turn, are determined by stochastic functions [6]. This feature allows using the method of agent-based modeling to assess the effects of control actions on socio-economic systems. This class of models is called agent-based computational economy (ACE) [7]. ACE-models are simulators for assessing various options of tax [8], investment [9; 10] and monetary [11–14] policies, labor market regulation [15–17], financial system [18–21] and environmental protection [22].
A number of agent-based models have also been developed to assess the quality and affordability of a diet at the level of countries and regions. In the work [23] an agent-based model of world trade is presented, which takes into account socioeconomic, geopolitical, environmental factors, as well as the required nutritional value of diets. The model analyzes how international trade restrictions affect food security and nutrition in the world, including the balance of micro and macronutrients in the diet. The results show that fully free world trade increases the affordability and quality of a diet in Africa, Asia, and Latin America, as people in these regions gain access to a wide range of foods.
The agent-based model of community food security is presented in [24], and by community food security in this study we mean “a situation where all members of the community receive a safe, nutritious and culturally and traditionally acceptable diet”. The modeling methodology considers employment and income, food support programs for low-income households, and access to clean water and cooking fuel. The model is used to analyze food security in developing countries, particularly Malawi, where the problem is particularly acute.
The model in the work [25] reproduces the interaction between consumers, food vendors, and quality assessment inspections. The purpose of the modeling is to assess the impact of regulatory rules on improving food quality and safety. Aspects of social responsibility in food production are considered in the agent-based model presented in [26]. The model reproduces the public debate on food production and the corresponding changes in the food industry influenced by public opinion.
The methodology used in the research of our group of authors implies the creation of complex agent-based models, reflecting the course of various socio-economic processes (demographic, educational, migration, production), their impact on the lives of individuals and the relationship with each other. In the context of creating a model of the dynamics of anemia, the key processes will be demographic (since the need for nutrients depends on age) and economic (determining, on the one hand, the production of various foods, on the other, the income of the population that allows purchasing these products). The model also reflects the work of the tax and budget systems, including the payment of benefits to various categories of the population (pensions, unemployment benefits, child care benefits for children aged under three years old and for children from three to seven years old for low-income families), financing public sector organizations (education, healthcare, defense and security), subsidizing key industries (Fig. 1). The structure of the model’s budget system is presented in [27].
The population in the model is reproduced considering the sex-age structure, composition of households and regional distribution. A key role in the model is played by such parameter as a resident’s health status, which implies the presence or absence of iron deficiency anemia (if anemia is present, its stage is detailed: storage depletion, mild deficiency or iron deficiency anemia). The agents in the model are combined into households with a common budget that includes the salaries and benefits of all household members. The reproduction of demographic processes in the model is considered in [28].
Production in the model reflects the sectoral structure of the economy (the key sectors here are agriculture, fishing and food production) and the financial system. The population is connected with the economic system in the processes of employment and consumption. As employees, residents receive wages, and as consumers, they purchase products and services. Food purchases detail the amount of cereals, meat, fish, dairy products, fruits and vegetables consumed by households.
Figure 1. Scheme of dynamics model of anemia spreading
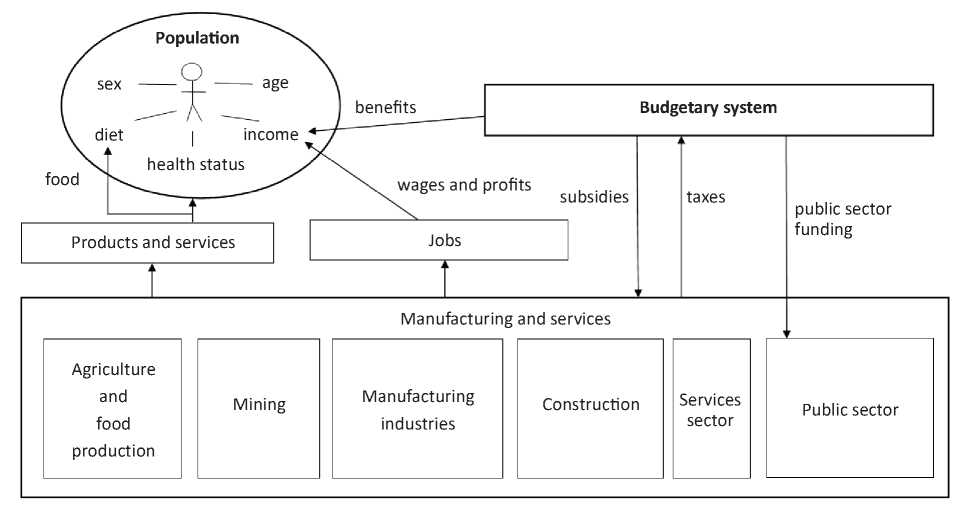
Source: own compilation.
The state in the model regulates food production and consumption through the following types of control actions:
– investments in production expansion and import substitution programs for domestic food producers;
– regulation of exports and imports of agricultural products;
– tax incentives for industries – producers of food products;
– payment of benefits to low-income families.
For assessing the affordability of a balanced diet for Russian population, the key algorithm for calculating the amount allocated for the purchase of food (Fig. 2) , and the algorithms for paying
Figure 2. Algorithm for assessing the affordability of a balanced diet to households
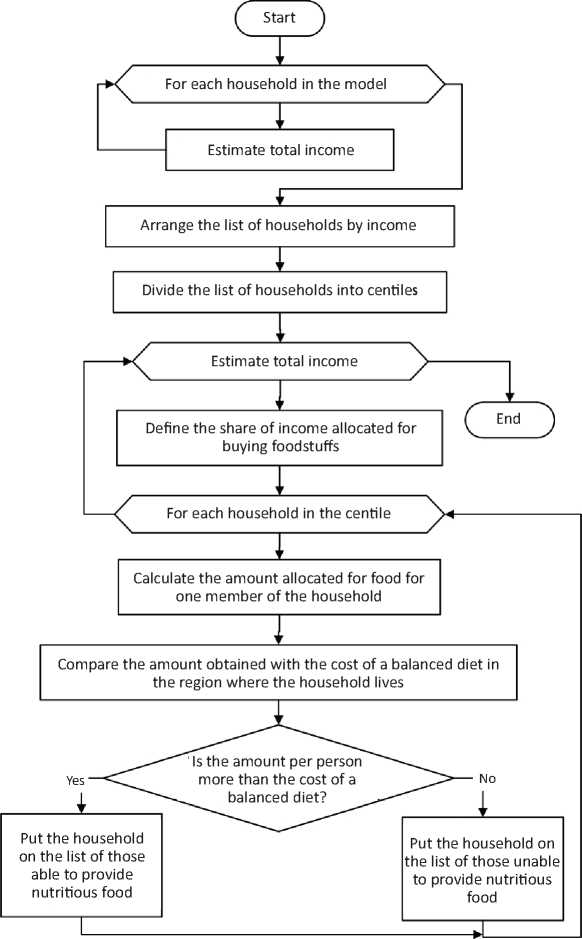
Source: own compilation.
wages and benefits, of which household income is made up, are auxiliary. After calculating the total household income, the list is sorted and divided into centiles by income level.
For each centile we determine the proportion of income spent on food (according to statistical data), and for each household included in the centile we calculate S – the amount spent on food per household member:
5 = D x F / N, where D – total household income;
F – the proportion of income spent on of food, N – the number of households.
The resulting amount is compared with the cost of a balanced diet, and depending on the result of the comparison, the household is placed on one of the lists: either of households that have access to a balanced diet or those that do not.
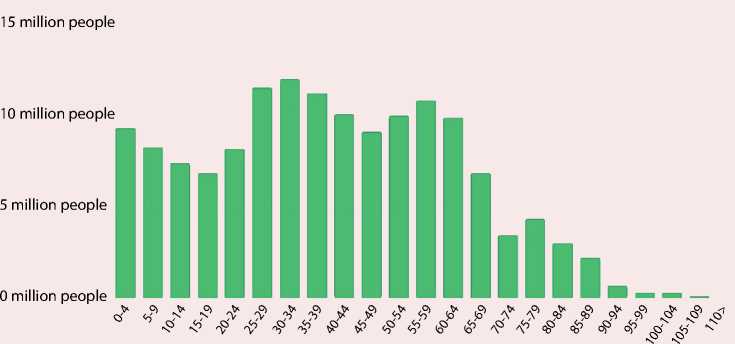
The agent-based model of anemia distribution dynamics has been implemented in Microsoft VisualStudio in C#. Figure 3 presents the model interface, showing the forecast of the gender-age structure of the population in 2025.
Figure 3. Prediction of the gender-age structure of the population in the anemia prevalence dynamics model
54.61
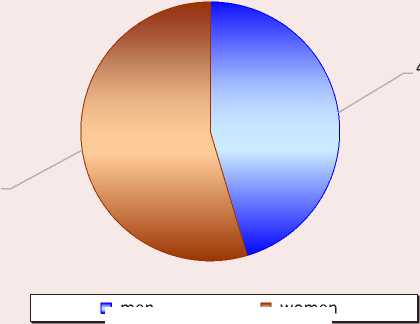
men women
45.39
Source: own compilation.
Data of a more complex structure is unloaded from the model database into Excel files, on the basis of which the final tables and graphs are built.
Baseline modeling data
Obtaining baseline modeling data is a key task in our study, because they allow reproducing the current state of the system in the geographic and socio-economic context, thereby increasing the accuracy of the forecast and expanding the possibilities of its interpretation for real management tasks.
For the information content of the model we use the data sets presented on the websites of the Federal State Statistics Service, the All-Russian Population Census, the ministries of Finance, Economic Development, Science and Higher education, as well as on the unified portal of the budgetary system of the Russian Federation. The baseline modeling data are reduced to the Excel spreadsheet format to be loaded into the model.
In order to reflect the demographic situation, information on the number of populations by gender-age groups in each region and their belonging to households is necessary. The number of private, collective, and homeless households in the regions is determined on the basis of data from the Russian Census of 2010. Since no scheduled census was conducted in 2020 due to the COVID-19
pandemic, in order to update the 2010 census data, information on the population size of households of different types is reduced to a fraction of the total number, based on which the approximate number of households of each type in 2020 is determined. Table 1 presents a fragment of the table containing the estimated data on the number of households in the Belgorod Oblast.
The number of registered cases of anemia in Russian regions in different age groups is determined on the basis of data from the collection Health Care in Russia of the Federal State Statistics Service.
For modeling production and services, we use information on the gross regional product and its sectoral structure, data from official “input-output” tables, reflecting the supply of organizations, imports and exports for 2017.
Information on the structure and composition of the labor force and the average wage of workers in organizations in various industries and regions is used to establish the link between resident agents and jobs.
The proportion of income devoted to buying food is determined by the Federal State Statistics Service, depending on the income level of households. Table 2 shows the percentage of spending on food depending on whether the household belongs to a certain income centile.
Table 1. The number of households in the Belgorod Oblast
Total population, people including the population of private households collective household homeless households Population living in households Urban settlements 1,012,932 1,002,677 10,137 118 Rural-type settlements 519,594 517,986 1,591 17 Proportion of the population living in households (estimated value) Urban settlements 100 98.9876 1.0008 0.0116 Rural-type settlements 100 99.6905 0.3062 0.0033 Population living in households (January 1, 2020, estimated value) Urban settlements 1,045,518 1,034,933 10,464 121 Rural-type settlements 503,633 502,074 1,542 17 Source: compilation according to the Russian Census data. Available at:
Table 2. Household consumption structure depending on income
|
Percentage of income for food consumption |
Income Centile |
|||||||||
|
1 |
2 |
3 |
4 |
5 |
6 |
7 |
8 |
9 |
10 |
|
|
48.1 |
45.9 |
44.1 |
41.3 |
39.1 |
37.3 |
35.3 |
32.3 |
28.3 |
18.4 |
|
Source: compilation according to Federal State Statistics Service data. Available at:
In order to assess the affordability of high-quality food for residents of Russian regions, it is necessary, in addition to data on income, to have data on the composition of a balanced diet and its cost in different regions of Russia.
In collaboration with nutritionist Dr. Natisha Dukhi, our team developed diets that provide 75% (diet I) and 90% (diet II) of the key vitamins and minerals while providing the necessary caloric intake and a balanced macronutrient (protein, fat and carbohydrate) intake. The diets were based on the norms of physiological requirements for energy and nutrients for various groups of the Russian Federation population as determined by the Russian Academy of Medical Sciences and approved by the Federal Service for Supervision of Consumer Rights Protection and Human Welfare. The developed diets contain products available for purchase in most retail outlets in all regions of Russia. In order to achieve the necessary nutritional value, the basket of products was optimized by price, that is, from similar nutritional products (for example, shrimp, squid, and pollock) the cheapest alternative (pollock) was chosen. Table 3 shows the
Table 3. Food basket composition of type I and type II diets
Both diets are balanced in terms of macronutrients, with type I having a higher proportion of carbohydrates (65% vs. 60%), making it cheaper than type II.
Figure 4 shows the structure of the diets described above by food groups. As shown in the diagrams, the proportions of vegetable, meat, and fish consumption are similar in both diets, while the predominance of cereals and bread in type I diet is replaced by an increase in the proportion of fruits and dairy products in type II diet.
In order to calculate the cost of the described diets in different regions of Russia, it is necessary to monitor the prices of products at the sales outlets, which can be done in several ways. First, major retail chains publish assortments with product prices on their websites. Restrictions on the mobility of citizens caused by the spread of COVID-19 prompted retailers to more actively develop online commerce [29], so federal and regional outlet operators fully disclosed the catalogs of their online stores. This situation makes it possible to observe prices in the cities – centers of the RF constituent entities directly on the websites, providing the agent model with
Figure 4. Structure of diets by product groups: a) type I; b) type II, %
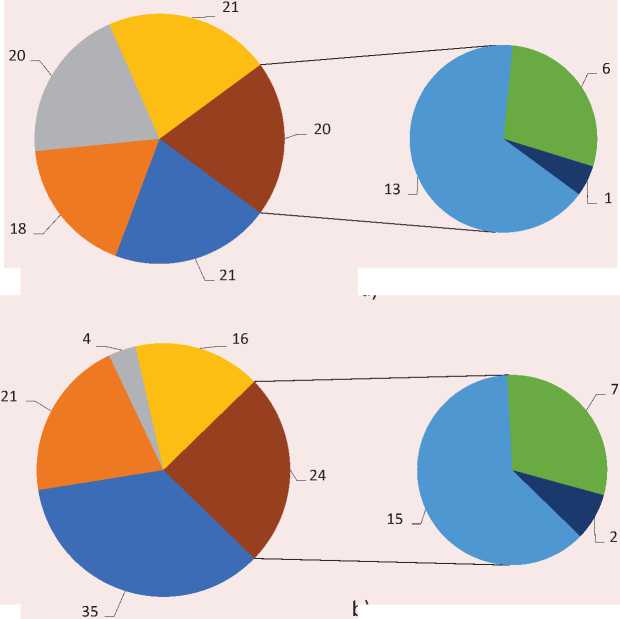
b)
■ Cereals and bread ■ Fruits and berries ■ Meat and eggs ■ Nuts and oils
■ Vegetables
■ Dairy products
■ Fish and seafood
a)
Source: own compilation.
data in the regional context. Although in recent years online sales in the structure of retailing have been growing [29; 30], the disadvantage of this method is the inability to guarantee that the price on the website corresponds to the price of the same product at the sales outlet.
Second, it is possible to monitor prices by specially hired and trained auditors in the field. On the one hand, this makes it possible to cover sales outlets even in rural areas, where representatives of large chains are rarely found, and accurately establish the price as well as the range of offerings. Indeed, a website may show the price of a product, but says little about its presence on the shelf. Sales outlets monitoring provides prices for only those items on a broad list of items interesting to researchers that are actually offered to the public. On the other hand, this method requires high costs associated with finding and training auditors.
The second method of price monitoring was chosen to populate the data of the agent-based model, the task of which was to enumerate price tags for predetermined groups of goods in the cities – centers of the RF constituent entities and in two rural retail outlets. The groups of goods covered foodstuffs, the consumption of which significantly affects the development of iron deficiency anemia, according to an expert assessment based on the experience of many years of research. 98 products are combined into 21 groups. Of course, on the shelves there is an assortment of the same type of goods – for example, the products of several milk producers of different packaging and different fat content. In order to assess the affordability of the diet, priority is given to the so-called first-price goods – the cheapest among similar ones without taking into account the loyalty card. Thus, if we talk about dairy products, the cheapest offer of sour cream 15% fat without milk fat substitutes per unit weight is selected. Priority for observation was the retail chain “Magnit”, in the absence of chain stores in the city – the nearest store of a large retail chain to the auditor and, finally, in the absence of chain stores (which is typical for rural areas) – the store closest to home.
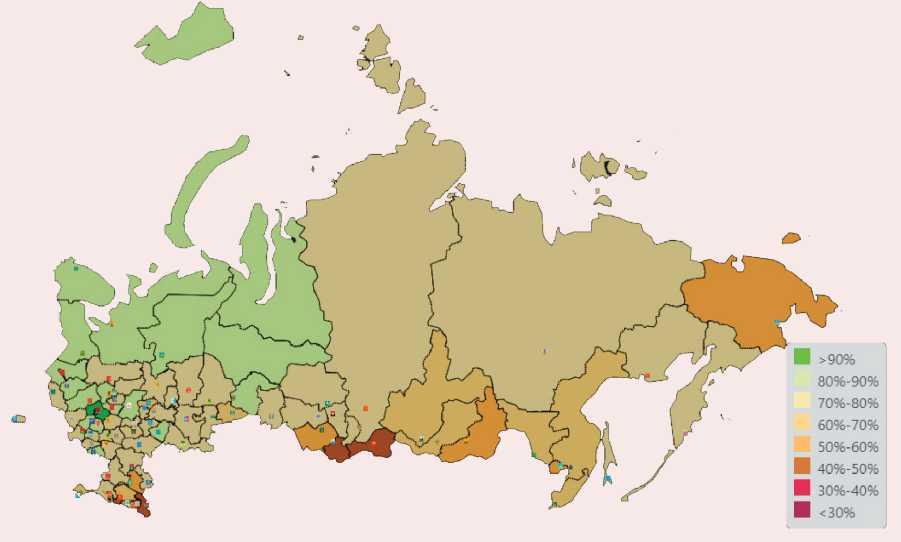
According to the results of the monitoring in 77 constituent entities of the Russian Federation, data were collected on the prices of 31,354 products. 4,848 of them were found to be minimum prices for certain products in their regions. Information on the regions not covered by the monitoring was taken from the Unified Interdepartmental Information and Statistical System (EMISS). Table 4 shows the regions in which the cost of type I diets is the highest and the lowest.
The map in Figure 5 shows the cost of type I diet in different regions.
Table 4. Cost of type I diets in Russian regions, rubles
|
Region |
Cost |
Region |
Cost |
|
Belgorod Oblast |
3573,65 |
Chukotka Autonomous Okrug |
10207,13 |
|
Penza Oblast |
3591,62 |
Sakhalin Oblast |
6200,99 |
|
Republic of Mordovia |
3621,52 |
Kamchatka Krai |
6029,98 |
|
Voronezh Oblast |
3625,66 |
Magadan Oblast |
5953,77 |
|
Vladimir Oblast |
3626,06 |
Jewish Autonomous Oblast |
5458,71 |
|
Tambov Oblast |
3637,01 |
Khabarovsk Krai |
5329,92 |
|
Rostov Oblast |
3659,93 |
Republic of Sakha (Yakutia) |
5094,67 |
|
Yaroslavl Oblast |
3675,02 |
Primorsky Krai |
4885,62 |
|
Source: compilation according to data from the monitoring of food prices in Russian regions, carried out by OOO Infokommerts within the framework of the RFBR project No. 19-57-80003. |
|||
Figure 5. Map of the cost of type I diets
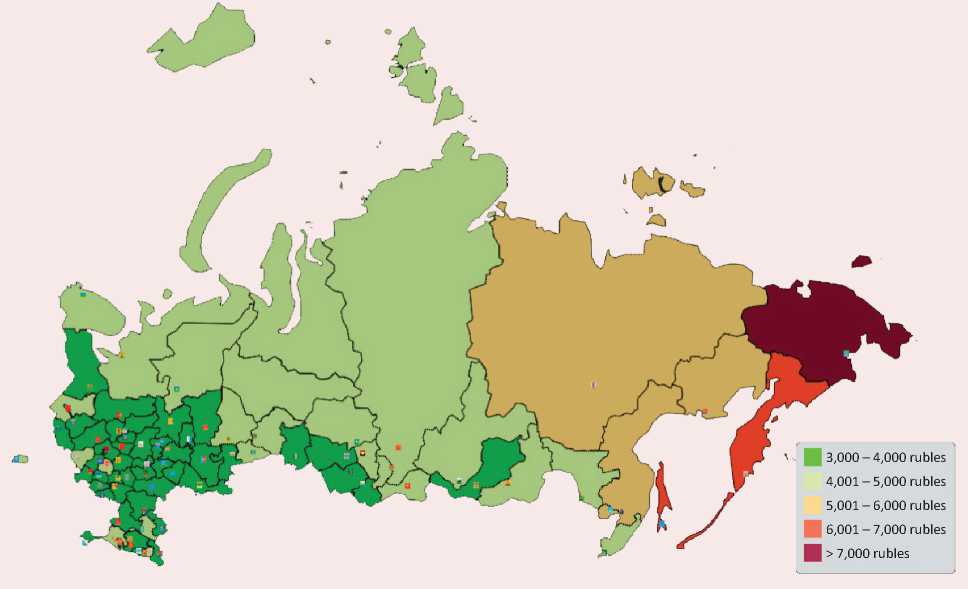
Source: own compilation.
Results and discussion
We modeled diet affordability in Russian regions within the framework of three scenarios, considering epidemiological risks and the resulting dynamics of economic processes.
-
1. Pessimistic, in which coronavirus waves are regularly repeated due to virus mutation and the emergence of new variants. In this scenario, it is inevitable that restrictive measures will be introduced and global demand will be limited, and it will take several years to restore it to pre-crisis values in all spheres.
-
2. Conservative, assuming the spread of the coronavirus in 2021–2022 and its completion by the
end of 2022. In this case, economic growth (both Russian and global) can be expected in two years.
-
3. Optimistic, which assumes that the pandemic will subside by the beginning of 2022 and all sectors of the economy will have recovered by that time.
In order to implement the developed scenarios, the model includes forecast series of (Tab. 5):
-
– the ruble exchange rate against the US dollar;
-
– the price of a barrel of oil in US dollars;
-
– export volumes of various industries;
-
– inflation (in particular, the cost of developed diets).
Table 5. Projected values of scenario parameters in 2025
Scenario indicator
Scenario
Pessimistic
Conservative
Optimistic
RUB/USD exchange rate, RUB
100
80
60
The price of a barrel of oil, US dollars
30
60
80
Food basket inflation, %
8
6
4
Source: own compilation.
Modeling the affordability of nutritious diet for the Russian population under different scenarios was carried out for the period through to 2025. Figure 6 shows the forecast for the affordability of type II diets, providing 90% of the necessary vitamins and minerals. As a basis for comparison we chose the year 2020, in which type II diet was available to 59% of the population. After a fall in 2021, caused by a sharp increase in food prices, this level is reached again only in 2023 under the optimistic scenario. Under the pessimistic scenario, the level of dietary affordability falls to 51% in 2025.
Figure 7 shows the forecasted affordability of a type I or type II diet, i.e., obtaining at least 75% of the micronutrient set. Compared with 83% availability in 2020, the optimistic scenario shows a drop to 81%, a level that persists throughout the modeling period. In the conservative and optimistic scenarios, there is a steady decline in vitamin diet affordability to 76% and 72%, respectively.
Table 6 shows the regions with the highest and lowest affordability of type I or type II diets under the conservative scenario.
As the data in Table 6 show, there is a significant differentiation in the affordability of quality products for the population among the regions. However, the situation in Chechnya and a number of other republics may in practice be much better than the calculated data due to the widespread
Figure 6. Availability of type II diets for the population of the Russian Federation, % of the population
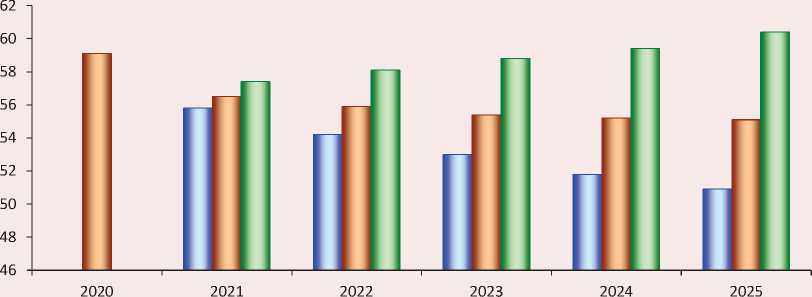
□ pessimistic □ conservative □ optimistic
Source: own compilation.
Figure 7. Affordability of type I or type II diets for the population of the Russian Federation, % of the population
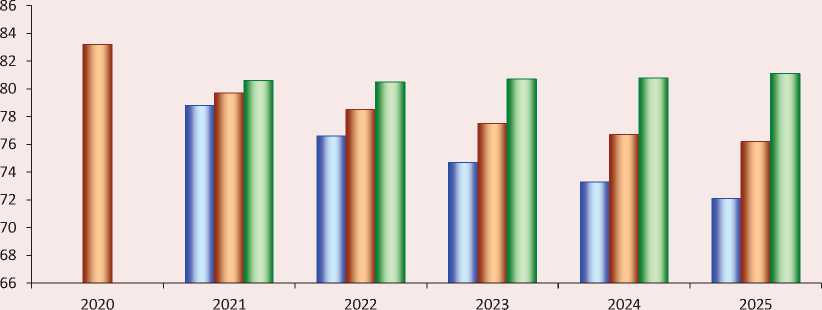
□ pessimistic □ conservative □ optimistic
Source: own compilation.
Table 6. Affordability of vitamin diets in Russian regions, % of the population (forecast under the conservative scenario)
Moscow, Saint Petersburg and the Moscow Oblast, where relatively high incomes of the population and relatively low cost of products included in the proposed diets are combined. The map in Figure 8 reflects the forecast of the affordability of type I diet in various regions of Russia in 2025 under a conservative scenario.
Figure 8. Map of the affordability of vitamin diets in the regions of Russia (forecast under a conservative scenario), % of the population
Source: own compilation.
Table 7. Forecast of the necessary amount of subsidies on food for the population, billion rubles
|
Year |
Scenario |
||
|
pessimistic |
conservative |
optimistic |
|
|
2021 |
467.5 |
443.1 |
421.6 |
|
2022 |
545.0 |
487.0 |
423.2 |
|
2023 |
637.3 |
532.6 |
429.4 |
|
2024 |
732.7 |
577.0 |
435.9 |
|
2025 |
837.4 |
622.8 |
437.7 |
|
Source: own compilation. |
|||
The results indicate a serious threat to the diet quality of Russian residents, associated with both a drop in income amid pandemic restrictions and a noticeable increase in food prices. Given the spread of the Covid Indian variant in Russia, conservative and pessimistic scenarios in which the proportion of the population with sufficient money to purchase a nutritious diet decreases by 7–11% seem most likely (Fig. 6). Since part of the population is employed in industries that suffer from the restrictions imposed, for them in a pessimistic scenario an increase in income is difficult to achieve.
In these circumstances, the most effective measure seems to be the implementation of a program of targeted support for low-income families (in the form of benefits or food stamps), which would promote access to a diet that provides at least 75% of the necessary vitamins and minerals for all
Russians. Scenario calculations make it possible to determine the amount of subsidies needed to implement such a program (Tab. 7) . At each step of the modeling for households that do not have enough money to purchase at least type I diets, the missing amount for each household member is summed up. The obtained sums are grouped by the modeling years.
Thus, under the optimistic scenario, the standard of living remains fairly stable, as evidenced by the preservation of the required amount of subsidies at the level of 420–440 billion rubles. Under the pessimistic and conservative scenarios, the standard of living falls, and with it the volume of required subsidies increases to 837 and 623 billion rubles, respectively.
The results are based on two assumptions.
The main criterion for a household when choosing a diet is balance in terms of micro- and macronutrient content. Despite the widespread occurrence of ideas about healthy lifestyles in recent years, most of the population still quite seriously deviates from the recommended dietary standards, including in the diet a significant amount of sweet confectionery products and convenience food, which leads to either a more expensive diet (if in addition to these foods all the necessary products containing vitamins and minerals are purchased), or a decrease in its nutritional value (if the purchase of less nutritious products is at the expense of more healthy ones). Consideration of this factor is an important part of the work ahead, while the purpose of our article is to assess the potential affordability of a balanced diet from a financial perspective.
In assessing household income, we took into account the wages of employees of organizations (both official and unreported employment – based on studies in individual industries and regions), entrepreneurial profits and government benefits.
It does not consider the shadow economy, which includes both unreported employment (private tutors, cosmetology services, construction and repair services, etc.) and the criminal sphere. Obtaining more reliable income estimates could adjust the required amount of food subsidies downward, but in practice this problem is solved quite successfully by collecting information on the assets of applicants.
Conclusion
Our research aims to develop a software tool for analyzing diet affordability and anemia spread in the BRICS countries. The proposed tool is founded on an agent-based model and its integration of data on public health and nutritional balance, which are directly linked to the economy – food production and consumption, employment, income of the population. There is a need for new rules for agriculture, food processing, food logistics, and health care.
The scientific significance of the study lies in the development of a methodology based on the integration of big data arrays and computer models of anemia distribution, which allows performing scenario analysis of regulatory impact in the food sphere.
The practical significance of the study lies in the development of tools for predicting the consequences of decisions and identifying priority areas for state intervention. The following controllable parameters of the computer model can be set: the volume of investment in the expansion of production and import substitution programs of Russian food producers; regulation of exports and imports of agricultural products; tax incentives for industries – producers of food and payment of benefits to low-income families. The model provides an assessment of the impact of management decisions on the prevalence of anemia and the affordability of quality diet for the population. The results of the study can be used by the authorities in the BRICS countries when forming strategies for agricultural development, subsidizing the population, and promoting healthy lifestyles.
References A forecasting assessment of the affordability of a balanced diet for residents of Russian regions: an agent-based approach
- Redchikova N., Semenova A. Economic access to food in the Russian Federation. Vestnik Tomskogo gosudarstvennogo universiteta. Ekonomika=Tomsk State University Journal of Economics, 2015, no. 4(32), pp. 71–87 (in Russian).
- Vodyasov P.V., Minenko A.V. Estimation of economic factors of demand in the food market. Ekonomika: vchera, segodnya, zavtra=Economics: Yesterday, Today and Tomorrow, 2018, vol. 8, no. 2А, no. 26–32 (in Russian).
- Yashkova N.V. Methodology for assessing the physical availability of food. Fundamental’nye issledovaniya=Fundamental Research, 2020, no. 8, pp. 92–96. Available at: http://fundamental-research.ru/ru/article/view?id=42833 (accessed: July 7, 2021; in Russian).
- Borodin K.G. Economic access to food: Factors and methods of assessment. Ekonomicheskii zhurnal VShE=HSE Economic Journal, 2018, vol. 22, no. 4, pp. 563–582 (in Russian).
- Akerlof G.A. Behavioral macroeconomics and macroeconomic behavior. American Economic Review, 2002, vol. 92, pp. 411–433. DOI: 10.1257/00028280260136192
- Fagiolo G., Roventini A. Macroeconomic policy in DSGE and agent-based models redux: New developments and challenges ahead. Journal of Artificial Societies and Social Simulation, 2017, vol. 20(1). Available at: http://jasss.soc.surrey.ac.uk/20/1/1.html. DOI: 10.18564/jasss.3280
- Tesfatsion L., Judd K. (Eds.) Handbook of Computational Economics, vol. 2: Agent-Based Computational Economics. Amsterdam, North Holland, 2006. 904 p.
- Haber G. Monetary and fiscal policies analysis with an agent-based macroeconomic model. Journal of Economics and Statistics, 2008, vol. 228, pp. 276–295. DOI: 10.1515/jbnst-2008-2-308
- Bassi F., Lang D. Investment hysteresis and potential output: A post-Keynesian–Kaleckian agent-based approach. Economic Modelling, 2016, vol. 52, pp. 35–49. DOI: 10.1016/j.econmod.2015.06.022
- Napoletano M., Dosi G., Fagiolo G., Roventini A. Wage formation, investment behavior and growth regimes: An agent-based analysis. Revue de l’OFCE, 2012, vol. 124, pp. 235–261 DOI: 10.3917/reof.124.0235.
- Branch W.A., Evans G.W. Monetary policy and heterogeneous expectations. Economic Theory, 2011, vol. 47, pp. 365–393, DOI: 10.1007/s00199-010-0539-9
- Delli Gatti D., Desiderio S. Monetary policy experiments in an agent-based model with financial frictions. Journal of Economic Interaction and Coordination, 2015, vol. 10(2), pp. 265–286, DOI: 10.1007/s11403-014-0123-7
- Alexandre M., Lima G.T. Combining monetary policy and prudential regulation: An agent-based modeling approach. J Econ Interact Coord, 2020, vol. 15, pp. 385–411, DOI: 10.1007/s11403-017-0209-0
- Popoyan L., Napoletano M. Roventini A. Taming macroeconomic instability: Monetary and macro prudential policy interactions in an agent-based model. Journal of Economic Behavior & Organization, 2017, vol. 134 (February), pp.117–140. DOI: 10.1016/j.jebo.2016.12.017
- Blanchard O., Galí J. Labor markets and monetary policy: A new Keynesian model with unemployment. American Economic Journal: Macroeconomics, 2010, vol. 2, pp.1–30. DOI: 10.2139/ssrn.920959
- Dawid H., Gemkow S., Harting P., Neugart M. Labor market integration policies and the convergence of regions: The role of skills and technology diffusion. Journal of Evolutionary Economics, 2012, vol. 22, pp. 543–562. DOI: 10.1007/s00191-011-0245-1
- Riccetti L., Russo A., Gallegati M. Unemployment benefits and financial leverage in an agent based macroeconomic model. Economics: The Open-Access, Open-Assessment E-Journal, 2013b, vol. 7, no. 2013–42. DOI: 10.5018/economics-ejournal.ja.2013-42
- Anufriev M., Assenza T., Hommes C., Massaro D. Interest rate rules and macroeconomic stability under heterogeneous expectations. Macroeconomic Dynamics, 2013, vol. 17(08), pp.1574–1604. DOI: 10.2139/ssrn.1400748
- Battiston S., Delli Gatti D., Gallegati M., Greenwald B., Stiglitz J. Liaisons dangereuses: Increasing connectivity, risk sharing, and systemic risk. Journal of Economic Dynamics & Control, 2012, vol. 36(8), pp.1121–1141. DOI: 10.1016/j.jedc.2012.04.001
- Russo A., Riccetti L., Gallegati M. Increasing inequality, consumer credit and financial fragility in an agent based macroeconomic model. Journal of Evolutionary Economics, 2016, vol. 26, pp.25–47. DOI: 10.2139/ssrn.2356249
- Raberto M., Teglio A., Cincotti S. Integrating real and financial markets in an agent-based economic model: An application to monetary policy design. Computational Economics, 2008, vol. 32(1), pp. 147–162. DOI: 10.1007/s10614-008-9138-2,
- Gerst M., Wang P., Roventini A., Fagiolo G., Dosi G., Howarth R., Borsuk M. Agent-based modeling of climate policy: An introduction to the engage multi-level model framework. Environmental Modelling & Software, 2013, vol. 44, pp. 62–75. DOI: 10.1016/j.envsoft.2012.09.002
- Ge J., Polhill J., Macdiarmid J., Fitton N., Smith P., Clark H., Dawson T., Aphale M. Food and nutrition security under global trade: A relation-driven agent-based global trade model. Royal Society Open Science, 2021, vol. 8, no. 201587. DOI: https://doi.org/10.1098/rsos.201587
- Dobbie S., Schreckenberg K., Dyke J., Schaafsma M., Balbi S. Agent-based modelling to assess community food security and sustainable livelihoods. Journal of Artificial Societies and Social Simulation, 2018 vol. 21(1), no. 9. DOI: 10.18564/jasss.3639
- Buurma J., Hennen W., Verwaart T. How social unrest started innovations in a food supply chain. Journal of Artificial Societies and Social Simulation, 2017, vol. 20(1), no. 8. DOI: 10.18564/jasss.3350
- McPhee-Knowles S. Growing food safety from the bottom up: An agent-based model of food safety inspections. Journal of Artificial Societies and Social Simulation, 2015, vol. 18(2), no. 9. DOI: 10.18564/jasss.2717
- Mashkova A.L., Novikova E.V., Savina O.A., Mamatov A.V., Mashkov E.A. Simulating budget system in the agent model of the Russian Federation spatial development. In: Chugunov A., Khodachek I., Misnikov Y., Trutnev D. (Eds.). Electronic Governance and Open Society: Challenges in Eurasia. EGOSE 2019. 2020, Communications in Computer and Information Science. Vol. 1135. Pp.17–31. DOI: 10.1007/978-3-030-39296-3_2.
- Mashkova A.L., Novikova E.V., Savina O.A., Mashkov E.A. Generating synthetic population for the agent-based model of the Russian Federation spatial development. In: Ahrweiler P., Neumann M. (Eds.). Advances in Social Simulation. ESSA 2019. Springer Proceedings in Complexity. Springer, Cham. 2021. Pp. 183–187. DOI: 10.1007/978-3-030-61503-1_17
- Goncharuk I.V. Review of research on the impact of the COVID-19 pandemic on the development of global and Russian e-commerce. Tamozhennaya politika Rossii na Dal’nem Vostoke=Customs Policy of Russia in the Far East, 2021, no. 1(94), pp. 66–82. DOI: 10.24866/1815-0683/2021-1/66-82 (in Russian).
- Alfonso V., Boar C., Frost J., Gambacorta L., Liu J. E-commerce in the pandemic and beyond. BIS Bulletin, 2021, vol. 36, pp. 1–7. Available at: https://www.bis.org/publ/bisbull36.htm
