A Frame of Intrusion Detection Learning System Utilizing Radial Basis Function

Author: S.Selvakani Kandeeban, R.S.Rajesh
Journal: International Journal of Modern Education and Computer Science (IJMECS) @ijmecs
Article in issue: 1 vol.4, 2012.
Free access
The process of monitoring the events that occur in a computer system or network and analyzing them for signs of intrusion is known as Intrusion Detection System (IDS). Detection ability of most of the IDS are limited to known attack patterns; hence new signatures for novel attacks can be troublesome, time consuming and has high false alarm rate. To achieve this, system was trained and tested with known and unknown patterns with the help of Radial Basis Functions (RBF). KDD 99 IDE (Knowledge Discovery in Databases Intrusion Detection Evaluation) data set was used for training and testing. The IDS is supposed to distinguish normal traffic from intrusions and to classify them into four classes: DoS, probe, R2L and U2R. The dataset is quite unbalanced, with 79% of the traffic belonging to the DoS category, 19% is normal traffic and less than 2% constitute the other three categories. The usefulness of the data set used for experimental evaluation has been demonstrated. The different metrics available for the evaluation of IDS were also introduced. Experimental evaluations were shown that the proposed methods were having the capacity of detecting a significant percentage of rate and new attacks.
Genetic algorithm, Intrusion Detection, KDD 99 Data Set, Radial Basis Function neural Network
Short address: https://sciup.org/15010374
IDR: 15010374
Text of the scientific article A Frame of Intrusion Detection Learning System Utilizing Radial Basis Function
Published Online February 2012 in MECS
In recent years Security attacks through Internet has increased to many folds and Information security becomes a serious global concern of the present time. The growth of Internet has brought not only the benefits but also the security threat to the modern world. The threats on the Internet can translate to substantial losses resulting from business disruption, loss of time and money and damage to reputation.
The growth of Internet has brought about great benefits to the modern society; meanwhile, the rapidly increasing connectivity and accessibility to the Internet has posed a tremendous security threat. Malicious usage, attacks and sabotage have been on the rise as more and more computers are put into use. The attacks on the Internet have become both more prolific and easier to implement because of the ubiquity of the Internet and the pervasiveness of easy-to-use operating systems and development environments.
An IDS typically operates behind the firewall looking for patterns in network traffic that might indicate malicious activity. The existing network security solutions including firewalls were not designed to handle network and application layer attack such as Denial of Service. The unauthorized activities on the Internet are not only by the external attackers but also by internal sources. These internal activities cannot be prevented by a firewall which usually stops the external traffic from entering the internal network.
Technologies such as anti-virus and anti-malware are of importance. IDS forms the main backbone of detection and add a whole other layer of protection, by analyzing certain criteria that other antivirus cannot, therefore improving security and coving all aspects of malicious activity not just from a single source of attack such as viruses. They are also extremely useful not only in protecting the network but also for identifying problems with security policies, documenting and categorizing current threats to the system. There is a need for IDS system because it is very hard to detect malicious behaviour in a networked environment without it and as well make sure that access rights are being enforced correctly [6].
IDS is a security system that monitors any unauthorized access, violations and malicious activities in the network system. There are two main types of IDS, such as NIDS (Network based IDS) and HIDS (Host based IDS). A network based IDS monitors network traffic on a particular segment or device and analyse the network transport and application layer protocols to identify malicious activity. This particular system looks for patterns of network traffic in order to determine attack variations. A host based IDS is responsible for a single host only. The primary function is to categorize the various system and data files, so that any attempt at access is logged, monitored the traffic and reported.
This paper is organized as follows: section 2 presents an overview of related works. The data set used is described in section 3. Then section 4 describes the first two phases of our work followed by the continuation of
RBF training. Finally section 5 describes the experimental results of our method applied to (Defense Advanced Research Projects Agency) DARPA data set followed by conclusions and future work.
-
II. background study
The application of neural networks to intrusion detection has been investigated by many researchers. Properly designed and implemented, neural networks have the potential to address many of the problems encountered by rule based approaches.
Lippmann and Cunningham [8] of MIT (massachusetts institute of technology) Lincoln Laboratory conducted a number of tests employing neural networks for misuse detection (Planquart, 2001; Rhodes et al. 2000). The system was searching for attack-specific keywords in the network traffic [15,16]. A multilayer perceptron had been used for detection UNIX host attacks, and attacks to obtain root-privilege on a server. The system was trying to detect the presence of an attack by classifying the inputs into two outputs: normal and attack. The system was able to detect 80% of attacks. The main achievement of this system was its ability to detect old as well as new attacks which was not included in the training data.
L. Girardin [11] of UBILAB laboratory performed clustering of network traffic in order to detect attacks. A visual approach [17] was chosen for attack association (Sabhnani and Serpen, 2003). Self Organizing Maps (SOM) were employed to project network events on an appropriate 2D-space for visualization and then the network administrator analyzed them. Intrusions were extracted from the view by highlighting divergence from the norm with visual metaphors of network traffic. The main disadvantage of this approach is its need in interpretation of network traffic by an administrator or other authorized person to detect attacks.
Kayacik et al. utilize KDD Cups data set for the experiments [12]. They create three layers of employment (Kayacik et al. , 2003): First, individual SOM are associated with each basic Transmission Control Protocol (TCP) feature. This provides a concise summary of the interesting properties of each basic feature as derived over a suitable temporal horizon. Secondly, integrates the views provided by the first level SOM into a single view of the problem. At this point, they used the training set labels associated with each pattern to label the respective best matching unit in the second layer. The third layer is built for those neurons, which win for both attack and normal behaviors. The results in third layer SOMs being associated with specific neurons in the second layer. Moreover, the hierarchical nature of the architecture means that the first layer may be trained in parallel and the third layer SOMs were only trained over a small fraction of the data set.
Several researchers have combined Multi-Layer Perceptron (MLP) and Self-Organizing Map (SOM) in their attempt to create an intrusion detection system. Cannady et al. of Georgia Technical Research Institute and Fox et al. have investigated application of MLP model and SOM for misuse detection (Fox et al. , 1990;
Cannady and Mahaffey, 1997; Planquart, 2001). They [4,5,10] have used a feed-forward network with back-propagation learning, which contained 4 fully connected layers, 9 input nodes and 2 output nodes (normal and attack). The network had been trained for a certain number of attacks. The network was succeeded in identifying attacks for which it was trained for. It has been shown that network traffic can be efficiently modeled using [2, 7, 8] artificial neural networks (Aussem et al. , 2000; Cunningham and Lippmann, 2000; Cunningham and Lippmann 2000b), therefore MLP was chosen to examine network traffic data. SOM had been used to group network traffic together to present it to the neural network [20, 11, 12], as SOM have been shown to be effective in novelty detection (Ypma and Duin, 1998; Girardin and Brodbeck, 1998; Kayacik et al. , 2003).
Agarwal et al. propose a two-stage [1] general-to-specific framework for learning a rule based model to learn classifier models on a data set that has different distribution class in the training data (Agarwal and Joshi, 2000). They utilized KDD Cups database for training and testing their system. The system performed very well on detecting Probing and DOS(Denial of Service) attacks identifying 73.2% and 96.6% respectively. 6.6% of U2R (User to Root) attacks and 10.7% of R2L (Remote to Local) were detected. False alarms were generated at a level of less than 10% for all attack categories except for U2R – an unacceptably high level of 89.5% false alarm rate was reported for this category.
Levin creates a set of locally optimal decision trees (decision forest) from which optimal subset of trees (subforest) was selected for predicting new cases (Levin, 2000). 10% of KDD Cups database is used for training and testing [1, 14]. Data was randomly sampled from the entire training data set. Multi-class detection approach was used to detect different attack categories in the KDD data set. Just like Agarwal and Joshi (Agarwal and Joshi, 2000) Levin tried to classify the data into four main categories: Probing, DOS, U2R, and R2L. The final trees shows very high detection rates for all classes including the R2L in the entire training data set. In particular, 84.5% detection rate for Probing, 97.5% for DOS, 11.8% for U2R, and 7.32% for R2L. The following false alarm rates were detected for Probing, DOS, U2R and R2L attack categories respectively - 21.6%, 73.1%, 36.4%, and 1.7%.
Ertoz (Ertoz et al. , 2001) used Shared Nearest Neighbor technique (SNN) that is particularly suited for finding clusters in data of different sizes [9], density, and shapes, mainly when the data contains large amount of noise and outliers. K-Means performed very well on Probing, DOS, and R2L, detecting 91.8%, 98.75%, and 77.04% respectively. Detection rate for U2R is 5.6%. SNN performed in the following manner: 73.48% for Probing, 77.76% for DOS, 37.82% for U2R, and 68.15% for R2L. False alarms were not discussed by the author.
Yeung et al. propose a novel detection approach using non-parametric density estimation based on Parzen-window estimators with Gaussian kernels to build an intrusion detection system using normal data only. The results were very high in most cases: 99.17% detection of Probing, 96.71% of DOS, 93.57% of U2R, and 31.17% of R2L. No false alarms information was available [19]. The main advantage of this technique was its capability of classifying the attack, not just detecting it.
-
III. The Data Set
The data set for our experiments were prepared by the 1998 DARPA Intrusion evaluation program by MIT Lincoln Labs [13]. The data set has 41 attributes and 24 attack types that could be classified into four main categories:
-
• DOS: Denial – of – Service, e.g., SYN flood
-
• R2L: Unauthorized access from a remote machine, e.g., guessing password
-
• U2R: Unauthorized access to local super user(root) privileges, e.g., buffer overflow attacks;
-
• Probing: Surveillance and other probing, e.g., Port Scanning
Traffic categories
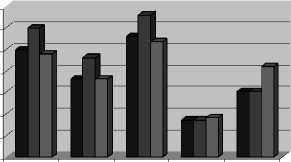
□ 10%
□ Full
□ Test normal probe DoS U2R R2L categories
Figure.1. Traffic distribution in KDD Cup 1999 Data Set
Figure 1 depicts the distribution of the full training dataset, 10% of the full training dataset and of the testing dataset. It can be noticed that the normal, probe and DoS connections keep their distribution across the three datasets while the same is not valid for U2R and R2L connections. For U2R connections a slight increase in number of instances in the test dataset versus the training dataset can be noticed. U2R instances represent 0.01% of the 10% training dataset and 0.2% of the test dataset. On the other hand, the proportion of the R2L connections dramatically increases in the test dataset (5.2%) compared to the training one (0.2%). Furthermore, the
R2L connections are spread in space posing real challenge for determining an accurate model for classification.
The data set contains six million records. Each connection is labeled as either normal or as an attack, with exactly one specific attack type. Each connection record consists of about 100 bytes. Table I shows the various attacks present in KDD 99 cup set.
TABLE I
Attacks present in the Data Set
|
Attack Class |
Attack Type |
|
Probe |
Portsweep, ipsweep, Isdomain, ntinoscan, mscan, illegal-sniffer,queso, satan |
|
DOS |
Apache2,smurf,neptune,dosnuke,land, pod,back,teardrop,tcpreset,syslogd,cra shiis,arrppoison, mailbomb, selfping, processtable,udpstrom, warezclient |
|
R2L |
Dict,netcat,sendmail,imap,ncftp,xlock, xsnoop,shtrojan,framespoof,ppmacro, guest,netbus,snmpget,ftpwrite,httptun nel, phf, named |
|
U2R |
Sechole,xterm,eject,ntfsdos,nukepw,se cret,perl,ps,yaga,fdformat,ppmacro,fff config, casesen, loadmodule,sqlattack. |
There are so many criticism against the work based on the DARPA data set. Being the only comprehensive data set that can be shared for IDS evaluation it becomes reasonable to analyze the shortcomings and also its importance and strengths for such a critical evaluation. The main criticisms against the DARPA data set are by McHugh and by Mahoney. McHugh criticizes the procedures used in building the data set and in performing the evaluation. Mahoney comments on the irregularities in the data, like the obvious difference in the (Time To Live) TTL value for the attacks as well as the normal packets, which makes even a trivial detector showing appreciable detection rate.
The general thought that even with all the criticisms, the DARPA data set is still rigorously used by the research community for the evaluation of IDS. The non availability of any other data set that includes the complete traffic was probably the initial reason to make use of the DARPA data set for evaluation by a researcher in IDS. Also the experience while trying to work with the real data traffic was not good; the main reason being the lack of the information regarding the status of the traffic. It involves high cost if an attempt is made. The research work that used the real network data was not able to report the detection rate or other evaluation metrics for a comparison purpose.
Mahoney comments that if an advanced IDS could not perform well on the DARPA data set, it could also not perform acceptably on realistic data. Hence before thinking of junking the DARPA data set, it is wise to see whether the State of the art IDS performs well, in the sense that it detects all the attacks of the DARPA data set.
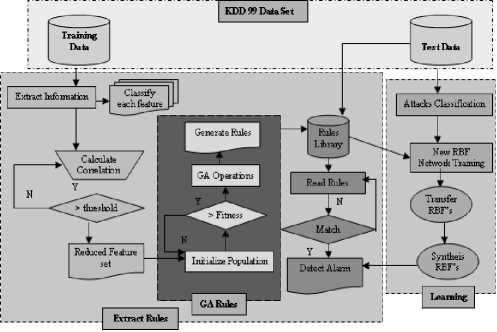
Figure.2. System Flow
-
IV. Our Methodology
Our methodology is divided in to three phases as follows. Features were reduced based on Correlation and optimized rules were developed using Genetic Algorithm and new attack patterns were detected by learning the patterns from the Neural Network Radial Basis Function Networks as shown in Figure 2.
As the first step in our work is to cope with the speed problem mentioned above, we have used the results obtained in our previous work [18] where we deployed Information Gain based Mutual Information, in order to extract the most relevant features of the data. In this way, the total amount of data to be processed is highly reduced. As an important benefit of this arises the high speed of training the system thus providing high refreshing rate of the rule set.
Subsequently, these features are used to form rules for detecting various types of intrusions using Genetic Algorithm. This permits the introduction of higher level of generality and thus to higher detection rates. The procedure starts from an initial population of randomly generated individuals. Then the population is evolved for a number of generations while gradually improving the qualities of the individuals in the sense of increasing the fitness value as the measure of quality. The final step is to train the network using Radial Basic Function Network to detect the unknown attack.
-
V. Radial Basis Function Learning Strategies
In a RBF network, different layers perform different tasks. Therefore it is useful to separate the optimization of the hidden unit and output layers of the network by using different techniques. There are different learning strategies in the design of an RBF network depending on how the centers of RBFs of the network are determined: fixed centers, selection of centers. The adjustable parameters within a radial basis function network that effect classification accuracy and that may provide information for rule extraction such as the number of basic functions used, location of the centre of the basis function, width of the basis function, and the weights connecting the hidden RBF units to the linear output units as shown in Figure 3.
We apply Gaussian function as its basis function which has a center at a data point X i and distinct speed σ i
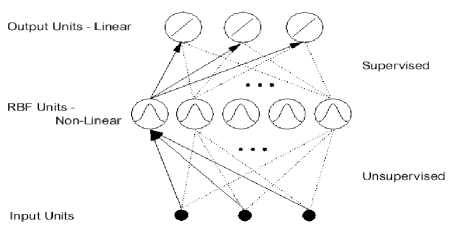
Figure 3. RBF Neural Network
φ i ( X - X i ) = exp(
X - Xi II 2
2 σ i 2
)
Two things to be viewed; First it can be seen as a technique for determining how the neural network performs any given input to output mapping. Second often this process may produce rules that are more accurate than the original rules that may no longer provide a faithful reproduction of the original operation. The local nature of each RBF hidden unit enables a simple translation into a single rule.
If feature 1 is X and Feature 2 is Y……………..If Feature n is N then attack1.
where a feature is composed of upper and lower bounds calculated by the RBF centre µ n positions, RBF width σ and feature steepness S. The values of µ and σ are determined by the RBF training algorithm.
Xlower = µi +σi -S
X =µ -σ +S upper
This has a major advantage to require nothing else that the training set to work (no step learning and threshold) or other parameters. In this RBF network, each attack is represented by a hidden neuron, and each output realizes the union of some of them in order to form the corresponding attack. This approach is considered as a fully self organized one. In-fact it determines a minimal number of local units needed to represent the whole classes known from the learning set. In the same time, it places them in such a manner that the receptive field inducted by each hidden neuron covers optimally, in some sense, the attribute space. Each of these receptive fields is controlled by a scale factor, the width σ of the neuron which is automatically adjusted according to the closest attack. So from only the learning set and after a number of iterations proportional to the number of defined neurons, the algorithm gives the size and structure of the RBF net.
Several metrics are used to evaluate and compare the performance of Intrusion Detection Systems (IDSs). The most basic metrics are the detection and false alarm rates. The detection rate is equal to the number of intrusions detected divided by the total number of intrusions in a data set, while the false alarm rate is equal to the number of normal instances detected as intrusions divided by the number of normal instances in a data set. False alarms are also referred to as false. The diagnosis rate (or recall), meaning the number of correctly classified intrusions divided by the total number of intrusions, is also a relevant metric.
-
VI. Experiments and Results
The experimental results demonstrate that the proposed approach to recognize network attacks performance especially in terms of both efficient and accuracy. Neural Network RBF is chosen by us due to their capability to recognize an attack, to differentiate one attack from another, i.e. classify attack and most important, to detect new attacks that were not included into the training set. The results obtained indicate that it is possible to recognize attacks that the intrusion detection system never faced before on an acceptably high level.
The main problem with the IDS approach that they had chosen was that they all attack in the data set, though many of those attacks did not have enough records for training. If an attack doesn’t have enough presence (IMAP attack had only 12 records), it should not be used for training. From the works specified in the review, they grouped the attacks what potentially can lead to a misdetection since not all of the attacks in the same group have identical signature and patterns.
Thus a different approach was chosen to detect and classify attack. The main advantage of this approach was data formatting which allowed us to increase the accuracy rate up to 100% in some cases and the most important advantage, to achieve a high percentage of identification of the attacks that were not included into the training set. The differences between out approach and the approach
The second important difference was the training set composition. We created training sets, trying to keep even distribution of the attacks in the set and rules formed by Genetic algorithm. Attacks with the most number of records were chosen to be in the training set. The following attacks were used to train and to test. Smurf, Satan, Neptune, IPSweep, Back. The following attacks were chosen for the unknown (not trained) set of attacks. Buffer_overflow, Guess_pswd, NMap, Teardrop, Warezclient.
We can go more into detail with the analysis of the performance of the three IDSs by comparing the output confusion matrices listed in. Rows represent the labels of the connections and columns represent the class attributed by the IDS. The last row displays the rate of true positives (e.g. 71.0% of the connections classified as normal are normal) and the last column displays the accuracy (e.g. 99.3% of normal traffic was classified as normal).
It can be seen in TABLE II that the IDS performs well on normal and DoS connections, on probe it has a rather poor performance (70.1% diagnosis) and misclassifies most of U2R (15.7% diagnosis) and R2L (2.2% diagnosis) connections. Most of the misclassified probe, U2R and R2L connections are classified as normal. The models for normal and DoS traffic are fairly accurate of other researches are summarized below. First, we have chosen a different strategy in preprocessing. Before using the data set, we made a thorough analysis of the given data. We found out that there are a lot of repeated records. It was obvious that some attacks, such as Smurf were taking more than 50% of the whole data set and some attacks have only 10 or even less records. To optimize the data set, to make it appropriate for the training and testing we wrote a methodology using correlation, that was capable of resolving mentioned above problems and to prepare the data set to use. So the data set was optimized and repeated records were removed and insignificant number of records was omitted. Features were also selected by the Correlation.
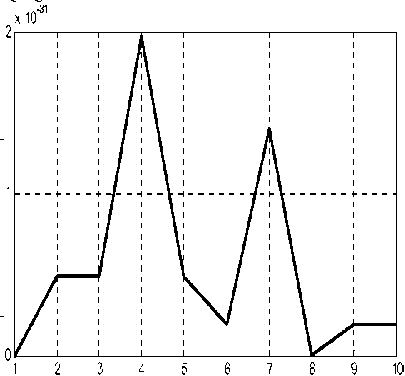
Input Patterns
Figure 4. Square Errors for Each Input Patterns since they had a large set of training instances to build on.
Figure 4 represents the values of square error values at 10 input patterns after training neural network. We see the largest value for error is 2*10^ (-31), it is very small value so this ensures the accuracy of RBF in learning this system. The elapsed learning time is 6.334682 seconds; this time is small as it has no iterations which in BP, this also ensures the speed of system under this algorithm. Number of neurons in hidden layer is smaller than in BP, this reduces the cost of system.
The lowest accuracy is 91% for Satan and the highest is 100% for Smurf and Neptune. These results helps to make a conclusion that attacks can be differentiated, thus classified. At this point we proceeded with the most interesting and exciting phase of the experiments – untrained (unknown) attack identification.
When we compared the results with the previous work, it was notable that the chosen technique had its own advantage. First of all, we managed to detect the attacks exactly. Second, classification of the trained attacks was successful with the rate of 90-100%. Third, and the most important was the inability to detect new unknown attacks which were not included into the training set. The accuracy of detecting new unknown attacks was between 80% and 100%.
TABLE II. confusion matrix
|
Predicted / Actual |
Smurf |
Ipsweep |
Nmao |
Neptune |
Land |
Teardrop |
% Correct |
|
Smurf |
72535 |
0 |
0 |
1 |
0 |
0 |
99.6 |
|
Ipsweep |
2 |
0 |
0 |
0 |
2 |
0 |
99.1 |
|
Nmap |
375 |
1 |
737 |
2 |
5 |
0 |
97.4 |
|
Neptune |
504 |
0 |
2 |
2922 |
0 |
3 |
93.2 |
|
Land |
47 |
0 |
9 |
0 |
242 |
5 |
89.4 |
|
Teardrop |
9 |
0 |
0 |
0 |
0 |
2 |
86.9 |
|
% Correct |
83.3 |
93.2 |
99.2 |
94.6 |
89.9 |
86.3 |
-
VII. Conclusion
Many modern commercially used IDS employ the techniques of expert systems which require constant updates from the vendors. This design makes the IDS static, inflexible, not capable of detecting new attacks. In the context of intrusion detection in a computer network, attacks such as R2L and U2R resulted in small number of traffic packets seem to pose a real challenge for detection and diagnosis. It is very hard to build an efficient Classifier to detect Novel attacks. Usually simplicity and speed are traded for accuracy and machine learning methods are complemented by traditional signature based methods.
After performing our experiments, we concluded that with appropriate data formatting, optimizations, data set composition, neural networks demonstrates a very good performance and potential in detecting and classifying trained attacks as well as new unknown attacks which were not included into the training set. This aspect should be further investigated in order to deploy effective IDS s based on Neural Network.
References A Frame of Intrusion Detection Learning System Utilizing Radial Basis Function
- Agarwal, R. and M. Joshi. “PNrule: A New Framework for Learning Classifier Models in Data Mining”. Technical Report TR 00-015, Department of Computer Science, University of Minnesota 2000.
- Aussem, A., et al.. “Queueing Network Modelling with Distributed Neural Networks for Service Quality Estimation in B-ISDN Networks”. Proceedings IEEE-INNS-ENNS International Joint Conference on Neural Networks, Como, Italy 2000.
- Bernhard Pfahringer, “Winning the KDD99 Classification Cup: Bagged Boosting”, ACM SIGKDD Explorations Newsletter, Volume 1, Issue 2, p. 65-66 January 2000.
- Cannady, J.. “Artificial Neural Networks for Misuse Detection”. National Information Systems Security Conference on Neural Networks, Como, Italy 1998.
- Cannady, J. and J. Mahaffey. “The application of artificial intelligence to misuse detection”. Proceedings of the 1st Recent Advances in Intrusion Detection (RAID) Conference 1997.
- Computer Security and Intrusion Detection, http://www.acm.org/crossroads/xrds11-1/csid.html
- Cunningham, R. and R. Lippmann. "Improving Intrusion Detection performance using Keyword selection and Neural Networks." Computer Networks 34(4): 597—603 2000.
- Cunningham, R. and R. Lippmann. "Detecting Computer Attackers: recognizing patterns of malicious stealthy behavior." MIT Lincoln Laboratory - Presentation to CERIAS 2000.
- Ertoz, L., et al.. “Finding Clusters of Different Sizes, Shapes, and Densities in Noisy, High Dimensional Data”. Technical Report, University of Toledo 2001.
- Fox, K., et al.. “A Neural Network Approach Towards Intrusion Detection”. Proceedings of the 13th National Computer Security Conference, Washington, D.C. 1990.
- Girardin, L. and D. Brodbeck. “A Visual Approach for Monitoring Logs”. 12th System Administration Conference (LISA ’98), Berkeley, CA. 1998.
- Kayacik, G., et al.. “On the Capability of an SOM based Intrusion Detection System”. Proceedings of the International Joint Conference on Neural Networks, 2003.
- KDD Cup 1999 Task Description, Available: http://kdd.ics.uci.edu/databases/kddcup99/task.html
- Levin, I., "KDD-99 Classifier Learning Contest LLSoft's Results Overview." SIGKDD Explorations vol. 1, 2000.
- Planquart, J., “Application of Neural Networks to Intrusion Detection” . SANS Institute, Available at: http://www.sans.org/reading_room/whitepapers/detection/336.php?, 2001.
- Rhodes, B., et al., “Multiple Self-Organizing Maps for Intrusion Detection”. National Security Systems Security Conference, Baltimore, MD. 2000.
- Sabhnani, M. and G. Serpen,. “Application of Machine Learning Algorithms to KDD Intrusion Detection Dataset within Misuse Detection Context”. Proceedings of the International Conference on Machine Learning, Models, Technologies and Applications (MLMTA 2003), Las Vegas, NV. 2003.
- Selvakani.S, Rajesh.R.S, “Improving ID performance using GA and NN”, International Journal of Computer Aided Engineering and Technology, Vol.13, N0.1/2/3, Sep 2008.
- Yeung, D. Y. and C. Chow, “Parzen-window Network Intrusion Detectors”. Sixteenth International Conference on Pattern Recognition, Quebec City, Canada, 2002.
- Ypma, A. and R. Duin, “Novelty Detection using Self-Organizing Maps”. Progress in Connectionist- Based Information Systems, Springer. 1998.
