A Framework for Software Defect Prediction Using Feature Selection and Ensemble Learning Techniques

Author: Faseeha Matloob, Shabib Aftab, Ahmed Iqbal
Journal: International Journal of Modern Education and Computer Science @ijmecs
Article in issue: 12 vol.11, 2019.
Free access
Testing is one of the crucial activities of software development life cycle which ensures the delivery of high quality product. As software testing consumes significant amount of resources so, if, instead of all software modules, only those are thoroughly tested which are likely to be defective then a high quality software can be delivered at lower cost. Software defect prediction, which has now become an essential part of software testing, can achieve this goal. This research presents a framework for software defect prediction by using feature selection and ensemble learning techniques. The framework consists of four stages: 1) Dataset Selection, 2) Pre Processing, 3) Classification, and 4) Reflection of Results. The framework is implemented on six publically available Cleaned NASA MDP datasets and performance is reflected by using various measures including: F-measure, Accuracy, MCC and ROC. First the performance of all search methods within the framework on each dataset is compared with each other and the method with highest score in each performance measure is identified. Secondly, the results of proposed framework with all search methods are compared with the results of 10 well-known supervised classification techniques. The results reflect that the proposed framework outperformed all of other classification techniques.
Feature Selection, Ensemble Classifier, Hybrid Classifier, Machine Learning Techniques, Software Defect Prediction
Short address: https://sciup.org/15017149
IDR: 15017149 | DOI: 10.5815/ijmecs.2019.12.02
Text of the scientific article A Framework for Software Defect Prediction Using Feature Selection and Ensemble Learning Techniques
Published Online December 2019 in MECS DOI: 10.5815/ijmecs.2019.12.02
Today, we are living in modern digital era where we need the software applications for most of our day to day and business activities. This shift did not occur within a day or week, instead the process started more than two decades before. The reliability of software applications is directly proportional to the quality of software, higher the quality, more reliable the softwares are. High quality softwares at lower cost has always been the main concern of customers and developers however defects are inevitable due to the large size and high complexity in required applications [11,12], [17,18,19]. Software testing is considered as one of the crucial activities of software development life cycle which ensures the delivery of high quality software [29]. It has also been reported that software testing consumes high amount of resources in development life cycle, therefore an effective and efficient mechanism is required to locate and fix the defects with lower cost. Software Defect Prediction (SDP) is an effective way to resolve this issue which ensures the high quality of software with limited amount of resources [11,12], [17,18], [20], [29]. With this approach the software modules which are predicted as defective can be tested thoroughly as compared to those modules which are predicted as non-defective [11,12], [29]. Machine learning techniques have been widely used for software defect prediction since last two decades. These techniques are categorized as 1) Supervised, 2)
Unsupervised, and 3) Hybrid [1,2]. In supervised learning, the classes are known in advance. These learning techniques need the pre-classified data (training data) for training, during which classification rules are made and then these rules are used to classify the unseen data (test data). In unsupervised learning, classes are not-known, these techniques use particular algorithms to explore and identify the structure of data. The hybrid learning or semi supervised learning approach integrates the both: supervised and unsupervised techniques. The objective of this research is to contribute to improve the prediction of defect prone software modules. For this purpose, a framework is presented for software defect prediction by using the feature selection and ensemble learning techniques. The proposed framework consists of four stages: 1) Dataset Selection, 2) Data Preprocessing, 3) Classification, and 4) Reflection of Results. Six publically available NASA MDP Datasets are used for the implementation of proposed framework. Pre processing stage of the proposed framework consists of three activities: Normalization, Feature Selection and Class Balancing. All of these activities aim to improve the structure of data so that higher results can be achieved from classification process. Classification stage uses ‘Stacking’ technique to implement the ensemble learning. Performance of the proposed framework is analyzed by using various measures including: F-measure, Accuracy, MCC and ROC. The results of the proposed framework are evaluated in two ways: first, the performance of search methods on each dataset is evaluated within the framework by comparing with each other in all accuracy measures. Secondly, all the results of proposed framework (including all search methods) are compared with the results of 10 widely used base classifiers from a published research. The classifiers include: “Naïve Bayes (NB), Multi-Layer Perceptron (MLP), Radial Basis Function (RBF), Support Vector Machine (SVM), K Nearest Neighbor (KNN), kStar (K*), One Rule (OneR), PART, Decision Tree (DT), and Random Forest (RF)”. It is observed that the proposed framework performed well as compared to all of the base classifiers.
-
II. Related Work
Many researchers have used machine learning techniques to solve the binary classification problems such as Sentiment Analysis [1,2,3,4,5,6], Rainfall Prediction [7,8], Network Intrusion Detection [9,10], and Software Defect Prediction [11,12,13,14,15,16]. Some of the studies related to software defect prediction are discussed here. Researchers in [11] performed a performance analysis by using various machine learning techniques on software defect prediction. The experiment is performed on twelve cleaned NASA datasets. The classification techniques include: “Naïve Bayes (NB), Multi-Layer Perceptron (MLP). Radial Basis Function (RBF), Support Vector Machine (SVM), K Nearest Neighbor (KNN), kStar (K*), One Rule (OneR), PART, Decision Tree (DT), and Random Forest (RF)”. The performance is analyzed by using Precision, Recall, F-Measure, Accuracy, MCC, and ROC Area. Researchers in [12] proposed a feature selection based ensemble classification framework. The framework is implemented in two dimensions, one with feature selection and second without feature selection. The performance is analyzed by using Precision, Recall, F-measure, Accuracy, MCC and ROC. For experiment, 12 cleaned publically available NASA datasets are used. The results of proposed framework are compared with other widely used classification techniques including: “Naïve Bayes (NB), Multi-Layer Perceptron (MLP), Radial Basis Function (RBF), Support Vector Machine (SVM), K Nearest Neighbor (KNN), kStar (K*), One Rule (OneR), PART, Decision Tree (DT), and Random Forest (RF)”. The framework outperformed other classification techniques in some of the datasets however it also has been noted that the class imbalance issue could not be fully resolved. In [13], the researchers used six classification techniques to predict the software defects. The classifications techniques include: Discriminant Analysis, Principal Component Analysis (PCA), Logistic Regression (LR), Logical Classification, Holographic Networks, and Layered Neural Networks. Back-propagation technique was used in ANN for training. Performance was evaluated by various measures including: Verification Cost, Predictive Validity, Achieved Quality and Misclassification Rate. The results reflected that, no classification technique performed 100 % accurately (without the error). In [14], the researchers used SVM to predict the software bugs in NASA datasets. The datasets include: PC1, CM1, KC1 and KC3. The performance of SVM is compared with other techniques such as: Logistic Regression (LR), K-Nearest Neighbors (KNN), Decision Trees, Multilayer Perceptron (MLP), Bayesian Belief Networks (BBN), Radial Basis Function (RBF), Random Forest (RF), and Naïve Bayes, (NB). The results reflected that SVM out performed some of the others classification techniques. In [15], the researchers discussed about the significance of metric selection for software bug prediction. They discussed that some metrics are more important than others while predicting the software defects. They used ANN model to identify the significant metrics. The selected metrics were then used by the researchers to predict the software defects through another ANN model. Performance of the proposed method was compared with Gaussian kernel SVM and JM1 dataset from NASA MDP repository was used for experiment. The results reflected that SVM performed better than ANN in binary defect classification. In [16], the researchers presented an integrated method which consists of Hybrid Genetic algorithm and Deep Neural Network. The Hybrid Genetic algorithm selects the optimum features and Deep Neural Network performs the prediction by classifying the modules as defective and non-defective. The experiments were performed on various datasets from PROMISE repository. The results reflected that the proposed approach showed higher performance as compared to other techniques.
-
III. Materials and Methods
This paper presents a feature selection based ensemble classification framework (Fig. 1) for software defect prediction. The framework consists of four stages: 1) Dataset selection, 2) Data Preprocessing, 3) Classification, and 4) Results. The proposed framework is implemented in WEKA as it is one of the widely used data mining tools.
To analyze the performance of proposed framework, six benchmark cleaned NASA MDP datasets are used including KC1, KC3, MC2, MW1, PC4 and PC5 (Table 1). These datasets reflect the historical data of NASA software systems. Each dataset consists of several features (one dependent feature and many independent feature). The independent features in each dataset are shown in Table 2. The dependent feature is the one which is going to be predicted on the basis of independent features. Dependent feature/attribute is also known as target class and consists of one value from two of the following: ‘Y’ or ‘N’. ‘Y’ reflects that the particular instance (software module) is defective and ‘N’ reflects that it is non-defective. Two cleaned version of NASA datasets are provided by [22]. DS’ and DS’’. DS’ version includes duplicate and inconsistent instances whereas DS’’ does not include duplicate and inconsistent instances. We have used D’’ version, taken from [23].
This cleaned version is already used by [11,12], [24,25, 26].
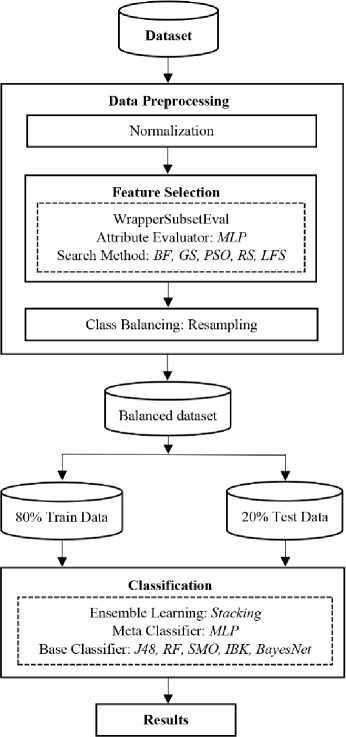
Fig. 1. Proposed Framework
Table 1. Nasa Cleaned Dataset D’’ [22]
|
Datasets |
Attributes |
Modules |
Defective |
NonDefective |
Defective (%) |
|
KC1 |
22 |
1162 |
294 |
868 |
25.3 |
|
KC3 |
40 |
194 |
36 |
158 |
18.5 |
|
MC2 |
40 |
124 |
44 |
80 |
35.4 |
|
MW1 |
38 |
250 |
25 |
225 |
10 |
|
PC4 |
38 |
1270 |
176 |
1094 |
13.8 |
|
PC5 |
39 |
1694 |
458 |
1236 |
27.0 |
Table 2. Features of D’’ Datasets
|
N O |
Attributes |
KC1 |
KC3 |
MC2 |
MW1 |
PC4 |
PC5 |
|
1. |
LOC_BLANK |
v |
V |
V |
V |
V |
V |
|
2. |
BRANCH_CO UNT |
v |
V |
V |
V |
V |
V |
|
3. |
CALL_PAIRS |
V |
V |
V |
V |
V |
|
|
4. |
LOC_CODE_ AND_COMM ENT |
V |
V |
V |
V |
V |
V |
|
5. |
LOC_COMM ENTS |
V |
V |
V |
V |
V |
V |
|
6. |
CONDITION_ COUNT |
V |
V |
V |
V |
V |
|
|
7. |
CYCLOMATI C_COMPLEX ITY |
V |
V |
V |
V |
V |
V |
|
8. |
CYCLOMATI C_DENSITY |
V |
V |
V |
V |
V |
|
9. |
DECISION_C OUNT |
V |
V |
V |
V |
V |
|
|
10. |
DECISION_D ENSITY |
V |
V |
V |
V |
||
|
11. |
DESIGN_CO MPLEXITY |
V |
V |
V |
V |
V |
V |
|
12. |
DESIGN_DE NSITY |
V |
V |
V |
V |
V |
|
|
13. |
EDGE_COUN T |
V |
V |
V |
V |
V |
|
|
14. |
ESSENTIAL_ COMPLEXIT Y |
V |
V |
V |
V |
V |
V |
|
15. |
ESSENTIAL_ DENSITY |
V |
V |
V |
V |
V |
|
|
16. |
LOC_EXECU TABLE |
V |
V |
V |
V |
V |
V |
|
17. |
PARAMETER _COUNT |
V |
V |
V |
V |
V |
|
|
18. |
GLOBAL_DA TA_COMPLE XITY |
V |
V |
V |
|||
|
19. |
GLOBAL_DA TA_DENSITY |
V |
V |
V |
|||
|
20. |
HALSTEAD_ CONTENT |
V |
V |
V |
V |
V |
V |
|
21. |
HALSTEAD_ DIFFICULTY |
V |
V |
V |
V |
V |
V |
|
22. |
HALSTEAD_ EFFORT |
V |
V |
V |
V |
V |
V |
|
23. |
HALSTEAD_ ERROR_EST |
V |
V |
V |
V |
V |
V |
|
24. |
HALSTEAD_ LENGTH |
V |
V |
V |
V |
V |
V |
|
25. |
HALSTEAD_ LEVEL |
V |
V |
V |
V |
V |
V |
|
26. |
HALSTEAD_ PROG_TIME |
V |
V |
V |
V |
V |
V |
|
27. |
HALSTEAD_ VOLUME |
V |
V |
V |
V |
V |
V |
|
28. |
MAINTENAN CE_SEVERIT Y |
V |
V |
V |
V |
V |
|
|
29. |
MODIFIED_C ONDITION_C OUNT |
V |
V |
V |
V |
V |
|
|
30. |
MULTIPLE_C ONDITION_C OUNT |
V |
V |
V |
V |
V |
|
|
31. |
NODE_COUN T |
V |
V |
V |
V |
V |
|
|
32. |
NORMALIZE D_CYLOMA TIC_COMPL EXITY |
V |
V |
V |
V |
V |
|
|
33. |
NUM_OPERA NDS |
V |
V |
V |
V |
V |
V |
|
34. |
NUM_OPERA TORS |
V |
V |
V |
V |
V |
V |
|
35. |
NUM_UNIQU E_OPERAND S |
V |
V |
V |
V |
V |
V |
|
36. |
NUM_UNIQU E_OPERATO RS |
V |
V |
V |
V |
V |
V |
|
37. |
NUMBER_OF _LINES |
V |
V |
V |
V |
V |
|
|
38. |
PERCENT_C OMMENTS |
V |
V |
V |
V |
V |
|
|
39. |
LOC_TOTAL |
V |
V |
V |
V |
V |
V |
Pre-processing is the second stage of proposed framework and further consists of three activities, 1) Normalization, 2) Feature Selection, and 3) Class Balancing. The process of normalization aims to bring the values of complete dataset into the range of 0 to 1 for effective classification results. For feature selection, we used the wrapper approach with Artificial Neural Network (MLP) as feature subset evaluator and for training, full datasets are used. Six search methods are used including: Best First (BF), Greedy Stepwise (GS), Genetic Algorithm/Search (GA), Particle Swarm Optimization (PSO), Rank Search (RS) and Linear Forward Selection (LFS). For each of the used dataset, we got 6 subsets except the case with MW1 with GS which did not generate any subset (Table 3). To handle the class imbalance issue [27,28] resampling is performed on all the datasets by using the ‘Resample package’ provided by Weka. We have chosen the resampling with replacement technique in which a random subsample of dataset is produced where each instance in dataset has equal chance of being selected and an instance can be selected multiple times. This is basically an oversampling technique for minority class. However, in Weka implementation, it samples majority class as well.
the parameters of confusion matrix (Fig. 2).which are given below [11,12],[29]:
СЛ
Actual Values Defective (Y) Non-defective (N) Defective (Y) Non-defective (N)
TP
FP
FN
TN
Fig. 2. Confusion Matrix. Table 3. Feature Subsets
FS
KC1
KC3
MC2
MW1
PC4
PC5
BF
1,4,5,2
2,24,3 6
4,5,7
9,21,38
3,6,28, 30,32
2,3,4,5,9,
10,16,
23,25,27, 35,37
2,4,7,8,9,14 ,17,18,29, 30, 32, 36
GS
1,4,16, 36
4,5,7
21
No
Subset
3,4,10,34, 37
7,18,36
GA
1,4,5,1
6,21,2
6,35,3
6,39
4,15, 16,25 ,34,3 9
1,11,18, 19,20,2
4,26,27, 33,34
13,23,2
5,27,30 ,33,39
1,3,4,5,10 ,11,
16,20,21, 22,24,
27,28,29, 30, 32, 34
3,4,9,11,14, 19,20,31,34 ,35
PSO
1,2,4,7 ,14,16, 21,22, 27,33, 35,39
4,21
9,20,21, 24,38
2,6,14, 16,22,2 5,27,30 ,31
2,4,10,14,
16,27,30,
34,37,39
3,4,13,14
RS
2,7,11,
20,21,
22,23,
24,25,
26,27,
33,34,
35, 39
2,4
1,2,6,7, 13,14,1 5,18,21, 22,25,2 6,29,30, 31
1,2,6,7, 9,11,13 ,16,23, 24,27,2 9,30,31 ,33,34, 35,37,3 9
1,4,5,6,8, 9,10,14,1 6,29,30,3 2,37,38,3 9
2,6,7,9,11,1 3,14,16,21, 22,23,24,25 ,26,27,29,3 0,31,33,34, 36,37,38,39
LFS
1,4,5,2
2,24,3 6
4,5,1 4
9,21,38
1,17,21 ,26,31
3,4,5,10,2
3,25,27,3 7
2,4,7,8,9,14 ,17,18,29,3 0,32,36
True Positive (TP): “Instances which are actually positive and also classified as positive”. False Positive (FP): “Instances which are actually negative but classified as positive”. False Negative (FN): “Instances which are actually positive but classified as negative”. True Negative (TN): “Instances which are actually negative and also classified as negative”. To calculate the F-measure, we have to calculate the Precision and Recall first as F-measure is the average of these two measures. The calculation formula of each of the used measure is given below: TP
Precision
=---------
(
TP
+
FP
)
Re
call
=
TP (TP + FN) Precision * Recall * 2 F -measure =------------------- (Precision + Recall) Accuracy = TP + TN
TP
+
TN
+
FP
+
FN
For classification, we have used a well-known ensemble learning technique, “Stacking”, along with MLP as Meta classifier. Moreover the base classifiers include: 1) Decision Tree (DT), 2) Random Forest (RF), 3) Support Vector Machine (SVM), 4) K Nearest Neighbor (kNN) and 5) Bayes Net (BN). Parameter tuning is also performed using trial and error approach. For MLP, we used the learning rate of 0.1, momentum 0.9 and epochs 1000. For DT, confidence factor is set to 0.1. For SVM, the RBF kernel is used along with Gamma equal to 10. Default parameters are used for the rest of properties. Moreover, 80 % data is used for training purpose and remaining 20 % is used for testing. IV. Results and Discussion The results of proposed framework are evaluated by using various measures such as: F-measure, Accuracy, MCC and ROC. These measures are calculated by using
AUC
=
1
+
TPr
-
FPr
MCC
=
________
TN
*
TP
-
FN
*
FP
________ 4
(
FP
+
TP
)(
FN
+
TP
)(
TN
+
FP
)(
TN
+
FN
)
The proposed framework is implemented on six cleaned NASA MDP Datasets (D’’) by using six widely used search methods along with MLP as feature subset evaluator. The search methods include: Best First (BF), Greedy Stepwise (GS), Genetic Algorithm/Search (GA), Particle Swarm Optimization (PSO), Rank Search (RS) and Linear Forward Selection (LFS). The obtained results are discussed in the tables from Table 4 to Table 9. Performance measures including: F-measure, Accuracy, MCC and ROC for the defective class (‘Y’) with each search method are discussed in these tables. Highest scores are highlighted in bold for easy identification. Table 4. KC1 Results
Search Method
F-Measure
MCC
ROC
Accuracy
BF
0.617
0.578
0.882
86.6379
GS
0.614
0.54
0.784
85.3448
GA
0.72
0.644
0.83
87.931
PSO
0.702
0.61
0.862
85.3448
RS
0.645
0.564
0.853
85.7759
LFS
0.617
0.578
0.882
86.6379
Results of KC1 datasets are shown in Table 4. It can be seen that, in F-Measure, MCC, and Accuracy: GA performed better whereas in ROC, BF and LFS both performed better. Table 5. KC3 Results
Search Method
F-Measure
MCC
ROC
Accuracy
BF
0.4
0.312
0.876
84.6154
GS
0.4
0.312
0.876
84.6154
GA
0.727
0.687
0.941
92.3077
PSO
0.5
0.465
0.832
89.7436
RS
0.316
0.193
0.638
66.6667
LFS
0.5
0.465
0.776
89.7436
The results of KC3 dataset is reflected in Table 5. The results shows that GA performed better in all the measures. Table 6. MC2 Results
Search Method
F-Measure
MCC
ROC
Accuracy
BF
0.762
0.59
0.773
80
GS
0.7
0.5
0.65
76
GA
0.667
0.61
0.763
80
PSO
0.842
0.75
0.84
88
RS
0.889
0.84
0.88
92
LFS
0.762
0.59
0.773
80
Table 6 reflects the results of MC2 datasets. It can be seen that RS performed better in all of the performance measures. Table 7. MW1 Results
Search
Method
F-Measure
MCC
ROC
Accuracy
BF
0.667
0.645
0.688
96
GS
-
-
-
-
GA
0.5
0.477
0.957
92
PSO
0.571
0.546
0.652
94
RS
0.667
0.645
0.965
96
LFS
0.667
0.645
0.716
96
The results of MW1 dataset is shown in Table 7. It can be seen that RS outperformed in all four measures whereas BF and LFS performed better in F-measure, MCC and Accuracy. Moreover, no result was mentioned with GS as subset no was generated from this combination. Table 8. PC4 Results
Search
Method
F-Measure
MCC
ROC
Accuracy
BF
0.702
0.671
0.955
93.3071
GS
0.8
0.79
0.937
95.6693
GA
0.793
0.772
0.97
95.2756
PSO
0.588
0.569
0.933
91.7323
RS
0.71
0.67
0.934
92.9134
LFS
0.774
0.743
0.937
94.4882
Table 8 shows the results of PC4 datasets. It can be seen that GS outperformed in three measures: F-measure, MCC and Accuracy whereas GA performed better in ROC. Table 9. 1PC5 Results
Search
Method
F-Measure
MCC
ROC
Accuracy
BF
0.76
0.674
0.922
87.3156
GS
0.698
0.602
0.827
84.9558
GA
0.811
0.747
0.913
90.2655
PSO
0.709
0.608
0.863
84.9558
RS
0.778
0.698
0.936
88.2006
LFS
0.76
0.674
0.922
87.3156
Results of PC5 dataset is shown in Table 9 which reflect that GA performed better in terms of F-measure, MCC and Accuracy whereas RS outperformed other search methods in ROC. In this study, the results of proposed framework (including all search methods) in each dataset are compared with the results of a published paper [11], in which many machine learning techniques are used for software defect prediction on NASA MDP cleaned datasets (D’’). The used machine learning techniques include: Naïve Bayes (NB), Multi-Layer Perceptron (MLP). Radial Basis Function (RBF), Support Vector Machine (SVM), K Nearest Neighbor (KNN), kStar (K*), One Rule (OneR), PART, Decision Tree (DT), and Random Forest (RF). Table 10 presents the highest scores of base classifiers from [11] on the same datasets which are used in this research. The name of the base classifier is also mentioned along with the score. Table 10. Performance of Base Classifiers [11]
P-Measure
KC1
KC3
MC2
MW1
PC4
PC5
F-measure
0.454 (RF)
0.421 (NB)
0.667 (PART)
0.632 (MLP)
0.583 (DT)
0.531 (DT)
MCC
0.347 (RBF)
0.309 (NB)
0.444 (NB)
0.589 (MLP)
0.516 (RF)
0.361 (DT)
ROC
0.751 (RF)
0.807 (RF)
0.795 (NB)
0.843 (MLP)
0.945 (RF)
0.805 (RF)
Accuracy
78.796 6 (RBF)
82.758 6 (MLP, SVM, OneR)
78.3784
(PART)
90.666 7 (MLP)
90.2887 (RF)
75.9843 (RF)
While comparing the results of proposed framework on KC1 Dataset (Table 4) with the highest scores of base classifiers (Table 10) it has been observed that all of the used research methods in proposed framework outperformed the highest scores of base classifiers. As the Table 10 reflects only the highest scores from 10 base classifiers so obviously the proposed framework outperformed all of them (on KC1 dataset). After comparing the results of KC3 dataset (Table 5) with Table [10], it can be seen that the proposed framework with GA, PSO, and LFS outperformed in F-Measure however in MCC, and Accuracy all search methods performed well except RS. In ROC, except RS and LF remaining four methods performed well. While comparing the results of MC2 datasets from Table 6 with Table 10, it can be seen that the proposed framework with all search methods outperformed in F-Measure except GA which showed equal score to the PART (Table 10). In MCC, all the search methods performed well however, In ROC, PSO and RS performed well and finally in Accuracy, Except GS, all search methods performed well. When the results of MW1 dataset (Table 7) are compared with Table 10, it is observed that the proposed framework with BF, RS, and LFS performed better in F-Measure and MCC, Moreover, only RS and GA performed better in ROC whereas all search methods performed better in Accuracy. PC4 results are shown in Table 8, which reflect that in comparison of Table 10, the proposed framework performed well with all search methods in F-Measure, MCC and Accuracy However, in ROC, BF and GA performed better. The results of PC5 dataset are shown in Table 9. It can be seen that proposed framework outperformed with all search methods when compared with highest scores of base classifiers (Table 10). It has been observed from the results of Table 4 to Table 9 that the overall performance of proposed framework with either one or more than one search methods is much better than the base classifiers. Moreover not a single search method outperformed the base classifiers in all datasets, furthermore the correlation among the used accuracy measures also need to be explored as most of the methods performed in one or two measures and in remaining measures other methods performed well. V. Conclusion Software defect prediction is considered as one of the widely focused research areas since the last two decades due to its promise to provide a high quality software at lower cost. This paper presented a feature selection based ensemble classification framework for effective software defect prediction. The framework consists of four stages: including: 1) Dataset Selection, 2) Pre Processing, 3) Classification, and 4) Reflection of Results. Preprocessing stage further consists of three important activities including: Normalization, Feature Selection and Class Balancing. For feature selection, Wrapper approach is used in which MLP is selected as Feature Subset Evaluator along with six search methods including: BF, GS, GA, PSO, RS and LFS. The proposed framework is implemented on six Cleaned NASA MDP datasets and the performance is analyzed in terms of F-measure, Accuracy, MCC and ROC. Performance evaluation is performed in two dimensions: at first, the scores of all search methods within the framework are compared with each other and secondly, the results of proposed framework with all search methods are compared with the results of 10 well-known machine learning classifiers from a published paper. The results reflected the higher performance of proposed framework as compared to all classifiers. As not a single search method outperformed the base classifiers in all datasets so it is suggested for future that for feature selection a hybrid approach should be used or developed which can improve the accuracy.
References A Framework for Software Defect Prediction Using Feature Selection and Ensemble Learning Techniques
- M. Ahmad, S. Aftab, I. Ali, and N. Hameed, “Hybrid Tools and Techniques for Sentiment Analysis: A Review,” Int. J. Multidiscip. Sci. Eng., vol. 8, no. 3, 2017.
- M. Ahmad, S. Aftab, S. S. Muhammad, and S. Ahmad, “Machine Learning Techniques for Sentiment Analysis: A Review,” Int. J. Multidiscip. Sci. Eng., vol. 8, no. 3, p. 27, 2017.
- M. Ahmad and S. Aftab, “Analyzing the Performance of SVM for Polarity Detection with Different Datasets,” Int. J. Mod. Educ. Comput. Sci., vol. 9, no. 10, pp. 29–36, 2017.
- M. Ahmad, S. Aftab, and I. Ali, “Sentiment Analysis of Tweets using SVM,” Int. J. Comput. Appl., vol. 177, no. 5, pp. 25–29, 2017.
- M. Ahmad, S. Aftab, M. S. Bashir, and N. Hameed, “Sentiment Analysis using SVM: A Systematic Literature Review,” Int. J. Adv. Comput. Sci. Appl., vol. 9, no. 2, 2018.
- M. Ahmad, S. Aftab, M. S. Bashir, N. Hameed, I. Ali, and Z. Nawaz, “SVM Optimization for Sentiment Analysis,” Int. J. Adv. Comput. Sci. Appl., vol. 9, no. 4, 2018.
- S. Aftab, M. Ahmad, N. Hameed, M. S. Bashir, I. Ali, and Z. Nawaz, “Rainfall Prediction in Lahore City using Data Mining Techniques,” Int. J. Adv. Comput. Sci. Appl., vol. 9, no. 4, 2018.
- S. Aftab, M. Ahmad, N. Hameed, M. S. Bashir, I. Ali, and Z. Nawaz, “Rainfall Prediction using Data Mining Techniques: A Systematic Literature Review,” Int. J. Adv. Comput. Sci. Appl., vol. 9, no. 5, 2018.
- A. Iqbal and S. Aftab, “A Feed-Forward and Pattern Recognition ANN Model for Network Intrusion Detection,” Int. J. Comput. Netw. Inf. Secur., vol. 11, no. 4, pp. 19–25, 2019.
- A. Iqbal, S. Aftab, I. Ullah, M. A. Saeed, and A. Husen, “A Classification Framework to Detect DoS Attacks,” Int. J. Comput. Netw. Inf. Secur., vol. 11, no. 9, pp. 40-47, 2019.
- A. Iqbal, S. Aftab, U. Ali, Z. Nawaz, L. Sana, M. Ahmad, and A. Husen “Performance Analysis of Machine Learning Techniques on Software Defect Prediction using NASA Datasets,” Int. J. Adv. Comput. Sci. Appl., vol. 10, no. 5, 2019.
- A. Iqbal, S. Aftab, I. Ullah, M. S. Bashir, and M. A. Saeed, “A Feature Selection based Ensemble Classification Framework for Software Defect Prediction,” Int. J. Mod. Educ. Comput. Sci., vol. 11, no. 9, pp. 54-64, 2019.
- F. Lanubile, A. Lonigro, and G. Visaggio, “Comparing Models for Identifying Fault-Prone Software Components,” Proc. Seventh Int’l Conf. Software Eng. and Knowledge Eng., pp. 312–319, June 1995.
- K. O. Elish and M. O. Elish, “Predicting defect-prone software modules using support vector machines,” J. Syst. Softw., vol. 81, no. 5, pp. 649–660, 2008.
- I. Gondra, “Applying machine learning to software fault-proneness prediction,” J. Syst. Softw., vol. 81, no. 2, pp. 186–195, 2008.
- C. Manjula and L. Florence, “Deep neural network based hybrid approach for software defect prediction using software metrics,” Cluster Comput., pp. 1–17, 2018.
- S. Huda, S. Alyahya, M. M. Ali, S. Ahmad, J. Abawajy, J. Al-Dossari, and J. Yearwood, “A Framework for Software Defect Prediction and Metric Selection,” IEEE Access, vol. 6, pp. 2844–2858, 2018.
- E. Erturk and E. Akcapinar, “A comparison of some soft computing methods for software fault prediction,” Expert Syst. Appl., vol. 42, no. 4, pp. 1872–1879, 2015.
- J. C. Riquelme, R. Ruiz, D. Rodr´ıguez, and J. Moreno, “Finding defective modules from highly unbalanced datasets,” Actas de los Talleres de las Jornadas de Ingenier´ıa del Software y Bases de Datos, vol. 2, no. 1, pp. 67–74, 2008.
- Y. Ma, G. Luo, X. Zeng, and A. Chen, “Transfer learning for crosscompany software defect prediction,” Information and Software Technology, vol. 54, no. 3, pp. 248–256, 2012.
- I.H. Witten and E. Frank, Data Mining: Practical Machine Learning Tools and Techniques, second ed. Morgan Kaufmann, 2005.
- M. Shepperd, Q. Song, Z. Sun and C. Mair, “Data Quality: Some Comments on the NASA Software Defect Datasets,” IEEE Trans. Softw. Eng., vol. 39, pp. 1208–1215, 2013.
- “NASA Defect Dataset.” [Online]. Available: https://github.com/klainfo/NASADefectDataset. [Accessed: 28-September-2019].
- B. Ghotra, S. McIntosh, and A. E. Hassan, “Revisiting the impact of classification techniques on the performance of defect prediction models,” Proc. - Int. Conf. Softw. Eng., vol. 1, pp. 789–800, 2015.
- G. Czibula, Z. Marian, and I. G. Czibula, “Software defect prediction using relational association rule mining,” Inf. Sci. (Ny)., vol. 264, pp. 260–278, 2014.
- D. Rodriguez, I. Herraiz, R. Harrison, J. Dolado, and J. C. Riquelme, “Preliminary comparison of techniques for dealing with imbalance in software defect prediction,” in Proceedings of the 18th International Conference on Evaluation and Assessment in Software Engineering. ACM, p. 43, 2014.
- U. R. Salunkhe and S. N. Mali, “A hybrid approach for class imbalance problem in customer churn prediction: A novel extension to under-sampling,” Int. J. Intell. Syst. Appl., vol. 10, no. 5, pp. 71–81, 2018.
- N. F. Hordri, S. S. Yuhaniz, N. F. M. Azmi, and S. M. Shamsuddin, “Handling class imbalance in credit card fraud using resampling methods,” Int. J. Adv. Comput. Sci. Appl., vol. 9, no. 11, pp. 390–396, 2018.
- A. Iqbal, S. Aftab, and F. Matloob, “Performance Analysis of Resampling Techniques on Class Imbalance Issue in Software Defect Prediction,” Int. J. Inf. Technol. Comput. Sci., vol. 11, no. 11, pp. 44-54, 2019.
