A machine learning based approach for mapping personality traits and perceived stress scale of undergraduate students

Author: Ahmed A. Marouf, Adnan F. Ashrafi, Tanveer Ahmed, Tarikuzzaman Emon
Journal: International Journal of Modern Education and Computer Science @ijmecs
Article in issue: 8 vol.11, 2019.
Free access
This paper focuses on the personality traits of students and stress scale they had to face in undergraduate level. With the advancement of computer science and machine learning based applications, we have tried to inter-correlate the terms. In the area of computational psychology, it is important to understand participants’ psychological behavior using personality traits and predict how he/she is going to react on a certain level of the stressed situation. For the experiment, we have collected data of around 150 participants. The personality traits data are collected using the standard survey named The Big Five Personality Test created by IPIP organization and stress scale measurements are collected using scale devised by Sheldon Cohen named as Perceived Stress Scale hosted by Mind garden. The data are taken from Bangladeshi computer science undergraduate students and kept anonymous. In this paper, we have applied nine different machine learning based classification models are built for mapping the traits with stress scales. For performance evaluation, we have utilized precision, recall, f1-score, and accuracy. From the experimental findings, we found that Sequential Minimal Optimization (SMO) and k-NN classifier gives the highest prediction accuracy which is approximately 70%.
Big Five Personality Traits, Perceived Stress Scale (PSS), Machine learning Approach, Data mining, Sequential Minimal Optimization (SMO)
Short address: https://sciup.org/15016872
IDR: 15016872 | DOI: 10.5815/ijmecs.2019.08.05
Text of the scientific article A machine learning based approach for mapping personality traits and perceived stress scale of undergraduate students
Published Online August 2019 in MECS DOI: 10.5815/ijmecs.2019.08.05
Understanding human psychology is considered to be one of the internal or back-end features of modern computer applications. Nowadays, predicting the individuals personality traits are considerable feature in many applications such as personalized e-commerce sites, personalized mobile applications. These types of personalization system are performed based on some of the personal attributes given by users’ such as demographic attributes (gender, age, previously made choices etc.). Therefore, understanding the personality computationally and incorporating it with the system may give higher user-friendliness to users’. In the context of educational data mining and computational psychology, it is evident that understanding the personality traits earlier may give benefits to predict the future behavioral actions of particular participant.
The personality of a human cannot be declared without any proper justification or experimentation. According to the Big Five Personality Traits [1], there are five traits to identify the overall personality of any individuals named Openness-to-experience, Extraversion, Agreeableness, Neuroticism and Conscientiousness. Predicting each of the traits separately may lead towards the overall prediction of personality. Using IPIP [1] questionnaire, the insights of each traits could be understood. And, perceived stress scale [2, 3] measurement is based on the different types of stress people usually feel. The different stress level namely low, moderate and high perceived stress is determined using the survey. The survey questions are based on the last month’s perceived stresses in different category such as personal, social, family and professional.
The motivation of this paper is to find the correlation between the undergraduate students’ personality and their perceived stress scale during the undergraduate semester cycles. It is to be mentioned that the undergraduate students of private universities of Bangladesh usually have four months semester and each semester contains the midterm and final exam along with the class tests and assignment submissions. Therefore, a regular student have to be quite active and educational stress happens as well as personal life stress includes. How can we predict that a particular students may fail in any course or may not perform well in any course? To find the answer of this question, we have investigated the personal or non- educational life stress scale of each individuals in this paper. The prediction system may predict which types of students are tend to do better and which are tend to perform poor in their upcoming activities.
In this paper, we have utilized the machine learning algorithms to map the general personality traits and perceived stress scale of undergraduate students. We have considered the most popular survey forms for collecting both the personality traits and stress scales. For experiments, we have utilized the existing machine learning techniques such as data sampling, classification algorithms. Among the various classification methods we have applied Naïve Bayes (NB), Decision Tree (DT), Simple Logistic Regression (SLR), Random Forest (RF), Linear Discriminant Analysis (LDA), Bagging (BA), Multilayer Perceptron (MLP), Sequential Minimal Optimization (SMO) and k-Nearest Neighbor (k-NN). The methods could be utilized in educational data mining approaches and computational behavior finding.
For the rest of the paper, section II discusses on the related works in the literature, section III summarizes the machine learning methods used in this paper. In section IV, the data collection procedure is described. Section V and VI comprises the experimental methods and results. The insights and mapping between the traits and stress scale are discussed in section VII and finally concludes in section VIII.
-
II. Related Works
In this section, we have summarized the novel works from existing literature related to our presented work. Identifying personality traits using questionnaire and setting labels according to it is performed by many researchers [4, 5, 6]. The authors have tried to extract relevant features from the textual data of social media and classify the personality traits accordingly. International Personality Item Pool (IPIP1) are the items or questions to be answered to devise a scoring mechanism for traits identification. For identifying the traits a set of questions are used, as the test takers have to answer the questions honestly and individual score of each question are set to get the total trait score. Depending on the number of items in the survey there are 100 IPIP, 50 IPIP even 20 IPIP. Depending on the behavior of test taker on different issues of practical life, these items are set by psychologists. Different ground truth datasets are labeled by researchers for computational prediction tasks [7, 8] such as myPersonality dataset. These dataset are collected from social media and been utilized by others for devising prediction methods.
Linear Dirichlet Allocation (LDA) [9], Linguistic Inquiry and Word Count (LIWC), Term Frequency -Inverse Document Frequency (TF-IDF) [9], deep learning methods [6], Parts-of-Speech (POS) tags, Speech Acts, Sentiment feature [10] based algorithms are presented by the respective researchers.
In recent years, the impact of social media is significant and computer science as well as psychology researchers are making essential contributions in this area. The use of behavioral features are been integrated in social media such as users behavior based community recommendation [21], strong friends based friend recommendation frameworks [22]. But, none of the work shows the relationships on the perceived stress of the user and his/her personality traits. Therefore, this pitfall has become our main opportunity to contribute.
Perceived Stress Scale (PSS) [2, 3] is one of the most widely used psychological instruments for determining the perception of stress. The degree of stress depends on the items designed which are justifying how unpredictable, uncontrollable and overloaded respondents find their lives. The levels of stress are low, moderate and high which should be influenced by regular hassles, significant events and predictive validity of PSS which is usual to fall rapidly after four to eight weeks.
The evaluation of perceived stress scale among the UK university students has been documented by A. Denovan in [23]. The study has been examining the factor structure, composite reliability, convergent validity and gender invariance among the 524 UK university students and four different factor based models are analyzed. In another work, the Hindi version of Depression, Anxiety and Stress Scale -21 (DASS-21) survey has been taken from the Hindi speaking head-neck cancer and oral potentially malignant disorder patients in [24]. K. Kumar et al. [24] justified the reliability and psychometric validity of the DASS-21. Moreover, the identification of negative personality traits from user-generated contents is significant as the neuroticism rate of a person may reflect his/her person greatly. In [24] a machine learning based approach has been adopted to detect neuroticism rate of a person.
In this paper, we have tried to depict the machine learning methods to map the traits with the PSS.
-
III. Machine Learning Techniques
The machine learning techniques used in this paper are Naïve Bayes (NB), Decision Tree (DT), Simple Logistic Regression (SLR), Random Forest (RF), Linear Discriminant Analysis (LDA), Multilayer Perceptron (MLP), Bagging (BA), Sequential Minimal Optimization (SMO) and k-Nearest Neighbor (k-NN). In this section we have summarized the above mentioned techniques.
Naïve Bayes (NB) classifier [11] is based on probabilistic approach and this classifier has been used in various areas with variants. Relying on the Bayes’ Theorem NB has no sophisticated unvarying parameter estimation.
As the name suggests, for decision making decision tree (DT) [12] is applied in the context of data mining classifications. Decision tree has proven beneficial in case of numerical and categorical data as it is possible to validate a training model using statistical tests.
Random Forest (RF) is a decision tree based ensemble classifier [13] applied in our work. RF is intrinsically suited for multiclass problems which also work fine with mixture of numerical and categorical features. RF internally builds separate multitude decision trees while training and it outcomes the class that is the mode of the classes and/or mean regression of each tree.
Simple logistic regression (SLR) [14] is a linear logistic model using LogitBoost algorithm. As LogitBoost uses a symmetric model, a sufficient number of iteration is performed in simple logistic regression to train the model. Built-in attribute selection is performed in SLR as an additional advantage. Therefore, for our experiments, we have applied this classifier.
Linear Discriminant Analysis (LDA) [15] is a generalization of Fisher’s linear discriminant, which is widely used in statistics, pattern recognition and machine learning. LDA works well when the measurements are not dependent variables for separate observations.
Bootstrap Aggregating, in short, Bagging (BA) [16] is an ensemble meta-algorithm which is based on statistical classification and regression. While performing it reduces the variance and avoids overfitting.
Multilayer Perceptron (MLP) [17] is a version of feedforward artificial neural network. Consisting minimum three layers namely input layer, hidden layer and output layer, where the hidden and output layers utilizes nonlinear activation function. MLP is proved to be useful to solve problems stochastically, which usually solutions to complex problems.
Support vector machine (SVM) has become one popular yet essential classifier used in various sections of data mining such as, medical data mining, image data processing, bioinformatics etc. Though it is proven to work better in many cases, the training process is slower in some context. Therefore a fast algorithm for training the SVM is introduced in [18] namely sequential minimal optimization (SMO). Applying quadratic programming (QP) optimization problem by breaking the problem into sub-problems SMO minimizes the time required to train the model. For our work, we have used Weka version of SMO having poly kernel.
k- Nearest Neighbors (k-NN) [19] algorithm is a parameter independent classification method where the input consists of the k closest training samples. The training examples are considered as vectors in a multidimensional feature space having a class label. The appropriate value of k is dependent on data. For our experiments, we have changed the value of k and tried to find the highest accuracy of the algorithm and the corresponding k value.
We have used 10-fold cross validation to train and test the proposed experimental method for each of the classifiers. The classifiers are implemented inside Weka
-
[20] and we have utilized the tool to apply them directly on the collected data.
-
IV. Data Collection
In this section the data collection process is described. The participants used, sample questionnaires, dataset credentials and data cleaning, data pre-processing steps are illustrated here.
-
A. Participants
For this paper, we have collected data from 162 participants. The participants were very friendly and willing while giving honest answers of the questions. Among the participants 48 were females and 114 were males in the age boundary of 19 to 23. The participants all are Bangladeshi born students in their undergraduate level of study. All the participants’ data are kept anonymous and they duly signed consent form of data privacy and security concerns.
-
B. Questionnaires
The questionnaires used for the experiments are of two types. One is for personality traits and another is for perceived stress scale. We have used the 50-item IPIP question set for getting the numeric score of each personality traits of Big Five Model. The PSS is widely used survey form, which we have also used in our case without any major modifications. The participants were asked to fill up the hard copy printable forms found in the project of Open Source Psychometrics Project2. Each of the IPIP items were labeled between 1-5 score, where 1=disagree, 2=slightly disagree, 3=neutral, 4=slightly agree and 5=agree.
The PSS is a 10-item question set that has to be labeled between 0-4 score, where 0=never, 1=almost never, 2=sometimes, 3=fairly often and 4=very often.
-
C. Dataset Credentials
As mentioned in the survey forms the scoring is given by the participants and the Overall score for each personality traits and total score of stress is determined. For using this data in machine learning approach, we have gathered these raw data into a formal dataset which contains the five personality traits values and the stress class. For each participant these data are collected in each row considering a feature set. The properties of the collected dataset are given in Table 1.
Table 1. Properties of the collected Dataset
|
Properties |
Values |
|
No. of Participants |
162 |
|
Total Instance |
162 |
|
No. of low stress class instance |
30 |
|
No. of high stress class instance |
18 |
|
No. of moderate stress class instance |
114 |
-
D. Data Cleaning & Pre-processing
The dataset consists of the personality traits score. Openness-to-experience, Extraversion, Agreeableness, Neuroticism and Conscientiousness scores are determined using pre-set formulas and the no hard rule based data cleaning or pre-processing is performed over the data. Therefore, the noisy data is incorporated within the dataset, which may affect the performance, but the manually altered data will not give the real insight of the personality and stress measurements.
-
V. Experimental Method
In this section, the machine learning based model is implemented. The experiments are in form of supervised learning and here 10-fold cross validation is performed for each of the classification algorithm. The experimental model could be depicted in Fig. 1.
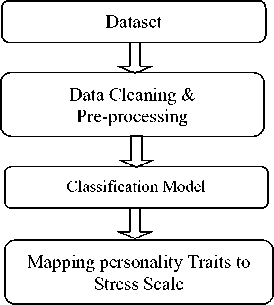
Fig.1. Experimental method for mapping personality traits to stress scale.
The typical machine learning based approach has been adopted to evaluate the performance of the mentioned classifier in section III.
optimized version of SVM and the advantages of quadratic programming in the back end may become influential in performance.
Table 2. Performance Metrics of Different Classifiers
|
Classifier |
Precision |
Recall |
F1-score |
Accuracy |
|
NB |
0.446 |
0.558 |
0.496 |
55.7692% |
|
DT |
0.525 |
0.615 |
0.557 |
61.5385% |
|
RF |
0.688 |
0.654 |
0.786 |
65.3846% |
|
LDA |
0.555 |
0.635 |
0.590 |
63.4615% |
|
SLR |
0.686 |
0.673 |
0.805 |
67.3077% |
|
BA |
0.686 |
0.672 |
0.802 |
67.3071% |
|
MLP |
0.601 |
0.635 |
0.617 |
63.4615% |
|
k-NN |
0.478 |
0.500 |
0.488 |
50.0000% |
|
SMO |
0.692 |
0.692 |
0.818 |
69.2308% |
The regular k-NN algorithm in Weka runs for k=1. For our work, we have calculated the performance metrics of k-NN algorithm for different k values in Table.
The performance of the same algorithm differs as the neighborhood changes. The maximum achieved accuracy are same as SMO using k=13. Therefore, we may declare that for mapping personality traits with perceived stress scale SMO and k-NN are better classifiers among the traditional classifiers.
VI Experimental Results
We have implemented the experimental method using the arff file format in Waikato Environment for Knowledge Analysis (Weka) [20], developed by University of Waikato, which is a collection of machine learning algorithms including many classification algorithms. The performance metrics used for evaluation are precision, recall, f1-score and accuracy. The metrics could be calculated using the following equations (1), (2), (3) and (4), where TP is True Positive, FP is False Positive, TN is True Negative and FN is False Negative.
Precision=TP / (TP + FP) (1)
Recall = TP / (TP + FN) (2)
F1 – score = (2 * Precision * Recall)/ (Precision + Recall)
Accuracy = (TP + TN)/ (TP + TN + FP + FN) (4)
Table 2 shows the performance metrics for nine different classification algorithms. Except for NB, all other classifier has shown considerably satisfactory accuracy of above 60%. The classifiers are devised for the same algorithm, but they are specialized for different types of scenarios. Therefore, the accuracy metrics may have fluctuated results. For each of the classifiers, all four metrics are calculated and it is proved that SMO and k- NN gives the highest accuracy among the classifiers. SMO is an
-
VII. Discussion
From the above depicted results, we may claim some of the findings. The experimental findings are for the evaluation of the machine learning algorithm. Hence, the mapping between these two terms shows that:
-
- The more extrovert persons are tends to get moderately stressed.
-
- The persons having fewer score in extraversion are less stressed.
-
- The persons having higher score in openness-to-experience are tending to perceive high stress.
-
- Except for some cases, it is evident that persons having fewer score in neuroticism are tending to be less stressed.
The claims are depicted from the data gathered. It is mathematically possible to build a regression based model to prove the above mentioned sayings. The students perceiving high level stress could have direct impact on their behavior as well as on academic results [25]. Using the machine learning approaches as presented in this paper could be utilized to predict the students’ achievements in terms of motivation, learning pattern and emotional intelligence, as in [25]. C. Bhanuprakash et al.
-
[26] presented an informal approach to determine the bright graduate students from their classroom behavior patterns, which could be mapped also utilizing the perceived stress scales in classroom environments.
-
VIII. Conclusion
In this paper, we have presented a machine learning based approach to map between the personality traits and perceived stress scale of individuals. The system is trained and tested by the survey data of 162 participants and got approximately 70% of accuracy. The participants for our work were undergraduate students. Therefore, one of the future scopes could be to determine the personality traits at the beginning of the semester and behave accordingly to the students who could get more stressed as the semester goes on. The impact factors of ICT tools in education [27] and using these tools may prepare a solid ground for researchers to apply machine learning in education data. Along with this idea, the recent ideas of neural networks have been utilized in [28] to predict the academic performances of computer science students. Applying the idea of mapping the behavior patterns and stress scale level with the academic performance of the computer science students may lead to the future scopes.
Acknowledgment
We would like to acknowledge the participants from Stamford University Bangladesh and Daffodil International University for their valuable time and knowledge shared to our research works.
References A machine learning based approach for mapping personality traits and perceived stress scale of undergraduate students
- S. Rothmann, E. P. Coetzer, "The big five personality dimensions and job performance". SA Journal of Industrial Psychology. 29. doi:10.4102/sajip.v29i1.88. Retrieved 27 June 2013.
- S. Cohen, T. Kamarck, R. Mermelstein, “A global measure of perceived stress”, Journal of Health and Social Behavior, 24, 386-396, 1983.
- S. Cohen, G. Williamson, “Perceived Stress in a Probability Sample of the United States. Spacapan, S. and Oskamp, S. (Eds.) The Social Psychology of Health. Newbury Park, CA, Sage, 1988.
- D. Quercia, M. Kosinski, D. Stillwell, J. Crowcroft, “Our twitter profiles, our selves: Predicting personality with twitter.”, In Privacy, Security, Risk and Trust (PASSAT) and 2011 IEEE Third International Conference on Social Computing (SocialCom), pp. 180–185, 2011.
- P. Howlader, K. K. Pal, A. Cuzzocrea, S. D. M. Kumar, “Predicting facebook-users' personality based on status and linguistic features via flexible regression analysis techniques”, Proceeedings of the 33rd Annual ACM Symposium on Applied Computing, Pau, France, pp. 339- 345, April 09-13, 2018.
- T. Tandera, D. Suhartono, R. Wong so, Y. L. Presidio, “Personality prediction system from Facebook users.” Procardia Computer Science, vol. 116, pp. 604–611, 2017.
- M. Kosinski, S. Mats, S. Gosling, V. Popov, D. Stillwell, “Facebook as a research tool for the social sciences: Opportunities, challenges, ethical considerations, and practical guidelines.” American Psychologist, 2015 Feb; 70(6): pp. 543.
- M. Kosinski, D. Stillwell, T. Grapple, “Private traits and attributes are predictable from digital records of human behavior”, In Proceedings of the National Academy of Sciences of the United States of America; 2013: PNAS. pp. 5802-5805.
- P. Holder, K. K. Pal, A. Cuzzocrea, S. D. M. Kumar, “Predicting Facebook-users' personality based on status and linguistic features via flexible regression analysis techniques”, SAC '18 Proceedings of the 33rd Annual ACM Symposium on Applied Computing, pp. 339-345, Pau, France, April, 2018.
- V. Kaushal, M. Patwardhan, “Emerging trends in personality identification using online social networks-A literature survey”, ACM Transactions on Knowledge Discovery from Data, vol. 12, no. 2, Article. 15, January 2018.
- I. Rish, “An empirical study of the naive Bayes classifier”, In Proceedings of IJCAI-01 workshop on Empirical Methods in AI, pp. 41–46, Sicily, Italy, 2001.
- S. R. Safavian, D. Landgrebe, “A survey of decision tree classifier methodology”, IEEE Transactions on Systems, Man and Cybernetics, pp. 660–674, 1991.
- L. Breiman, “Random forests”, Machine Learning, 45:5– 32, 2001
- Niels Landwehr, Mark Hall, Eibe Frank, “Logistic Model Trees”, pp. 161-205, vol. 95, 2005.
- R. A. Fisher, “The Use of Multiple Measurements in Taxonomic Problems”, Annals of Eugenics. vol. 7, issue. 2, pp. 179–188, 1936.
- L. Breiman. Bagging predictors. Machine Learning, vol. 24 issue. 2, pp. 123–140, 1996.
- R. Collobert, S. Bengio, “Links between Perceptrons, MLPs and SVMs”. Proceedings of International Conference on Machine Learning (ICML), 2004.
- J. C. Platt, “Sequential minimal optimization: A fast algorithm for training support vector machines”, Technical Report MSR-TR_98_14, Microsoft Research, 1998.
- N. S. Altman, “An introduction to kernel and nearest- neighbor nonparametric regression”, The American Statistician, vol. 46, issue. 3, pp. 175–185, 1992.
- G. Holmes, A. Donkin, I.H. Witten, “Weka: A machine learning workbench”, Proceedings of Second Australia and New Zealand Conference on Intelligent Information Systems, Brisbane, Australia.
- M. M. Hasan, N. H. Shaon, A. A. Marouf, M. K. Hasan, H. Mahmud, and M. M. Khan, “Friend Recommendation Framework for Social Networking Sites using User‘s Online Behavior”, IEEE- Computer and Information Technology (ICCIT), December 2015, pp. 539-543.
- A. Denovan, N. Dagnall, K. Dhingra and S. Grogan, “Evaluating the Perceived Stress Scale among UK university students: implications for stress measurement and management”, Journal of Studies in Higher Education, Vol. 44, Issue. 1, pp. 120-133, 2019.
- K. Kumar, S. Kuma, D. Mehrotra, S. C. Tiwari, V. Kumar and R. C. Dwivedi, “Reliability and psychometric validity of Hindi version of Depression, Anxiety and Stress Scale- 21 (DASS-21) for Hindi speaking Head Neck Cancer and Oral Potentially Malignant Disorders Patients”, The Journal of Cancer Research and Therapeutics, January, 2019.
- A. A. Marouf, M. K. Hasan, H. Mahmud, “Identifying Neuroticism from User Generated Content of Social Media based on Psycholinguistic Cues”, 2019 2nd IEEE Conference on Electrical, Computer and Communication Engineering (ECCE 2019), CUET, 7-9 February, 2019.
- Muhammad U. Fahri, Sani M. Isa, " Data Mining to Prediction Student Achievement based on Motivation, Learning and Emotional Intelligence in MAN 1 Ketapang", International Journal of Modern Education and Computer Science(IJMECS), Vol.10, No.6, pp. 53-60, 2018.DOI: 10.5815/ijmecs.2018.06.07
- C.Bhanuprakash, Y.S. Nijagunarya, M.A. Jayaram, " An Informal Approach to Identify Bright Graduate Students by Evaluating their Classroom Behavioral Patterns by Using Kohonen Self Organizing Feature Map ", International Journal of Modern Education and Computer Science(IJMECS), Vol.10, No.8, pp. 22-32, 2018.DOI: 10.5815/ijmecs.2018.08.03
- Bekim Fetaji, Majlinda Fetaji, Mirlinda Ebibi, Samet Kera, " Analyses of Impacting Factors of ICT in Education Management: Case Study", International Journal of Modern Education and Computer Science(IJMECS), Vol.10, No.2, pp. 26-34, 2018.DOI: 10.5815/ijmecs.2018.02.03
- Abimbola R. Iyanda, Olufemi D. Ninan, Anuoluwapo O. Ajayi, Ogochukwu G. Anyabolu, " Predicting Student Academic Performance in Computer Science Courses: A Comparison of Neural Network Models", International Journal of Modern Education and Computer Science(IJMECS), Vol.10, No.6, pp. 1-9, 2018.DOI: 10.5815/ijmecs.2018.06.01
