A Method for Post-hazard Assessment Through Topography Analysis using Regional Segmentation for Multi-temporal Satellite Imagery: A Case Study of 2011 Tohuku Earthquake Region

Author: Pushan Kumar Dutta, O.P. Mishra, M.K.Naskar
Journal: International Journal of Image, Graphics and Signal Processing(IJIGSP) @ijigsp
Article in issue: 10 vol.5, 2013.
Free access
Non-rigid image registration in extracting deformation map for two satellite images of the same region before and after earthquake occurrence based on measure of intensity dissimilarity C(Ir, T(If)) can play a significant role in post hazard analysis. In this paper, we have proposed a novel image transformation and regional segmentation of the same visualized region by assigning displacement label to change in intensity using Advanced Synthetic Aperture Radar (ASAR) satellite images. We used graph cut based non rigid registraion with a data term and a smoothness term for assigning markovianity between neighboring pixels. Displacement labels has been directly assigned from this data term for small intensity difference. Secondly, our data term imposes stricter penalty for intensity mismatches and hence yields higher registration accuracy. Based on the satellite image analysis through image segmentation, it is found that the area of .997 km2 for the Honshu region was a maximum damage zone localized in the coastal belt of NE Japan fore-arc region. A further objective has been to correlate fractal analysis of seismic clustering behavior with image segmentation suggesting that increase in the fractal dimension coefficient is associated with the deviation of the pixel values that gives a metric of the devastation of the de-clustered region.
The 2011 Tohoku earthquake, ASAR, Graph cut, Regional segmentation, Region damage, Fractal analysis
Short address: https://sciup.org/15013078
IDR: 15013078
Text of the scientific article A Method for Post-hazard Assessment Through Topography Analysis using Regional Segmentation for Multi-temporal Satellite Imagery: A Case Study of 2011 Tohuku Earthquake Region
-
I. INTRODUCTION
The pacific coast of Tohuku in Northeast (NE) Japan has experienced past damaging inter-plate earthquakes due to heterogeneous rupture dimensions that overlap one after another [1]. Studies by [2] revealed that the zone of the 2011 Tohoku tsunamigenic earthquake has a history of several past damaging scenario due to strong earthquake shakings and havoc tsunamis. [3] produced a comprehensive map of rupture distribution of past damaging earthquakes that showed overlaps of a mega-thrust earthquake of magnitude Mw 9.0 with the 1897 Miyagi-oki earthquake and the 1989 Sanriku earthquakes (Mw 7.5), in vicinity of which the 11th March 2011 tsunamigenic Tohoku earthquake rocked the coastal belt of NE Japan forearc region. The earthquake was located about 130 km east of the Sendai and about 430 km northeast of Tokyo (USGS[4], IRIS).
The proposed study formulates a new energy based cluster refinement technique to solve region based non-rigid registration. The robustness of the satellite images lies in the ability to be acquired globally in any time frame for feature based [5] and intensity based [6] analysis of the different segments in the image. The utilities of such studies in satellite image analysis involves remote sensing (multispectral classification) [7],environmental monitoring, change detection[8] and weather forecasting. Image segmentation analysis constitutes an essential issue for data analysis from satellite prospection involves region based segmentation. The devastation analysis for region-based segmentation involves several major approaches: the JSEG [9], watershed [10] and pyramidal decomposition [11]. Newer approaches on image segmentation has also been used like demons[12], turbo pixel decomposition [13], graph cuts [14] and CSC segmentation [15]. A graph cut image registration technique has been proposed for extraction of damage region along the entropy and fractal distribution models for damage information along the coastline of Tohoku. In fact, image segmentation using graph cut can be understood as the process of assigning a label to every pixel in an image, the same
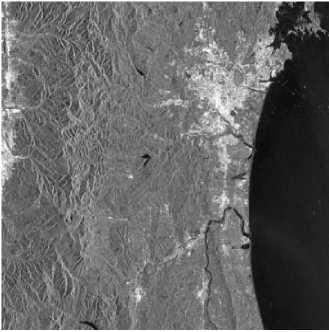
Figure1(a): Acquired ASAR Image on 21 November 2010 before the earthquake/tsunami from Envisat from European Space Agency portal
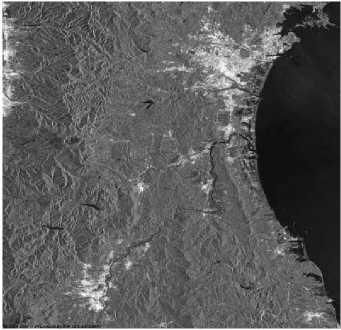
Figure1(b):Acquired ASAR image on 21st March ,2011 after the earthquake from Envisat satellite label represent the same object. The remotely sensed Advanced Synthetic Aperture Radar (ASAR) imagery acquired on 21st Nov, 2010 as shown in Fig 1a, representing the scenario of the coastal belt of Sendai prior to earthquake, while Fig. 1b showed the post tsunamigenic earthquake damage scenario of the region acquired on 21st Mar, 2011.
These images have been retrieved and diagnosed in the same visualization framework for change of pixel analysis for point by point correspondence mapping of disaster zones can be very useful to determine essential relations between the fractal value and damage level [16]. The diverse set of deformation patterns acquired from ENVISAT’s Advanced Synthetic Aperture Radar (ASAR) are highly effective for large scale disaster analysis as it is free from climatic perturbations for any region unlike optical images from Advanced Space-borne Thermal Emission and Reflection Radiometer (ASTER) [17] sensors. ASAR imagery is applicable in remote sensing because of its robust applications having enhanced geometric correction accuracy.
A formulation for region wise segmentation technique [18] in this framework may guide the minimization process towards a solution influenced externally. The image segmentation analysis in the proposed study has been categorically distributed into the following steps; pre-processing the ASAR satellite imagery for analysis, find the deviation from the mean image registration for minimization of mismatch between two images using graph cut and demons method, extraction of the optimal transformation from registration by calculating displacement of each pixel for energy minimization between two images by using graph cut and demons method and regional segmentation obtained from the various transformations produced by the different regions.The experimentation and validation of a non rigid registration technique for demons and graph cut method from displacement in pixel analysis and segmenting regions to extract refined clusters through transformation mapping has been explained in the different sections as follows. In Section II, the actual method is presented. In Section II preprocessing the satellite imagery acquired is presented. After formulating the general problem of intensity-based estimation of linear transformations, the basic transformation mapping and registration using graph cut has been established in Section II.A while Section II.B outlines the fractal analysis to analytically define the changes in the spatial complexity of the multi temporal images pre and post earthquake.Section II.C analyzes the standard graph cut segmentation framework for refined cluster analysis which is thereby used for regional segmentation in the graph cut minimization framework. The algorithm for a new energy based cluster refinement technique to solve region based non-rigid registration is presented in section III in satellite imagery analysis. In section IV experimental results and validation studies for refined area mapping in satellite image for regional segmentation is presented. The final conclusions and future perspective of the proposed work has been included in Section V.
-
II. METHODOLOGY
Image registration is the process of precisely making a point to point correspondence for two (or more) images of the same area by analyzing the intensity distributions in the floating and the reference image. Given the fact that n and m are the dimensions of the image, each component of the vector corresponds to a pixel in the image. Static image as reference image and floating being the deformed image are alligned to get optimal transformation based on deformed image to achieve a simple image pre-processing, and then two different registration criteria, mutual information and edge interaction variance for image registration. A transformation function determines the relation between all points in two images. Given the coordinates of a point in the reference image, it finds the coordinates of the same point in the sensed image.
-
A. Image Registration
This information can quantify image flow, quantifying the local deformation or motion of the sensed image with respect to the reference image. Given a fixed image F as shown in Fig. 2a and a moving image M as shown in Fig.2b, we show that non-parametric image registration may be treated as an optimization problem that aims at finding the displacement of each pixel for area of interest and decide if all pixels contained in the region satisfy some similarity constraint.
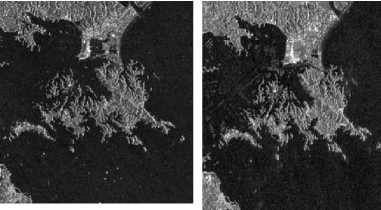
Figure 2(a,b)Emissivity images (RGB=Band 14, 12, 10) retrieved from Static image (before earthquake) on the left and for Moving Image (after earthquake)
The deformation field was evaluated for a pixel object representative energy function having two coefficients of a data dependent term and a smoothness term. Transformations for deformable surface to image registration provides better way to control the smoothness of the deformation field allowing a more complete framework for non-rigid registration with graph cut method. The image processing schemes involved in the process of deformable field extraction consists of feature detection, feature matching, transformation function estimation and image resampling. Graph cuts introduce spatial domain information of the image that is lacking in the Demons method. High resolution satellite imagery, According to the algorithm, on each pixel a velocity is defined with use of the intensity differences and gradient information. This velocity (displacement) field is smoothed by a Gaussian as explained in [19] and iteratively used to transform the moving image, and register on to the static image.The method lags as change in intensity between the (Fig 2a) and the (Fig 2b) is caused by change in illumination in addition to the non-rigid motion. In order to remove the effect of irregular illumination the proposed study implements novel data term as an index of an exponential function. Let I and J respectively be the static image and the moving image of dimension d and X be the continuous spatial domain of both images. The transformation treats the pixels in the moving image like a set of nodes, where each pixel move freely in a locally coherent connected to its neighbors by edges and Markov random field (MRF) pixel classification [20]. Markov random fields belong to the statistical models of images. Each pixel of an image can be viewed as a random variable. Pixel displacement depend only on its neighbors in a Markov Random Field. They are much easier to manipulate as changing one pixel in the image only affects its neighbors by assigning labels. Given a set of objects A = {a1, a2, . . . , am}, and a set of labels B = {b0, b1, . . . , bn}, it is required to assign labels to the objects to best satisfy the world knowledge. Objects a1, a2, . . . , am can be considered regions in the sensed image and labels b1, b2, . . . , bn can be considered regions in the reference image. After labeling the graph, a meaningful segmentation of the image from the deformation criterion [21] is obtained. The deformation field undergoes two forces, one that matches the moving image with the original image, the second that keeps the deformation field smooth. In order to register the original and moving images for point to point correspondence, we need to optimize [22] over a given space of spatial transformations. Taking advantage of efficient algorithms for global min-cut solutions, [23] were first to discover that powerful min-cut/max-flow algorithms from combinatorial optimization can be used to minimize certain important energy functions in visualization framework models. Graph-cuts addresses segmentation in an optimization framework and finds a globally optimal solution to a wide class of energy functions. One of the standard practices is to use a graph cut method with α expansions(24).The following phases apply in image registration using graph cut. Using the data analysis we have assigned various levels to the pixels and found the data cost term. This energy function gets optimized by graph cut (via alpha expansion) and optimum labeling is obtained.
-
B. Fractal Analysis of Damage
The fractal dimension is a real number space filled by pixels whereby classification in a feature space spatial inhomogeneity of the seismicity distribution. Fractal techniques can be implemented to characterize the overall spatial complexity of an image. The fractal dimension is determined as the slope of the line which corresponds with the regional segmentation scenario. Most of the nature phenomena exhibit fractal characteristics [25,26], so fractal modeling of natural surfaces can play an important role in remote sensing for interpretation of surface physical phenomena. This is done by extracting textural feature (fig 3a and 3b) for analyzing spatial distribution of catastrophic damage. In order to extract spatial relations to other textural features regional segmentation of devastation region has to be done.
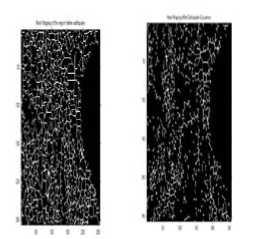
Figure 3 :Fractal Distribution for texture analysis on edge mapping prior to earthquake occurrence for image analysis prior(a) to and post(b) earthquake occurrence
Image registration scheme has been analyzed by defining a motion for every pixel in the image. Data element set P representing the image pixels has a neighborhood for a set N representing all pairs {p,q} of neighboring elements in P. In other words, the pixel sitting at a position p (k) on the original image is known to have moved by f (k) on the second image for a significant space window. If ‘A ’ be a vector specifying the assignment of pixel ‘p’ in ‘P’, then each ‘Ap’ can be either in the background or the object. ‘A’ defines a segmentation of ‘P’, displacement label (vector) is assigned to each pixel in the source image to indicate the corresponding position in the floating image. Graph cut with α expansion provides refined spatial mapping between corresponding regions, providing more versatile information that cannot be easily obtained using active contour or level set algorithms.
-
C. Graph-cut based non-rigid registration and transformation
The graph cut method was introduced for interactive image segmentation that is unaffected by smoothness of the pixels flow but identify change of intensity associated with object boundaries. The study passes a new method to pass the deformation field across resolution levels in order to enable multi-level nonrigid registration using graph-cuts where P denote a set of pixels and segmentation can be done by assigning label lp Є L to each pixel p,q Є P,energy minimum function for pixel values resulting to
E(L) = ∑ D p ( l p ) + ∑ V p , q ( l p , l q ) (1) p ε P ( p , q ) ε N
The deformation field between two images I1 and I2 as source and moving image can be recovered by minimizing the energy as in {1}. The first term, Dp(lp), measures how the data differs between the source image and the moving image. For instance, squared sum of differences as in {2} multimodal images[27] that implements mutual information can be used for analysis. The second term, Vp,q(lp,lq) is an index of the smoothness coefficient for the deformation field. The technique involves constructing a specialized graph for the energy function to be minimized such that the minimum cut or maximum flow on the graph also minimizes the energy globally. According to the algorithm, on each pixel a velocity metric corresponding to crustal deformation is defined with use of the intensity differences and gradient information. Let I and J respectively be the static image and the moving image of dimension d and X be the continuous spatial domain of both images. For any spatial point x= (x1, x2... xd) ∈ X, I(x) and J(x) are the intensity values (or feature vectors in general) at x of both images. In formulation, a transformation T represent a displacement vector field D which is relative to every point x displacement in J away from its original position by the vector D(x) ∈ Rd to the new point x + D(x). Optimize an assignment from a finite set of transformations through a discrete labeling problem.
D* = argmin C (I(X), J(X + D)) + λ S (D). (2)
The dissimilarity function C can be anything such as sum absolute difference (SAD), sum squared difference (SSD), normalized cross-correlation function or negative of the mutual information. Magnitude of the first derivative term as smoothness function S and get
N
-
D* = argmin C (I(X), J(X + D)) + λ ∑ ∫ | D x i | dx (3) i = 1 X
Where D(xi) is the first derivative of D along direction xi and the differential element dX = dx1dx2...dx. dx + D(x) in Eq {3} can be any noninteger valued vector, and J(x + D(x)) needs to be computed using an interpolation function. Also, when x + D(x) is outside the image domain, a pre-assigned background intensity value can be used. Graph-cuts addresses segmentation in an optimization framework and finds a globally optimal solution for D* in equa {3} for wide class of energy functions. Exponential function enforces strict penalty by assigning low labels in the data term to pixels in the floating image having small intensity difference with pixels in the reference image functions .The proposed function for this problem is given below:
C(I r ,D( I f ))=[exp( ∑ P I r - D ( I f )P -∂ ( I r , D ( I f ))) x ε X
∂(Ir,D(If))=m where problem of determining sliding window
- ∑ V c ( x )
P ( X = x ) = 1 e xs ∈ V ( x )
energy term depending o
in ∑ (P I r - D ( I f )P)
xεX . The the correct devation in a found as
= 1 e - U ( x )
Z where U(x) is an the vicinity of x. This can take any form and two of them, the Binomial form seen in class and the Potts model.To introduce correlation in its most general form, we have to assume that all the pixels in the image are correlated and we have to consider all the pixels at the same time. we now observe a noise data Y corrupted by noise n as Y = X+n. We know that X is a Markov random field. We want to recover X. Therefore we want to find the most probable X, given the observed data Y: P(X/Y). Graph cut is the most robust technique for energy minimization in non rigid image registration with greater degree of automation. The main idea of the α expansion algorithm is to iteratively minimize the energy, testing one value of pixel at a time for allowed deformation, α = (+1, +1) pixels.The Maximum Entropy[28] approach is one of the most important threshold selection methods but lacks in terms of execution time when the Maximum Entropy criterion is applied to multi-level threshold selection (29). Registration accuracy is improved by incorporating higher order terms in the energy function [30] .
Sub-scenes of 512*512 pixels from the original images were used. In all experiments for the proposed study, it is assumed that the intensities of the images are normalized to be within 0 and 255.A discrete labeling is applied to the deformed image J(x+D (x)).Feature matching is done to find transformations for moving parts of source to parts of target between the features in the reference and sensed image.Iteratively change each pixel and calculate the likelihood (energy) associated to the change. The choice of the neighborhood function is the choice of the user and will make the specificity of a given random field as a change if the likelihood is smaller. On feature matching, moved all the points as possibly close to the target by applying selected transformation v=fp (p) have a probability of keeping the change if the likelihood is higher. This probability ensures convergence to the global minimum of energy. Formulated energy function from these images E=D+S where D is the data term and S is the smoothness term for the restriction imposed on the displacement of the neighboring pixels. From similarity or dissimilarity measure assigned probable labels to the corresponding pixel. Data term incorporated can be a similarity or dissimilarity measure between two images I(x) and J[x+D (x)] where D(x) is the deformation field and can be sum absolute difference. S term is for assigning markovianity among neighboring pixels represented by means based potts [31] model having global smoothness term for preserving continuity.Energy gets minimized for optimal image registration. Retrieve transformation matrix from minimized energy function. Area of difference transformation matrix for ranges is calculated.Applied image translation for images through adjacency matrix. Conditional entropy parameters of the images for local,joint and regional values has been calculated as in Table1 that shows the disorder of the image.
TABLE1: Maximum Entropy extracted from satellite images on the threshold based on regional segmentation
|
Acquired Image |
Local Entropy |
Joint entropy |
Global Relative Entropy |
|
Before earthquake Image |
140 |
36 |
145 |
|
After Earthquake Image |
122 |
16 |
127 |
-
A. Efficiency of graph cut with α expansions for remote sensing applications
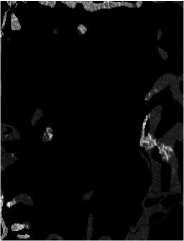
Energy minimization is a multilevel algorithm( background ar object of interest) so graph cut algorithm alone takes more time process can be made faster by running graph cut with alpha expansion algorithm. Implementation of graph-cuts algorithm was done by modifying the source codes provided by [32]. The main reason using graph cut helps to optimize the registration process by using the alpha-expansions which assign a displacement label (vector) to each pixel in global manner with high-degrees of freedom. We observed that the graph cuts introduce spatial domain information of the image that is lacking in the experimental results of the proposed method and compares the results with the single-level version demons method for non-parametric image registration for optimization finding the displacement of each pixel coherent and continually in spatial cluster regions that could be useful for cartographic classification [33]. Based on discrete labels, the number of labels in each resolution is reduced and deformation vector field gets scaled to meet image resolution in next finer level. Distance is used to measure alignment for a given label. Smoothness is used to restrict and clear different labels for adjacent cells. Transformations in the shift in pixels can control the smoothness of the deformation field through a visualization framework implemented using fractal distribution.This will be helpful to measure spatial variations(X) of grey levels in the image.P(X) for X is the nxm random field. If we assume that all the pixels are uncorrelated sample p(X) as where xi are the pixels of the image. A set of images for analyzing in extracting the parameters of the MRF (estimation phase).We can generate similar images. At each step, graph cuts (Fig 4b ) optimally assign fp = α to the deformation field f. One attractive property of the α expansion algorithm is that it guarantees a convergence towards a local minimum whereby recovering the deformation map could be useful in a registration framework.
Un = arg min F(U, Vn-l) , and UV1' = arg min F(Un, V).
There are other segmentation algorithms in the literature which extends the concepts of graph cuts. Most prominent of them are graph cuts and lazy snapping [34] and graph cut with mutual information[35]. Lazy snapping separates coarse and fine scale processing for making object specification and detailed adjustment easy in pixel separation. Accurate labels can be assigned and better registration accuracy can be achieved. The smoothness penalty is imposed based on the concept of label consistency. Beside, grab cuts [36] extends graph-cut by introducing iterative segmentation scheme to the image graph for refined segmentation schemes in intermediate steps. Segmentation with topology generation scenarios are set according to the resolution and scale of the expected objects. Grow cut [37] technique is given a small number of user-labeled pixels, the rest of the image is segmented automatically by a cellular automaton. The process is iterative with multi-labels for image, multi-scale texture analysis for input with image segmentation and differentiation is difficult to achieve in the operational context of homogenous region classification extracted from satellite imagery. In the graph cut the data term was earlier a dissimilarity measure between two images like absolute intensity difference of two images whereas we implemented exponential term eliminating the mean difference that has captured any preregistration intensity difference .Since there are no negative accuracy values the efficiency has subsequently increased as shown in Table 2.
TABLE 2: Absolute Intensity Difference for statistical emissivity values (the mean, the standard deviation) for comparative measure of accuracy of regional segmentation values
|
Registration Algorithm |
Mean |
Standard Deviation |
|
Demons Algorithm |
12.6100 |
27.1190 |
|
Graph Cut -α expansion |
0.2449 |
4.4666 |
-
B. Post Seismic Hazard Assessment and histogram Analysis
In order to validate perspective distortion for the moving image (the image to segment), and the reference image, three phase optimization is implemented. The first phase involves recovering a non-rigid deformation field using graph cut with α epanision. The second shows how regional segmentation can influence the deformation map. The third is extraction of region based clusters through analysis of dissimilarity of pixel values implementing application of fractal techniques to image analysis. The proposed method is fast and robust against undesired change in imaging conditions. Images as shown in Fig,
2 (a ,b) correspond to two different captures of the same scene in different times rounded to 255*255 pixels. Region-based methodologies are predominant to segment the satellite image and active contour models are preferred. The histogram of the image region was dissected into two parts using the global mean value as the dividing point. The mean and standard deviation were calculated for each image segmentation process as shown in Table 3. The used label set is then fp Є {(dx, dy)}, where dx Є-[15; +15] and dy Є [-15; +15].
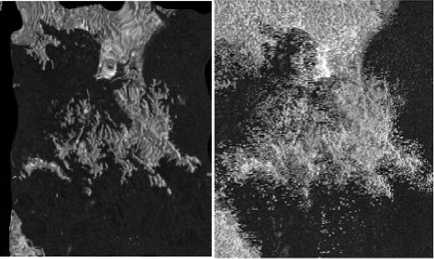
Figure 4: The Demons algorithm and graph cut method transformation for recovery of registered image for Moving image(Fig 2(b) (Demons algorithm(a) and Graph Cut Method(b)).
TABLE 3: First five normalized joint intensity histogram analysis at 4 different locations
|
Region displacement classification |
Pixelwise displacement |
|
0-10 |
5.2x10⁴ |
|
10-20 |
0.93x10⁴ |
|
20-30 |
5831 |
|
30-40 |
1031 |
|
40-50 |
890 |
Based on the image mismatch, the projection of the relative displacement of each pixel in the two axes can be analyzed to evaluate the region where the maximum shift in the pixels takes place (Fig. 5).
Region extraction on change in intensity of

Region based grouping for pixels in sq km area in km
Figure 5: Joint intensity histogram for number of pixels vs transformation graph for discretized values
The maximum shift in the intensity of the pixels gives us an empirical measure of the area of maximum devastation which may be highly significant to conduct future remote sensing observation for a comprehensive analysis of geo-hazard distribution. From Table 3 it is evident that the pixel wise displacement values for intensity based registration of images is discretized in different ranges such as 0-10, 10-20, 20-30, 30-40 in different columns as shown in Fig. 6, which is regionally extracted from the moving image.
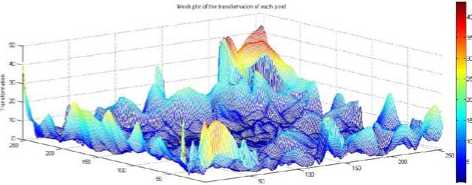
Figure 6: Plot of transformation of different pixels of static image
-
C. Area Estimate and Segmentation
The region extraction through regional segmentation analysis for the nature of devastation reveals from Table 3, suggesting that 1031 pixels for the region of maximum devastation has suffered the maximum displacement in terms of change in the number of pixels. The region of maximum devastation is evaluated by multiplying the cluster of pixels for region with the spatial resolution of each pixel corresponding to appoint in the satellite imagery for estimation of the area of devastation. In this image, the spatial resolution of the Envisat image is 30 meters equivalent to a pixel which means one single pixel refers to the area of 302 or 900 squares of meters. After
the multiplication of pixel change based on intensity and resolution, 1031*302 m2=0.9279* 106 m2 corresponding to .997 km2 is the region that has undergone the maximum devastation. This image is divided into 4 - sub-images and numbered in turn as A, B, C and D. These are judge for non-zero sub-matrices. Using a joint histogram estimation for the refinement cluster mapping the whole earth-quake affected area can be sub-divided into regional portions. From the projected data analysis of fig 6 for maximum displacement of the pixels based on regional segmentation , it can be easily found out that which region has been mostly hit by earth-quake and which region has got much less influence of the earthquake (as a part of post seismic analysis). The number of pixels under-going much or less transformation can also be obtained as in fig 7(a, b, c, d).
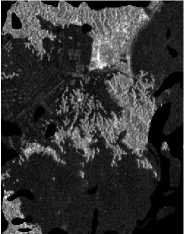
Figure 7a) Region 1( 0-10)

Figure 7c) Region 3(20-30)

Region 2( 10-20)
Figure 7b)
Figure 7d) Region 4(30-40)
Fig 7: Manual Segmentation for each region for displacement (a, b, c, d) of the pixels
In the proposed work based on joint intensity histogram study as in fig 5 to measure the number of pixels with transformation graph to look for discretized values. In order to measure the likelihood segmentation and analysis in a model segmentation scheme , the likelihood of an object given a target image pixels; Based on the plot transformation of figure 6 we compute pixel intensity quantile histograms of the image segmentation for three-dimensional coordinates of the earthquake disaster areas at the same time drawing the topographic map as in figure 8.
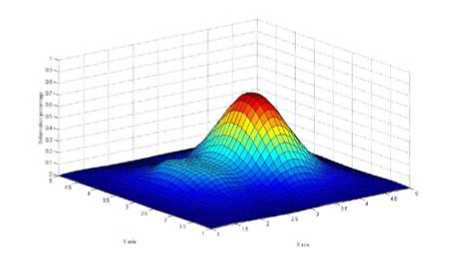
Figure 8:Deformation percentage for different clusters along x and y axis for pre and post earthquake imagery
-
V. Conclusion
This article implements the graph cut -α expansion that enables usage of a concurrent segmentation and registration as mutually supporting processes for region based cluster mapping. The graph cut analysis provides vivid outlook into the boundary and regional penalty model to achieve more accurate results for remote analysis of the imagery data. The proposed approach not only segments the transformed region of interest, but also generates refined spatial mapping between corresponding regions, providing more versatile information that cannot be easily obtained using active contour or level set algorithms. Segmentation phase of our approach has been refined by using graph-cuts technique to correlate fractal analysis of seismic clustering behavior with image processing analogies .Studies for increase in fractal dimension distribution associated with clustering of events that may determine the level of devastation of the region through objective quality metrics. The analysis shows that a realistic estimation for recovered deformation fields in pixels that will help formulate strategy for the post disaster need assessment of the region associated with strong shaking and tsunamis for disaster risk mitigation programs. The outcome of this study may provide collective information to a geo-analyst to utilize regional segmentation method for disaster analysis through remotely acquired satellite imagery for earthquake model. This approach can be used as a potential tool for post disaster loss assessment by policy makers, administrators, disaster managers to get a feedback for development of strategy for future investment in the disaster prone regions of the world.
ACKNOWLEDGEMENT
References A Method for Post-hazard Assessment Through Topography Analysis using Regional Segmentation for Multi-temporal Satellite Imagery: A Case Study of 2011 Tohuku Earthquake Region
- Mishra, O.P., Zhao D., Umino N. and Hasegawa A.,2003.Tomography of northeast Japan forearc and its implications for interplate seismic coupling, Geophysical Research Letters, 30 (16), 1850,doi:10.1029/2003GL017736.
- Mishra, O.P.,2004, Lithospheric heterogeneities and seismotectonics of NE Japan forearc and Indian regions, D.Sc. thesis, GRC, Ehime University, Japan, 2004, 223p.
- Nagai, R.,Kikuchi, M. and Yamanaka Y.,2001.Comparative study on the source process of recurrent large earthquakes in Sanriku-oki Region: The 1968 Tokachi-oki earthquake and the 1994 Sanriku-oki earthquake (in Japanese with English abstract), Zisin, 54, 267– 280.
- U.S.GeologicalSurvey,2011.Earthquake Hazards Program,http://earthquake. usgs.gov /earthquakes /recenteqsww/ ,viewed 27th Oct, 2011.
- Brown, L., 1992. A survey of image registration techniques. ACM Computing Surveys, vol. 24(4), pp. 325–376, doi:10.1145/146370.146374.
- Zitova, B. and Flusser, J.,2003. Image registration methods: a survey. Image and Vision Computing, 21, 977–1000, doi:10.1016/S0262-8856(03)00137-9 .
- Holia, M. and Thakar, V.K.,2009.Image registration for recovering affine transformation using Nelder Mead Simplex method for optimization,Avalaible at www.cscjournals.org/csc/manuscript/Journals/IJIP/volume3/IJIP-76.pdf.
- Radke, R.J., Andra, S., Al-Kofahi, O., Roysam, B.,2005. Image change detection algorithms: a systematic survey.In: Image Processing, IEEE Transactions on Signal Processing 14(3): 294 - 307 ISSN: 1057-7149. doi:10.1109/TIP.2004.838698.
- Deng, Y., Manjunath, B. Shin, H.,1999. Color image segmentation, In: IEEE Computer Society Conference on Computer Vision and Pattern Recognition, vol. 2, p. 2446.
- Meyer, F. and Beucher, S.,1992. The morphological approach of segmentation:the watershed transformation,In: Mathematical Morphology in Image Processing, E. Dougherty, Ed. Marcel Dekker, New York.
- Marfil, R., Molina-Tanco, L., Bandera, A., Rodrguez, J.,Sandoval, F.,2006.Pyramid segmentation algorithms revisited, Pattern Recognition,vol. 39, no. 8, pp. 1430 – 1451.
- Thirion, J.,1998. Image matching as a diffusion process: an analogy with maxwell's demons. Medical Image Analysis, vol. 2 (3), pp. 243–260.
- Xiang, S., Pan, C., Nie, F., Zhang, C.,2010. Turbo-pixel segmentation using eigen-images.In: IEEE Transactions on Image Processing, vol. 19, pp. 3024–3034, November 2010.
- Boykov, Y., Veksler, O., and Zabih, R., 2001a. Fast approximate energy minimization via graph cuts. In: IEEE Transactions on Pattern Analysis and Machine Intelligence,23(11):1222–1239, Crossref.
- Priese, L. and Rehrmann,V.,1993. On hierarchical color segmentation and applications,In: Proc of the Conference on Computer Vision and Pattern Recognition, pp. 633–634.
- Schubert, A., Small, D., Nuno, M, Meier, E. ,2008. ASAR Product Consistency and Geolocation Accuracy. In: Proceedings of the CEOS SAR Cal/Val Workshop, Oberpfaffenhofen, Germany, November 2008.[Crossref]
- Yamaguchi, Y., Kahle, A.B.,Tsu, H.,Kawakami, T., Pniel, M.,1998.Overview of Advanced Spaceborne Thermal Emission and Reflectance Radiometer (ASTER).In: IEEE Trans. Geosci. Remote Sens., 36, pp. 1062−1071, doi: 10.1109/36.700991 .
- Meng, Li, Chuanjiang, He and Yi, Zhan,2011.Adaptive level-set evolution without initial contours for image segmentation, J. Electron. Imaging 20, 023004 , doi:10.1117/ 1.3574 770.
- Tang, T. W., & Chung, A. C. (2007). Non-rigid image registration using graph-cuts. In Medical Image Computing and Computer-Assisted Intervention–MICCAI 2007 (pp. 916-924). Springer Berlin Heidelberg.
- Kato, Z., Pong, T.C., Chung-Mong, L.,2001.Color image segmentation and parameter estimation in a Markovian framework, Pattern Recognition Letters 22 (3–4) 309–321.
- Miller, M.I., Joshi, S.C. and Christensen, G.E.,1998.Large deformation fluid diffeomorphisms for landmark and image matching. In: Toga, A., ed.: Brain Warping.
- Boykov, Y., Lee, V.S., Rusinek, H., Bansal, R.,2001b. Segmentation of dynamic N-D data sets via graph cuts using markov models. In Medical Image Computing and Computer-Assisted Intervention, (MICCAI), pp. 1058-1066. Crossref
- Greig, D., Porteous, B., Seheult, A.,1989. Exact maximum a posteriori estimation for binary images. Journal of the Royal Statistical Society. Series B, 51(2):271–279.
- Veksler, O. and Boykov, Y.,2004. Fast approximate energy minimization via graph cuts.In: PAMI, vol. 23 (11), pp. 1222–1239.
- Sun, W., Xu, G., Gong, P., Liang, S.,2006. Fractal Analysis of Remotely Sensed Images: A review of methods and applications, Review Article, International Journal of Remote Sensing, Vol. 27, No. 22, 4963-4990.
- CHEN Yong and CHEN Ling. 1998. The Fractal Geometry [M]. Beijing: Seismological Press, 163~167 (in Chinese).
- Lombaert H., Sun Y., Cheriet F. Landmark-Based Non-rigid Registration Via Graph Cuts. In: Proc. of the 4th International Conference, ICIAR 2007, LNCS, Vol. 4633, pp.166~175,2007.
- Frieden, B. R.,1972. Restoring with maximum likelihood and maximum entropy, Journal of Optical Society America, 62:511–518.
- Lu C. , Mai Y.-W. and Xie H. A sudden drop of fractal dimension: a likely precursor of catastrophic failure in disordered media, Philosophical Magazine Letters,Vol. 85(1),pg 33–40,2005.
- Kohli, P., Ladicky, L., Torr, P.H.S.,2009. Robust Higher Order Potentials for Enforcing Label Consistency," International Journal of Computer Vision, vol. 82, 302-324.
- Boykov, Ya.,Veksler, O.and Zabih, R., 1998. Markov random fields with efficient approximations. In: IEEE Conference on Computer Vision and Pattern Recognition,Vol:23(11); pages 648-655,doi: 10.1109/CVPR.1998.698673.
- Kolmogorov, V. and Zabih, R.,2005. What energy functions can be minimized via graph cuts?" In: IEEE Transactions on PAMI, vol. 26 (2), pp. 147–159.
- Boykov, Y. and Jolly, M.P., 2001,Interactive Graph Cuts for Optimal Boundary & Region Segmentation of Objects in N-d Images. In: International Conference on Computer Vision, (ICCV), vol. I, pp. 105-112. [Crossref]
- Li, Y., Sun, J. Tang, C. K., Shum, H. Y.,2007.Lazy Snapping. In:Proceedings of ACMSIGGRAPH pp:303-308.
- So R.W.K. and. Chung, A.C.S. Learning-based Non-rigid Image Registration using Prior Joint Intensity Distributions with Graph-Cuts, The 18th International Conference on Image Processing, ICIP, (ICIP'11), Brussels, Belgium, September 11 – 14, 2011, pp. 717 – 720.
- Rother, C., Blake, A., and Kolmogorov, V. ,2004. Graphcut - Interactive Foreground Extraction Using Iterated Graph Cuts. In:Proceedings of SIGGRAPH,pp.309-314 doi:10.1145/1015706.1015720.
- Vezhnevets, V. and Konouchine, V.,2005. GrowCut: Interactive multi- label N-D image segmentation by cellular automata, Proc. of Graphicon, pp.150–156.
