A Module Coupling Slice Based Test Case Prioritization Technique

Author: Harish Kumar, Naresh Chauhan
Journal: International Journal of Modern Education and Computer Science (IJMECS) @ijmecs
Article in issue: 7 vol.7, 2015.
Free access
Regression testing is a process that executes subset of tests that have already been conducted to ensure that changes have not propagated unintended side effects. Test case prioritization aims at reordering the regression test suit based on certain criteria, so that the test cases with higher priority can be executed first rather than those with lower priority. In this paper, a new approach for test case prioritization has been proposed which is based on a module-coupling effect that considers the module-coupling value for the purpose of prioritizing the modules in the software so that critical modules can be identified which in turn will find the prioritized set of test cases. In this way there will be high percentage of detecting critical errors that have been propagated to other modules due to any change in a module. The proposed approach has been evaluated with a case study of software consisting of ten modules.
Regression Testing, Test Case Prioritization, Coupling & Cohesion, Software Testing
Short address: https://sciup.org/15014772
IDR: 15014772
Text of the scientific article A Module Coupling Slice Based Test Case Prioritization Technique
Published Online July 2015 in MECS DOI: 10.5815/ijmecs.2015.07.02
Regression Testing [9, 13] is the selective retesting of a system or a component to verify that modifications have not caused unintended effects and the system or component is still in accordance with its specified requirements. The purpose of regression testing is to ensure that bug-fixes and new functionalities introduced in a new version of the software do not adversely affected the correct functionality inherited from the previous version. To make regression testing easier, software engineers typically reuse test suites of the original program, but also new test cases may be required to test new functionalities of the new version. Regression Testing is considered a problem, as the existing test suite with probable additional test cases need to be tested again and again whenever there is a modification. It involves lot of efforts, resources and cost. So there is need for a mechanism to reduce these efforts, resources and cost. One methodology used for this purpose is the test case prioritization [9, 13]. Test case prioritization aims at reordering the test cases based on certain criteria, so that the test cases with higher priority can be executed first rather than those with lower priority. A lot of work has been already done in the area of test case prioritization.
But all the existing prioritization techniques do not consider the effect of changes in one module being propagated in other modules of the software. These techniques are not able to prioritize the modules and their test cases which are badly affected with the changes. Most of the prioritization techniques consider all the test cases, prioritize them with some criterion like risk based prioritization, coverage based, fault detection rate, etc and find out the prioritized test cases with the aim of getting high fault detection. But, it becomes cumbersome to analyze the prioritization techniques by finding fault detection rate of all test cases in the test suite. Instead of this, if the approach is to find out the module/modules which are badly affected and then prioritize the test cases, this will provide the high severity bugs very early. With keeping this approach in mind, a test case prioritization technique based on coupling effect has been proposed in this paper.
Section 2 of this paper discusses about the related work which has been done in the area of test case prioritization, Section 3 covers the proposed approach and algorithm used for test case prioritization on the basis of the coupling information among different modules, Section 4 covers the evaluation and result analysis of the proposed approach and Section 5 briefs the conclusion.
-
A. Call Graph
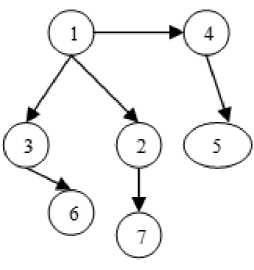
Fig.1. Call Graph
The architectural design for coupling information between modules can be depicted in the form of a Call graph. A call graph [13] is a directed graph that represents calling relationships between modules in a program wherein nodes are modules or units and a directed edge from one node to another node means one module has called another module as shown in Figure 1.
-
B. Module Dependency Matrix
Module dependence [14, 15] is primarily affected by coupling and cohesion. A quantitative measure of the dependence of modules will be useful to find out the stability of the design. Different values [14,15] are assigned for various types of module coupling and cohesion as shown in Table 1 and Table 2.
Table 1. Coupling
|
Coupling |
Value |
|
Content |
0.95 |
|
Common |
0.70 |
|
External |
0.60 |
|
Control |
0.50 |
|
Stamp |
0.35 |
|
Data |
0.20 |
A matrix can be obtained by using these two tables, which gives the dependence among all the modules in a program. This, dependence matrix describes the probability of having to change module i, given that module j has been changed.
Table 2. Cohesion
|
Cohesion |
Value |
|
Coincidental |
0.95 |
|
Logical |
0.40 |
|
Temporal |
0.60 |
|
Procedural |
0.40 |
|
Communicational |
0.25 |
|
Sequential |
0.20 |
|
Functional |
0.20 |
Module Dependence Matrix is derived using the following three steps.
STEP 1. Determine the coupling among all of the modules in the program. Construct an m*m coupling matrix, where m is the number of modules in the program. Using Table 1 fill each element in the matrix C. Element Cij represents the coupling between module i and module j. The matrix is symmetric i.e.
Also elements on the diagonal are all 1(Cii =1 for all i)
STEP 2. Determine strength of each module in the program. Using Table 2. record the corresponding numerical values of cohesion in module cohesion matrix.
STEP 3. Construct the Module dependence matrix D by the formula1:
Dij = 0.15 (Si + Sj) + 0.7 Cij, where Cij ≠ 0
Dij = 0 where Cij = 0 Dii = 1 for all i. (1)
-
II. Related Work
Amrita Jyoti, Yogesh Kumar Sharma [4] has proposed a model that achieves 100% code coverage optimally during version specific regression testing. The prioritization of test cases was done on the basis of priority value of the modified lines covered by the test case.
Praveen Ranjan Srivastava [3] presented a test case prioritization technique to compute average faults discovered per minute. Using APFD (Average Percentage of Fault Detection) metric results demonstrating the effectiveness of the algorithm was presented.
-
R. Kavitha et. al. [1] proposed an algorithm that performs rate of fault detection and fault impact based prioritization of test cases. They demonstrated that more effective severe fault identification at earlier stages of the testing process could be obtained by the proposed algorithm for prioritized test cases as compared to non prioritized test cases.
Md. Imrul kayes [2] proposed a new metric for accessing rate of fault dependency detection and an algorithm for prioritizing the test cases. The proposed technique prioritized the test cases with the goal of maximizing the number of faults dependency detection that are likely to be found during the execution of the prioritized test suite.
-
J. Rummel et. al [6] proposed an approach to regression test prioritization that leverages the all-DUs (definition-use) test adequacy criterion that focuses on the definition and use of variables within the program under test. DU-paths which are variable usage paths are taken for the test cases prioritization.
Arvinder Kaur, Shubhra Goyal [8] proposed a Genetic algorithm for prioritizing the test suite on the basis of the complete code coverage. The proposed genetic algorithm was also used to automate the process of test case prioritization.
Thillaikarasi Muthusamy et. al. [12] proposed a technique which prioritizes the test cases based on four groups of practical weight factor such as: customer allotted priority, developer observed code execution complexity, changes in requirements, fault impact, completeness and traceability.
M.Kalaiyarasan, Dr.H.Yasminroja [11] proposed a version specific test case prioritization technique which uses data flow information. The proposed technique considered the fault detection capabilities of test cases for prioritization purpose. They find out four different categories of software modification and use the data flow information for prioritization purpose.
A critical study of test case prioritization techniques [9] discussed above indicates that these techniques do not consider the effect of changes in one module being propagated in other modules of the software. These techniques are not able to prioritize the modules and their test cases which are badly affected with the changes. Most of the prioritization techniques consider all the test cases, prioritize them with some criterion like risk based prioritization, coverage based, fault detection rate, etc and find out the prioritized test cases with the aim of getting high fault detection. But, it becomes cumbersome to analyze the prioritization techniques by finding fault detection rate of all test cases in the test suite. Instead of this, if the approach is to find out the module/modules which are badly affected and then prioritize the test cases, this will provide the high severity bugs very early.
-
III. Proposed Work
In this work [10] a new technique to prioritize the test cases has been proposed .This technique is based on the module dependence and coupling between the modules. This technique proceeds in two steps. In the first step, we find out the highly affected module whenever there is a change in a module. In the second step we prioritize the test cases of the affected module found out in the first step. In both the steps coupling information between the modules has been taken.
Whenever there is a change in a module, certainly there will be some effect on other modules which are coupled together. Based on the coupling information between the modules the highly affected module can be found out. Moreover, the effect is worse if there is high coupling between the modules causing the high probability of errors. This may be called as modulecoupling effect . In this way if regression test case prioritization is done based on this module coupling effect, there will be high percentage of detecting critical errors that have been propagated to other modules due to any change in a module.
For example in Fig.2 the modules 17 and 18 are being called by multiple modules. If there is any change in module 17 and module 18, modules 9, 11 and 12, 13 will be affected respectively. If there is no prioritization, then as a part of regression testing process, all the test cases of all the affected modules will be executed thereby increasing the testing time and effort. Instead, if the coupling type between modules is known, then a prioritization scheme can be developed based on this coupling information. The modules having worst type of coupling will be prioritized over other modules and their test cases.
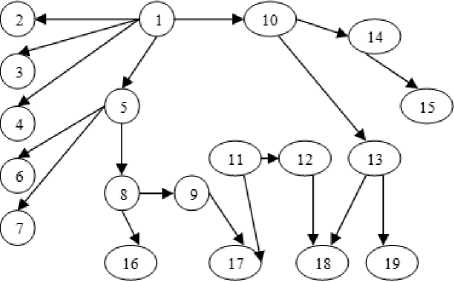
Fig.2. Example Call Graph
After finding out the affected module due to a change in a module, there is need to execute the test cases of this affected module. However, there may be a large number of test cases in this module. Therefore, there is need to prioritize these test cases also so that critical bugs can be found out quickly. For this purpose, based on the coupling information between the changed module and affected module, a coupling slice can be prepared that helps in prioritizing the test cases.
The functioning of the proposed technique consists of the following components (shown in Fig. 3).
Call Graph Producer:
With this component, a call graph can be produced for the given program. Using this component, the calling sequence among the modules can be known.
Coupling and Cohesion Identifier:
Using the call graph producer component the type of dependency among the modules is identified, i.e. coupling and cohesion.
First Order Dependence Matrix Calculator: This component performs four major functions which are described below.
-
1. Creation of coupling matrix C.
-
2. Creation of cohesion matrix S.
-
3. On the basis of C and S create dependency matrix D.
-
4. Assigning values (non zero and non one entries) to the edges of the call graph.
Coupling Effect based module level Prioritizer:
The first order dependence matrix provides the coupling values among the modules. Using these values, this component identifies the worst affected module due to the changed module. Thereby we get a prioritized module among several affected modules.
Coupling Slice based test case prioritizer:
This component is responsible for prioritizing the test cases of the prioritized module obtained in the last step. This component prioritizes the test cases based on the information produced by a coupling slice.
Call Graph Producer z * =x
I .
First Order Dependence matrix Calculator
Coupling Effect Based Module Level Prioritizer
*
Coupling Slice Information Based Test Case Prioritizer l ~
Prioritized Test Suite of Critical
Module
Fig.3. 2-step process of prioritization
-
B. Proposed Algorithm for prioritizing test cases of highly affected module
All the statements numbers present in the execution history of a program comprises execution slice of a program. Coupling information can be helpful to decide which variables are affected in the caller module. Depending upon this information statement numbers of affected variables can be found. This may be called as a coupling slice. In the end match these statements numbers in the execution slice. After matching it, prioritize test cases using algorithm shown in fig 5.
COUPLING_EFFECT_EXECUTION_SLICE (p, c)
Where p is the badly affected module and c is the changed module
Begin
-
1. Find Execution Slice of each test case of test suite of affected module (p).
-
2. Identify statement numbers (s1, s2, s3…) of p which are affected by modification in c depending upon coupling information.
-
3. Match (s1, s2, s3…) in execution slice of test cases of p module.
-
4. Prioritize test cases of p module by considering number of entries in the execution slice of the test cases.
End
Fig.5. Algorithm for prioritizing test cases of highly affected module.
Since there are different types of coupling, there may be different coupling slices based on the coupling information about the modules. The various algorithms for extracting coupling slices have been given in fig. 6 to fig.9.
-
A. Proposed Algorithm for finding out the highly coupled module
First of all a coupling matrix is created by finding coupling values among different modules. After creating a coupling matrix, a cohesion matrix is created by identifying the type of cohesion in the individual module. Now, by using these two matrices a module dependence matrix is created. After this a module which is changing is identified. Finally the parent module of the changed module is identified with the help of module dependency matrix. The module with the highest value is prioritized over other modules. The proposed algorithm [10] is shown in Fig.4.
PRIORITIZATION (P, n)
Begin
(Where P is the complete program and n is number of modules)
-
1. Identify type of coupling between modules and create coupling matrix C using coupling values.
-
2. Identify type of cohesion in the individual module and create cohesion matrix S using cohesion values .
-
3. Using C and S Matrix construct first order dependence matrix D.
-
4. Identify which module number is changing(c).
-
5. Identify parent (p) of changed module using first order dependence matrix (D) values.
(Highest value module will get priority over other module)
End
DATA COUPLING (m, s): m denote module number, s denote statement number
STEP 1 Note down the variables (v1, v2, v3…) present in the changed statement (s) in module m.
STEP 2 Find out formal parameters, function name and accordingly reach to actual arguments.
STEP 3 Find out affected line numbers in caller module from the execution slice in which actual arguments and variables (v1, v2, v3.) are present.
Fig.6 Algorithm for extracting coupling slice for data coupling
STAMP COUPLING (m, s): m denote module number, s denote statement number
STEP 1 Note down the variables (v1, v2, v3…) and objects present in the changed statement (s) in module m.
STEP 2 Find out formal parameters and accordingly reach to actual arguments.
STEP 3 Find out affected line numbers in caller module from the execution slice in which actual arguments, objects and variables (v1, v2, v3...) are present.
Fig.7 Algorithm for extracting coupling slice for stamp coupling
Fig.4. Algorithm for finding highly coupled module
CONTROL COUPLING (m, s): m denote module number, s denote statement number
STEP 1 Note down the variables (v1, v2, v3…) and objects present in the changed statement (s) in module m.
STEP 2 Find out function name.
STEP 3 Find out now in which case this function is present.
STEP 4 Find out argument (a) of switch statement.
STEP 5 Check the place from where this argument (a) is coming.
STEPS 6 Finally reach to the caller module.
STEP 7 Find out affected line numbers in caller module’s execution slice in which arguments are present.
Fig.8. Algorithm for extracting coupling slice for control coupling
COMMON COUPLING (m, s): m denotes module number, s denotes statement number
STEP 1 Note down the variable (Common) present in the changed statement (s) in module m.
STEP 2 Find out line numbers from execution slice in other module in which that common variable is coming.
Table 4. Cohesion Information
|
Module Number |
Cohesion Type |
|
1 |
Coincidental |
|
2 |
Functional |
|
3 |
Communicational |
|
4 |
Logical |
|
5 |
Procedural |
|
6 |
Functional |
|
7 |
Functional |
|
8 |
Functional |
|
9 |
Functional |
|
10 |
Functional |
By using the coupling values among different modules a module coupling matrix is being prepared as shown in Table 5.
Fig.9. Algorithm for extracting coupling slice for Common coupling
To evaluate the proposed algorithm consider a case study of software [13] consisting of 10 modules has been taken. The coupling and cohesion information of these modules are shown in Table 3 and Table 4. The Call graph for the software is shown in fig.10.
Fig.10. Call Graph of Case Study Software
Table 5. Module Coupling Matrix(C)
|
1.0 |
0.2 |
0.35 |
0.2 |
0.95 |
0.2 |
0.0 |
0.0 |
0.0 |
0.0 |
|
0.0 |
1.0 |
0.0 |
0.0 |
0.70 |
0.2 |
0.0 |
0.0 |
0.0 |
0.0 |
|
0.0 |
0.0 |
1.0 |
0.0 |
0.0 |
0.0 |
0.2 |
0.0 |
0.0 |
0.0 |
|
0.0 |
0.0 |
0.0 |
1.0 |
0.0 |
0.0 |
0.50 |
0.50 |
0.50 |
0.50 |
|
0.0 |
0.2 |
0.0 |
0.0 |
1.0 |
0.0 |
0.0 |
0.0 |
0.70 |
0.0 |
|
0.0 |
0.2 |
0.0 |
0.0 |
0.0 |
1.0 |
0.0 |
0.0 |
0.0 |
0.0 |
|
0.0 |
0.0 |
0.2 |
0.0 |
0.0 |
0.0 |
1.0 |
0.6 |
0.0 |
0.0 |
|
0.0 |
0.0 |
0.0 |
0.2 |
0.0 |
0.0 |
0.6 |
1.0 |
0.2 |
0.2 |
|
0.0 |
0.0 |
0.0 |
0.0 |
0.0 |
0.0 |
0.0 |
0.2 |
1.0 |
0.0 |
|
0.0 |
0.0 |
0.0 |
0.0 |
0.0 |
0.0 |
0.0 |
0.2 |
0.0 |
1.0 |
By Using the value of Cohesion among different modules a Cohesion Matrix(S) is being designed as shown in Table 6.
Table 6. Module Cohesion Matrix (S)
|
0.95 |
0.2 |
0.25 |
0.4 |
0.4 |
0.2 |
0.2 |
0.2 |
0.2 |
0.2 |
By using Formula 1, a Module dependence Matrix is being designed as shown in Table 7. wherein various module dependence values also have been shown.
Table 3. Coupling Information
|
Type of Coupling |
No. of modules in relation |
Examples |
|
Data Coupling |
3 |
1-2,1-4,1-6 |
|
Stamp Coupling |
1 |
1-3 |
|
Control Coupling |
4 |
4-7,4-8,4-9,4-10 |
|
Common Coupling |
2 |
2-5,5-9 |
|
Message Coupling |
1 |
1-5 |
Table 7. Module Dependence Matrix (D)
|
1.0 |
0.31 |
0.42 |
0.34 |
0.0 |
0.31 |
0.0 |
0.0 |
0.0 |
0.0 |
|
0.31 |
1.0 |
0.0 |
0.0 |
0.58 |
0.0 |
0.0 |
0.0 |
0.0 |
0.0 |
|
0.42 |
0.0 |
1.0 |
0.0 |
0.0 |
0.0 |
0.0 |
0.0 |
0.0 |
0.0 |
|
0.34 |
0.0 |
0.0 |
1.0 |
0.0 |
0.0 |
0.44 |
0.44 |
0.44 |
0.44 |
|
0.0 |
0.58 |
0.0 |
0.0 |
1.0 |
0.0 |
0.0 |
0.0 |
0.58 |
0.0 |
|
0.31 |
0.0 |
0.0 |
0.0 |
0.0 |
1.0 |
0.0 |
0.0 |
0.0 |
0.0 |
|
0.0 |
0.0 |
0.0 |
0.44 |
0.0 |
0.0 |
0.0 |
0.0 |
0.0 |
0.0 |
|
0.0 |
0.0 |
0.0 |
0.44 |
0.0 |
0.0 |
0.0 |
1.0 |
0.0 |
0.0 |
|
0.0 |
0.0 |
0.0 |
0.44 |
0.58 |
0.0 |
0.0 |
0.0 |
1.0 |
0.0 |
|
0.0 |
0.0 |
0.0 |
0.44 |
0.0 |
0.0 |
0.0 |
0.0 |
0.0 |
1.0 |
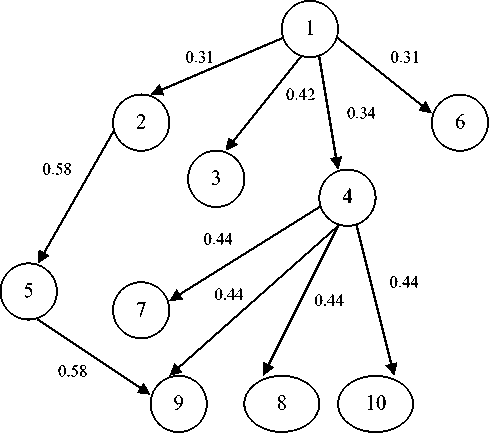
Fig.11. Case Study Software Call Graph with module dependence values
From the module dependence values obtained from call graph (See Fig. 11) and from Module Dependence Matrix, we conclude that change in the Module 4 propagates to module 7, 8, 9 and module 10.Modules 7, 8, 9 and 10 are having same value (0.44), so the order of prioritization of test cases for these modules is same. Similarly the change in the module 1 propagates to Module 2, 3, 4 and 6 .The values for these modules shows that the module 3 is more affected module as compared to module 2, 4 and 6. So the test cases for the module 3 have to be prioritized first as compared to module 2, 4 and 6.
-
A. Demonstration for TCP Using Coupling Slice Technique
Now aim is to prioritize test cases of affected modules using execution slice approach. The test cases of all the modules of the case study software have been designed as shown in Tables from Table 8 to Table 17. Further, the execution slice of each test case of each module has been prepared. After analyzing the coupling information, the coupling slice produces the prioritized test cases.
Test cases for different modules are given below:
Table 8. Module 2 test cases
|
Module -2 |
Input |
Output |
|
|
TC No. |
val1 |
val2 |
sum |
|
1 |
50 |
50 |
101 |
|
2 |
0 |
50 |
51 |
|
3 |
50 |
0 |
51 |
|
4 |
-50 |
-50 |
-99 |
|
5 |
0 |
-98 |
-97 |
|
6 |
-87 |
0 |
-86 |
Table 9. Module 1 Test cases
|
MODULE 1 |
T1 |
T2 |
|
|
INPUT |
n1 |
2 |
s |
|
n2 |
3 |
||
|
e1.empnum |
23 |
||
|
e1.empname |
eeeee |
||
|
e1.salary |
11111 |
11111 |
|
|
flag |
3 |
1 |
|
|
firstn |
Hk |
a |
|
|
lastn |
kumar |
a |
|
|
n |
2 |
2 |
|
|
a |
0 |
0 |
|
|
OUTPUT |
e1.empnum |
1023 |
1000 |
|
e1.salary |
111110 |
111110 |
|
|
result |
6 |
-27964 |
|
|
sum |
16 |
-27966 |
|
|
s |
2 |
2 |
Table 10. Module -3 Test cases
|
Module-3 |
Input(e1) |
Output(e2) |
|
TC No. |
empnum |
empname |
|
1 |
1 |
Aa |
|
2 |
100 |
Gfjki |
|
3 |
80 |
Gk |
Table 11. Module -4 Test Cases
|
Module -4 |
Input |
Output |
|
TC No. |
F |
Department |
|
1 |
1 |
HR |
|
2 |
2 |
FINANCE |
|
3 |
3 |
PRODUCTION |
|
4 |
4 |
PURCHASE |
|
5 |
5 |
Default statement |
Table 12. Module -5 Test Cases
|
Module-5 |
Input |
Output |
|
|
TC No. |
Firstn |
lastn |
sum |
|
1 |
Gaurav |
makkar |
16 |
|
2 |
1234 |
23 |
10 |
Table 13. Module-6 Test Cases
|
Module-6 |
Input |
Output |
|
|
TC No. |
N |
A |
S |
|
1 |
2 |
0 |
2 |
|
2 |
2 |
1 |
4 |
|
3 |
0 |
1 |
0 |
|
Module-7 |
Input |
Output |
|
TC No. |
F |
Department |
|
1 |
1 |
HR |
Table 15. Moduel-8 Test Cases
|
Mod ule-8 |
Input |
Output |
||||
|
Tc No |
f |
Salaries |
Infra |
Maint |
Dept. |
Total |
|
1 |
2 |
100000 |
200000 |
300000 |
Fin. |
600000 |
|
2 |
2 |
0 |
200000 |
300000 |
Fin. |
0 |
Table 16. Module-9 Test Cases
|
Module-9 |
Input |
Output |
|
|
Tc No. |
f |
pro_inc |
Department |
|
1 |
3 |
2.35 |
PRODUCTION |
Table 17. Module-10 Test Cases
|
Module-10 |
Input |
Output |
|||
|
Tc No. |
f |
no |
cost |
Department |
tot |
|
1 |
4 |
2 |
10 |
PRODUCTION |
20 |
|
2 |
4 |
0 |
20 |
PRODUCTION |
0 |
Execution Slice for the test cases of ten modules is given below in Table 18.
Here the test cases of module 3 have to be prioritized as it is the highly affected module. There is stamp coupling between module 1 and module 3. By using algorithm for extracting coupling slice for stamp coupling, the test cases of module 3 have to be prioritized. There are three test cases for module 3 and execution slice for the same in shown in table 18.
By analyzing the execution slice it is clear that in test case 3 more no. of lines in execution history gets affected, in which actual arguments, objects and variables are present. So this test case will expose more faults as compared to other two test cases. So the test case 3 has the highest priority. In the remaining two test cases, equal no. of lines in execution history gets affected. So their order of prioritization is same. The final order of prioritization of test cases of highly affected module i.e. module 3 is TC3, TC1, and TC2.
To show the efficacy of the proposed work some faults in module 3 were intentionally introduced. After this, all three test cases were executed. The table19 shows the faults exposed by the corresponding test cases.
Table 18. Execution Slice
|
Module 1 |
||
|
TC No. |
Execution Slice |
|
|
1 |
{1,2,3,4,5,6,7,8,9,10,11,12,13,14,15,16,17,18,19,20,21,22 ,23,24,25,26,27,28,29,30,31,32} |
|
|
2 |
{1,2,3,4,5,6,8,9,10,11,12,13,14,15,16,17,18,19,20,21,22,2 3,24,25,26,27,28,29,30,31,32} |
|
|
Module 2 |
||
|
TC N0. |
Execution Slice |
|
|
1 |
{1,2} |
|
|
2 |
{1,2} |
|
|
3 |
{1,2} |
|
|
4 |
{1,2} |
|
|
5 |
{1,2} |
|
|
6 |
{1,2} |
|
|
Module -3 |
||
|
TC No. |
Execution Slice |
|
|
1 |
{1,2,5,6,9} |
|
|
2 |
{1,3,4,5,7,8,9} |
|
|
3 |
{1,3,4,5,7,8,9} |
|
|
Module-4 |
||
|
TC No. |
Execution Slice |
|
|
1 |
{1,2,3,4,5,17} |
|
|
2 |
{1,2,6,7,8,17} |
|
|
3 |
{1,2,9,10,11,12,17} |
|
|
4 |
{1,2,9,10,11,12,17} |
|
|
Module-5 |
||
|
TC No. |
Execution Slice |
|
|
1 |
{1,2,3,4,5,6,7,8,9,10,11,14,15,16,17,18,19,22,23,24,2 5,26,27,28} |
|
|
2 |
{1,2,3,4,5,6,7,8,9,10,12,13,14,15,16,17,18,20,21,22,2 3,29,30} |
|
|
Module-6 |
||
|
TC No. |
Execution Slice |
|
|
1 |
{1,2,3,4,5,6,7,8,9,10,11,12,16,17,18,8,9,10,11,12,16, 17,18,8,19,20,21} |
|
|
2 |
{1,2,3,4,5,6,7,8,9,10,11,12,13,14,15,16,17,18,8,9,10, 11,12,13,14,15,16,17,18,8,19,20,21} |
|
|
3 |
{1,22,23} |
|
|
Module -7 |
||
|
TC No. |
Execution Slice |
|
|
1 |
{1,2,3} |
|
|
Module-8 |
||
|
TC No. |
Execution Slice |
|
|
1 |
{1,2,3,4,5,6,7} |
|
|
2 |
{1,2,3,8,9,10,11,12} |
|
|
Module -9 |
||
|
TC No. |
Execution Slice |
|
|
1 |
{1,2,3,4} |
|
|
Module-10 |
||
|
TC No. |
Execution Slice |
|
|
1 |
{1,2,3,4,5,6,7,8,9} |
|
|
2 |
{1,2,3,4,5,10,11,12,13,14} |
|
Table 19. Test cases and faults
|
Faults |
TC1 |
TC2 |
TC3 |
|
F1 |
* |
* |
|
|
F2 |
* |
* |
|
|
F3 |
* |
||
|
F4 |
* |
* |
* |
|
F5 |
* |
* |
Now the APFD value for the random order of test cases and for the prioritized order is calculated using the APFD metric[3].
T=Test suite under evaluation
N =no. of test cases
M=total no. faults
TF i =Position of first test in T that exposed fault i
APFD=1-(TF1+TF2…….TFm) /N*M +1/2N
APFD value for random order (TC1, TC2, TC3) is as follows:
1-(2+1+3+1+1)/(5*3)+1/(2*3)=30.60%
APFD for the prioritized order (TC3, TC1, TC2) is as follows:
1-(1+1+1+1+1)(5*3)/1(2*3)=50.66%
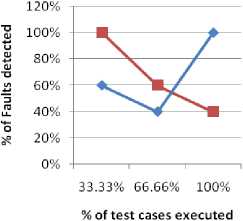
So, the APFD value calculated by applying the proposed approach is more as compared to random approach. It indicates that the prioritized order given by the proposed approach exposes more number of faults as compared to random order of test cases (see Fig. 12).
Comparision Graph of Proposed and Random approach
■ Proposed = 50.66
—•—Random = 30.60
Fig.12. Comparison of random and proposed work
-
V. Conclusion
In this paper a new technique for the test case prioritization has been proposed. The proposed technique has been based on the coupling information among the modules of the program. This has been termed as module-coupling effect based test case prioritization technique. The proposed technique is able to find the critical module with the probability of having critical bugs as compared to other techniques. A sample program [13] consisting of 10 modules has been taken for the analysis purpose of the proposed approach thereby showing the efficacy of the proposed technique.
References A Module Coupling Slice Based Test Case Prioritization Technique
- R.Kavitha, Dr. N. Suresh Kumar" Test Case Prioritization for Regression Testing based on severity of fault" International Journal on Computer Science & Engineering, 2010.
- Md. Imrul Kayes "Test Case Prioritization for Regression Testing based on fault dependency", IEEE 2011.
- Praveen Ranjan Srivastava "Test Case Prioritization" Journal of Theoretical and Applied Information Technology, pp. 178-181, 2005-2008.
- Amrita Jyoti, Yogesh Kumar Sharma, Ashish Bagla, D. Pandey, "Recent Priority Algorithm In Regression Testing", International Journal of Information Technology and Knowledge Management, Volume 2, No. 2, pp. 391-394, July-December 2010.
- Varun Kumar, Sujata and Mohit Kumar, "Test Case Prioritization Using Fault Severity", International Journal of computer science and technology, Vol. 1, No. 1, pp. 67-71, 2010.
- Matthew J.Rummel, Gregory M.Kapfhammer and Andrew Thall, "Towards the prioritization of regression test suites with data flow information". Proceedings of the 2005 ACM symposium on Applied Computing New York, NY, USA.
- Yogesh Kumar, Arvinder Kaur & Bharti Suri "Empirical Validation of variable based Test Case Prioritization / Selection Techniques." International Journal of Digital Content Technology and its applications Vol.3, Number 3.September 2009.
- Arvinder Kaur & Shubhra Goyal, "A genetic algorithm for Regression test case Prioritization using code Coverage" International Journal on Computer Science and Engineering (IJCSE).Vol.3,No.5 May 2011.
- "Identifying and analyzing the research challenges in Test case prioritization" published in International Journal of Computer Science & Engineering System, pages 88-98, Volume No. 6(2012) Issue No. 3(2012), Serial publications.
- Harish Kumar and Naresh Chauhan "A Coupling effect based test case prioritization technique" accepted for publication in 9th INDIACom 2nd international conference on computing for sustainable global development, 2015.
- M.Kalaiyarasan, Dr.H.Yasminroja, "Version Specific Test Suite Prioritization using Dataflow Testing" International Journal of Recent Engineering Science (IJRES), ISSN: 2349-7157, volume 1 issue 4 April, 2014.
- Thillaikarasi Muthusamy, Seetharaman.K, "A New Effective Test Case Prioritization for Regression Testing based on Prioritization Algorithm", International Journal of Applied Information Systems (IJAIS) – ISSN: 2249-0868 Foundation of Computer Science FCS, New York, USA Volume 6– No. 7, January 2014.
- Dr. Naresh Chauhan, "Software Testing – Principle and Practices", Oxford university press, 2010.
- K.K. Aggarwal, Yogesh Singh, Software Engineering, New Age International (P) Ltd., 2001.
- K.K. Aggarwal, Software Engineering, edition 3, New Age International publisher.
