A Multi-Scale Image Enhancement Model using Human Visual System Characteristics

Author: M Venkata Srinu, G Naga Swetha, M Deepthi
Journal: International Journal of Image, Graphics and Signal Processing(IJIGSP) @ijigsp
Article in issue: 6 vol.7, 2015.
Free access
Image enhancement is a fundamental pre-processing step for many automated systems and vision systems. Many enhancement algorithms have been anticipated based on different sets of criteria. One of the most widely used algorithms is the direct multi-scale image enhancement algorithm. The specialty of this algorithm is, it provides contrast enhancement, tonal rendition, dynamic range compression and accurate edge preservation of the images. It also provides these features to the individual images and/or simultaneously to the images. In this proposed method, a multi-scale image enhancement algorithm is established by using parametric contrast measure with the transform techniques such as Laplacian pyramid, discrete wavelet transform, Stationary wavelet transform and Dual-tree complex wavelet transform. The new contrast measure provides both the luminance and contrast masking characteristics of the human visual system. The proposed method is used to attain simultaneous local and global enhancements. The enhancement measures such as Entropy, Mean opinion score and Measure of enhancement gives better results than the existing methods.
Image enhancement, human visual system, luminance masking, contrast masking, multi-scale transforms and dual tree complex wavelet transform
Short address: https://sciup.org/15013876
IDR: 15013876
Text of the scientific article A Multi-Scale Image Enhancement Model using Human Visual System Characteristics
Published Online May 2015 in MECS DOI: 10.5815/ijigsp.2015.06.01
The aim of image enhancement is to get a more visually pleasing image by applying definite changes to an input image. To produce the digital images of excellent contrast brightness, this is a very good constraint in various areas, such as vision, fault recognition, remote sensing and biomedical image analysis [1], [2], [3], [4]. The image is transformed to improve the visual information in the image and producing visually natural images is a necessary requirement for all image processing and vision processing methods. The techniques with the purpose of apply that transformations are referred as image enhancement techniques [5], [6], and [7].
Mostly, image enhancement methods can be divided into two types that are indirect image enhancement methods and direct image enhancement methods. The methods belong to a class of indirect contrast image enhancement methods, since without measuring the contrast, they improve an image. The algorithms are defined as direct contrast image enhancement methods because they create a principle regarding contrast measure and directly improve image enhancement by modifying the measurement of contrast.
Since, the HVS is an excellent image processor capable of detecting and recognizing image information, it is a mathematical model to bridge the gap between these psychophysical attributes and the way in which images are represented and manipulated [1], [8], and [9]. HVS is a sensitive to relative changes in background and not complete changes of luminance of the image [10]. This phenomenon is known as the luminance masking (LM) characteristic of the HVS. The reaction of the HVS to local contrast is highly affected by its surrounding stimuli. This phenomenon is known as the contrast masking (CM) of the HVS. In this method, the image gradient is first calculated. And then, this gradient is masked by the background luminance, obtaining the LM gradient. Lastly, the LM gradient is masked by a local activity map, which is a function of the LM gradient, producing the luminance and contrast masked (LCM) gradient. A related methodology contains both the LM and CM characteristics of the HVS, so as to get Dual-tree complex wavelet transform (DT-CWT) for image enhancement. Finally, a novel image enhancement algorithm is presented depend upon the proposed HVS-inspired contrast coefficients using DT-CWT.
The rest of this paper organized as follows: section II describes luminance and contrast masking of the HVS, section II deals about multi-scale transforms, which are commonly used in image processing and as well as the transform coefficient mapping techniques, which have been used for contrast enhancement in section IV. Section V discussed about performance of the proposed method and the experimental results. Section VI draws the conclusion based on these experimental results.
II. Human Visual System
The HVS can be regarded as a multi-scale device and analyzing images at their many scales. In addition, the contrast which is perceived by the HVS is both a function of the local background luminance and local activity. Later these characteristics will be integrated into the proposed multi scale contrast measures and transforms, which are eventually utilized to attain direct image enhancement.
-
A. The HVS Characteristics
The human eye functions as a transducer, focusing light from objects in a field of view and converting them to electrical signals processed by the brain. The incident light is refracted through the cornea and passes through the pupil. Further the lens reflects this light, eventually projecting an image onto the retina. The retina can be perceived as a group of neurons assembled in a way that they form a set of apertures whose receptive fields differ widely in size.
These neurons are photo receptors which allow incoming photons, which have been refracted onto them and synapse onto cells, which eventually cause electrical signals to reach the visual cortex [11]. The two main forms of photo receptors create on the retina are the rods and the cones. The central position of retina is situated by cones are termed as the fovea, as rods are normally distributed away from the fovea. Cones are able of resolving fine details, since each one is related to their individual nerve end, even as rods are capable of only providing a general thought of the field of view, since many rods are attached to the individual nerve end. As the rods and cones work all together and capture details at different resolutions.
An image is represented as a family of gradually smoothed images and the difference between successive smoothed images by taking consideration of the HVS [12], [13]. An image is segmented by the representation of human visual system based image enhancement depends on the gradient and the background intensity. A function of background illumination is identified the changes in the less gradient of the human visual system and is approximated with the four regions is illustrated in the Fig.1. The saturation region is obtain at more illuminated regions, proper illuminated regions is known as weber region, the Devries-Rose region is responsible for under illuminated areas and the dark region contains all the pixels below the curve.
-
B. Luminance Masking
Luminance is a photometric measure of luminous intensity per unit area of light travelling in a given direction and thus it is an indicator of how bright the image will appear. The HVS perceives the luminance changes with background intensity values. These luminance differences varies with background illumination this phenomenon is called Luminance masking. The luminance changes are perceived relatively by the human visual system for a large range of background intensity values [14]. Fig. 1 shows the piecewise characterization of HVS and also called as the Buchsbaum curve. In its most common form, the dependence of the Just Not Differentiable (JND) threshold ∆B T given a background illumination B and absolute luminance difference ∆B and is given by
∆ вт = ∆ в^ (1)
The background intensity values in the dark region are between 0 and an intensity p 1, γ = 0, indicates that the background intensity is independent to the perceived contrast. Hence, the value of γ for the saturation region, devries-rose region and weber regions are given as γ = 0 . 5, γ = 1 and γ = 2 respectively. The human visual system operates in the Weber region, where the JND threshold is inversely proportional to the background illumination for a huge range of background intensities.
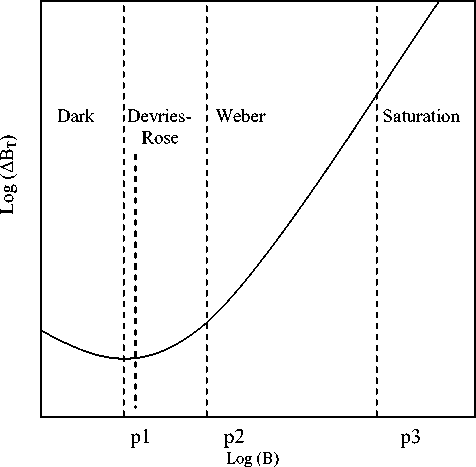
Fig. 1. Perceived contrast as a function of background luminance.
Accordingly, there has usually been a stronger importance on the LM phenomena working in the Weber region. Practically, the Weber contrast of an image I can be measured by
Cweber = (2)
Where k is represents the background luminance perceived by standardized average or Gaussian filtering. The weber contrast in a uniform background is accurately measure the contrast used at patterns where the small features are present. In which, the μ is the background luminance approximately. Hence, it is useful to an image I to be represented in terms of its weber contrast is represented by
I= k (1+ ^Weber ) (3)
Mostly, Michelson contrast [3], [9] is appropriate for calculating the contrast in dark and bright features are identical. The background luminance and local luminance difference is specified by the average and difference of the local minimum and maximum intensity value in the LM phenomena.
-
C. Contrast Masking
Contrast masking is intended to increase the apparent sharpness of an image. The HVS is responsive not only to relative changes in luminance, but also to relative changes in contrast. This spatial masking effect is that the HVS is more perceptive to additive white noise in soft areas of an image than in regions of high contrast, which contain more details [15], [16]. It was observed as sine wave grating signal, the contrast detection threshold Ct , masking contrast C due to CM can be modeled by the expression
Ct = [g(f) C] 0. 62 (4)
Where g (f) is a frequency dependent sensitivity factor, which decreased the masker deviated from 2 cycles per degree (cpd) frequently. The important human visual system perception phenomenon is the contrast masking and is referred as the visibility decrease in one visual component. Normally, the spatial variation is high and the noise becomes less visible in the regions and more visible in smooth area regions. The value of contrast masking is almost zero at smooth region, because there is little spatial variation.
-
III. M ulti -S cale C ontrast E nhancement
-
A. Multi-Scale Transforms
Multiscale image transforms are used to develop filter based representations to decompose the images into component parts, to take out features of interest, and to attenuate noise. Generally, each transform will create an approximation coefficient sub-band z ( ) and a set of oriented detail coefficient subbands z ( ) , where i = 1. . .isb at decomposition level n .
The Laplacian pyramid (LP) generation is used the differences among consecutive scales of the Gaussian pyramid to give a multi scale representation of an image I.
The generation of detail coefficients Z (n ) and approximation coefficients Z (n ) of each and every analysis stage on scale n . At first, initialize Z (n ) = I, the approximation coefficients of a scale n > 0 are obtained by
(")= REDUCE ( z( ))(5)
Where
REDUCE (x) = [ԝ∗х]↓2(6)
A Gaussian smoothing filter is w and [.]↓2 denoted as the down sampling operation. Then, at scale n the detail coefficients are calculated by
(" )= z( 11)- EXPAND (z( n+l ))(7)
Where
EXPAND (x) = w ∗[X]↓2(8)
And the up-sampling operation is denoted as [.]↑2 . At the highest decomposition level N , the synthesis process starts from the approximation coefficients.
The term highest level of decomposition is of use to refer to the coefficients which are considered after performing multi-scale decomposition procedure N times, where N indicates the number of scales where the image signal is to be decomposed.
The approximation coefficients are reconstructed by each synthesis level at a scale n< N by
(" ) = z ( n ) +EXPAND (z ( n+l ) ) (9)
Discrete Wavelet Transform (DWT) is the most important tool intended for analyzing and extracting the content from non-stationary signal owing to the time varying nature of these signals, such as speech signals. DWT [17] is useful in order to decompose an input image into different subbands. Hence, this procedure gives the detailed three sub images that are HL, HL and HH corresponding to three different directional orientations such as horizontal, vertical and diagonal, and the lower resolution sub image LL.
SWT has equivalent length wavelet coefficients at each and every level. The redundant illustration makes SWT [18] shift-invariant and suitable for applications for example edge detection, Denoising and data fusion. The SWT methodology is very easy and is somewhat similar to the DWT. Subsequently, at the level 1 the detail and approximation coefficients are the same size of signal length.
Similar to the DWT, the dual-tree complex wavelet transform (DT-CWT) is a multi-resolution transform with decimated subbands is used is generate the input. DT-CWT accomplishes this by using two filter banks and thus two bases.
Given two filter banks { h 0 (n) , h 1 (n) } and { g 0 (n) , g 1 (n) }, the 2D DT-CWT calculates 4 DWTs in parallel, F hh , F gg , F gh , and F hg , where Fgh denotes a wavelet transform yielded using filters gk(n) along the rows and filters hk (n) along columns, with the value k = 0, 1. Consequent analysis of their ideal Fourier supports shows that these complex sub-bands are oriented at ±15°, ±45° and ±75°.
Therefore, the DT-CWT has added directionality relative to the DWT and SWT, is nearly shift invariant, and is less redundant relative to the SWT. The filters used by the DT-CWT [19] which approximately satisfies the desired conditions of perfect reconstruction and analyticity.
-
B. Image Contrast Measures
The establishment of an appropriate contrast measure is a crucial step in the direct image enhancement process. The subjective and objective measurement quality of image enhancement method, the universal measure is not there. Initially, the desired characteristics of an image are measured, which is contrast. At second, the comparative relationship between the decrease and increasing of their characteristics is exemplified. Measures of enhancement (EME), Entropy have been used as enhancement measures.
There are two definitions for the contrast measurement, which are Michelson and Weber contrast measures. Michelson contrast measure is of use in periodic patterns that are sinusoidal gratings. Weber contrast measure is of use in large uniform luminance backgrounds by small test targets, especially for the images. Many existing direct contrast enhancement algorithms are based on the processing of detail transform coefficients, where the multi scale contrast is defined by using the difference in intensity values. Now, the multi scale contrast measure, regardless of the transform which can be used, generally be expressed by
■ (n)=„(n)
i z I
Where C^t the directive contrast of the same scale and orientation is z^ .
Even if, the changes in luminance values are related to the perceived contrast, these cannot be set among the HVS masking features. Since, it gives permit to the direct image enhancement formulation, many multi-scale contrast measures have been formulated based on the Weber contrast. The earliest multi-scale analogue of Weber contrast was anticipated in the LP domain by Toet. It is defined by c (n)=____zD____
1 EXP AND ( z ^t)
And form the basis of the Contrast Pyramid (CP). To incorporate the added directionality of the DWT relative to the LP, a multi-scale Weber-like contrast measure was adapted to the DWT, given by
(n) №t _zi i z (n)
The optimal enhanced image is not identified and cannot be used for evaluation purposes. There are a number of image contrast measures, which can be defined for the use of image contrast to measure enhancement in the image.
IV. Hvs Based Image Enhancement
The proposed direct multi scale image enhancement based on HVS characteristics is formulated. At first, new multi-scale contrast measures are presented in each of the transform domains and are interpreted as the basis for a new class of HVS-inspired multi-scale transforms. Secondly, an image enhancement approaches based on the new HVS-based transforms are developed. A direct means of adjusting the global brightness of the output is presented, the local entities of an image and the contrast enhancement taken care of. The known approximation and detail coefficients yielded by using a standard multiscale transform, first the new contrast measure measures the LM contrast.
In the LP domain, the LM contrast is given by
( )
' LM
( )
a 1 + |z < n+ ^ )p'1
Where a 1 is a small non-negative constant, γ1 is a parameter that is controlled the quantity, which the background luminance affects the contrast of luminance masked as well as y is the expand function.
For the Laplacian pyramid, the expansion is given by z=EXPAND (|z|) (14)
And for the wavelet- based methods, it is given by y= gR * [gc * [iyilT2 r]t2c (15)
Where [. ]t2Rand [. ] t2c denote up-sampling operations along rows and columns respectively. LM contrast is then masked with a local activity measure which is a function of the LM contrast, to give up the proposed LCM contrast. Here, the context of the LP, the multi-scale LCM contrast is defined as
’ (n) CLM
'LCM i^r
Where a 2 is small non negative constant and γ 2 is parameter controlled the quantity. This method is illustrated in Fig. 2. The standard transform coefficients can be recovered from the multi-scale LCM coefficients. For all transforms (LP, DWT, SWT and DT-CWT), the LM contrast can be computed from the LCM contrast by
С&)=С L&. [s2 + |С£ГТ 2 ] (17)
And the detail coefficients are computed in terms of the LM contrast by
^Ч* . Ч ■ z (18)
The standard synthesis processes can then be used to reconstruct the image. The steps of analysis and synthesis are required to determine each of these HVS-inspired transforms is given in the table 1. In each case, first the analysis stage masks detail coefficients by compute of local luminance and then by evaluate of local activity to yield the HVS-inspired contrast. Each synthesis stage recovers the details coefficients from the HVS contrast coefficients.
A new and novel direct image enhancement method is proposed based the newly proposed contrast measures and transforms. The proposed image enhancement algorithm of block diagram is illustrated in the Fig.3. A forward HVS multi-scale transform can be applied to an original image.
The image brightness is adjusted by varying the approximation coefficient subband at the highest level of decomposition. Non-linear contrast mapping is applied to the human visual contrast coefficient subbands at each orientation and level of decomposition. In this stage, both contrast enhancement and dynamic range compression can be applied.
Finally, the inverse HVS transform is performed, yielding the enhanced image. The requirement is that the direct enhancement procedure must give up a visually satisfying level of brightness. Hence, decomposing an input image into its multiple subbands, first the brightness of the image is adjusted.
One of the most common means of brightness adjustment is with a power law transformation. Though, power law transformations will perform simultaneous dynamic range compression, brightness adjustments. Yet, they will not be accurately conserve edges as the local edge content is randomly treated. However again, in the case of the LP, the brightness of the image is tuned with the brightness parameter L by z0(№)= z^+L (19)
With L = 0, the current brightness level of the image is preserved.
In particular, if the contrast at a given scale is to be enhanced, areas of low contrast should be improved more than the areas of high contrast and the non-linear contrast mapping function should not cause smoothing.
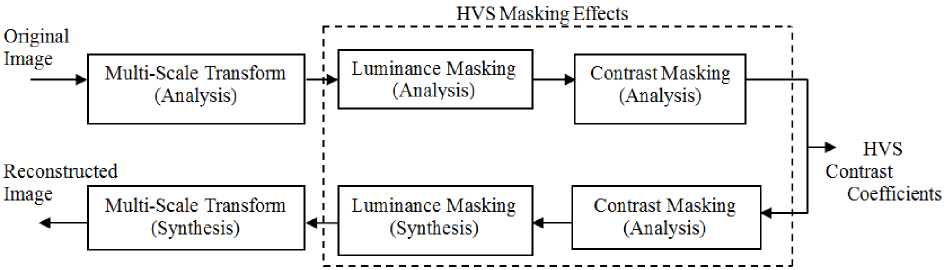
Fig. 2. Block diagram of the proposed HVS-inspired multi-scale transforms.
Table 1. - Analysis and Synthesis stages of Proposed HVS-Inspired Multi-Scale Transforms
|
ANALYSIS |
SYNTHESIS |
|||
|
LM |
CM |
CM |
LM |
|
|
HVS-LP |
- LM n+i^r1 |
to) CLM LCM 12wf |
C^’ = C^M .[s 2 + |Ct (r «Г2 ] |
z (n) = 1 +|z" ("+^f . ] |
|
HVS-DWT |
r to)_ ^ LM H +i^r1 |
r to, (LM LCM 12 d^1,|’'2 |
C^ ’ = C^M .[s - .■ «Г2] |
z (n) = 1 +|z" ("+^f . ] |
|
HVS-SWT |
" + |
(») C LC“ i2d^i’'2 |
cS ’ = c^M .[s 2 + |Ct (r «f2 ] |
z . i +|z (" . ] |
|
HVS-DT-CWT |
r to _ ^n) LM 11+1.•..•■■■'■ |
г (n)= CLM LC" 12 ^^Г2 |
rto)^rto) , Ir("+уIх21 C LM C LCM -[ s2 + |C LM | ] |
■ ■ . |
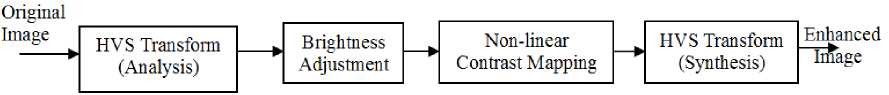
Fig. 3. Block diagram of the Proposed Direct Image Enhancement Algorithm
As a result, the HVS-inspired contrast nonlinearly mapped by
С'^ = sgn ( С™ ) л (п) (|CL^>|) (20)
Where the proposed non-linear contrast mapping function is expressed as, к * .х хТТ*
К У". х + ( к* - к^ Т* х > Т™ (21)
Z (n) (x) = {
This formulation gives; (1) Gain factors less than one to be considered for dynamic range compression, (2) The enhancement of high contrast areas to be tuned and (3) An extension of the non-linear mapping to the DT-CWT coefficients, which possess complex phase. The proposed direct image enhancement algorithm is as formulated for an N level HVS-inspired decomposition to be represented as follows:
-
1) Generate an N + 1 level of transform of I using Eq. (5) and (7)
-
2) To measure the LM contrast of the original image using Eq. (13)
-
3) To measure the LCM contrast of the original image using Eq. (16)
-
4) Initialize z0 (N +Ц= z^ +1 , CL(^=С ^
-
5) Adjust the brightness using Eq. (19)
-
6) Calculate the enhanced LCM contrast by a non-linear mapping, such as Л^ (х) by Eq. (20)
-
7) Calculate the enhanced LM contrast by
Cl(м)=С1(5, .[s2 + |CT^Г2] (22)
-
8) Calculate the enhanced detail coefficients by
z ; №=c L ^s 1 + |z- L (n+^r x i (23)
(a) (b) (c) (d) (e)
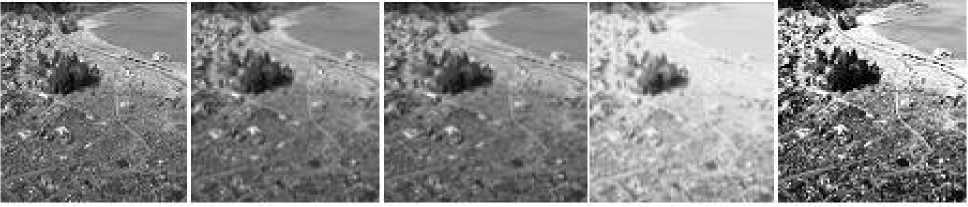
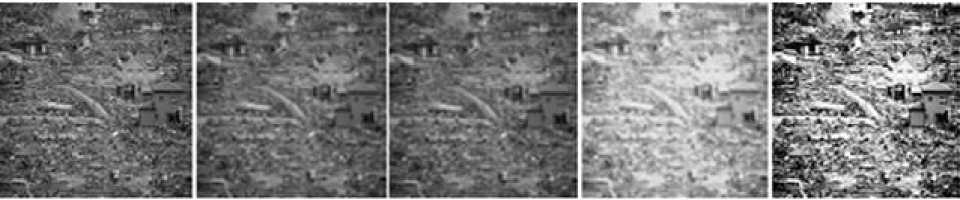
Fig. 4. (a) Original “Aerial of sukuiso in Japan” image (b) HVS-LP, (c) HVS-DWT, (d) HVS-SWT, (e) HVS-DT-CWT transform domains
(a)
(b)
(c)
(d)
(e)
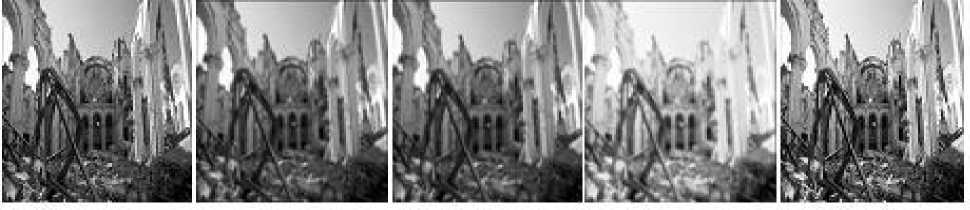
Fig. 5. (a) Original “Remains of cathedral in Haiti” image, (b) HVS-LP, (c) HVS-DWT, (d) HVS-SWT, (e) HVS-DT-CWT transform domains
(a) (b)
(c)
(d)
(e)
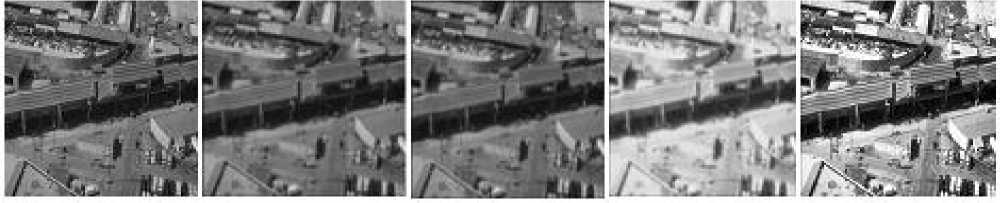
Fig. 6. (a) Original “Yamada town” image (b) HVS-LP, (c) HVS-DWT, (d) HVS-SWT, (e) HVS-DT-CWT transform domains
(a)
(b)
(c)
(d)
(e)
Fig. 7. (a) Original “collapse of Free way” image, (b) HVS-LP, (c) HVS-DWT, (d) HVS-SWT, (e) HVS-DT-CWT transform domains
(a) (b) (c) (d) (e)
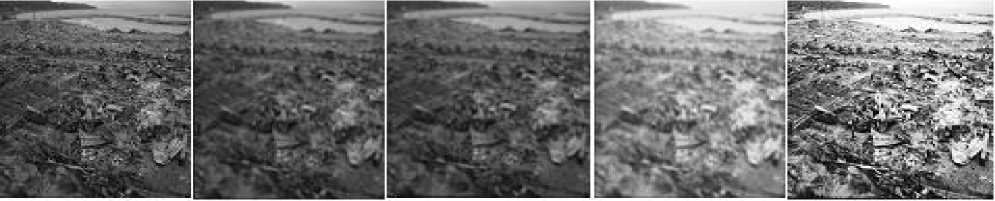
Fig. 8. (a) Original “Tsunami and fire damage SE okusuri in island” image (b) HVS-LP, (c) HVS-DWT, (d) HVS-SWT, (e) HVS-DT-CWT transform domains
Table 2. - Image enhancement assessment via Entropy
|
Image |
Original |
HVS-LP |
HVS-DWT |
HVS-SWT |
Proposed Algorithm |
|
Aerial of Sukuiso, Japan |
7.4196 |
7.2159 |
7.2147 |
7.0094 |
7.9135 |
|
Remains of cathedral in Haiti |
7.8806 |
7.8316 |
7.8316 |
7.6507 |
7.9238 |
|
Yamada town |
7.1569 |
6.7556 |
6.7557 |
7.0237 |
7.9682 |
|
Collapse of free way |
7.2985 |
7.1907 |
7.1889 |
7.4413 |
7.9267 |
|
Tsunami and fire damage SE okusuri in island |
7.2321 |
7.0834 |
7.0840 |
7.5233 |
7.9143 |
Table 3. - Image enhancement assessment via EME
|
Image |
Original |
HVS-LP |
HVS-DWT |
HVS-SWT |
Proposed Algorithm |
|
Aerial of Sukuiso, Japan |
15.9655 |
6.5686 |
11.1561 |
6.1702 |
35.5564 |
|
Remains of cathedral in Haiti |
19.0123 |
11.0543 |
9.9657 |
21.7617 |
31.2189 |
|
Yamada town |
20.3125 |
6.9425 |
6.8825 |
2.2399 |
47.8785 |
|
Collapse of free way |
14.3739 |
7.9111 |
7.9303 |
4.8764 |
28.0024 |
|
Tsunami and fire damage SE okusuri in island |
21.0683 |
9.4645 |
9.4463 |
5.2553 |
37.5415 |
Table 4. - Image enhancement assessment via MOS
|
Image |
Original |
HVS-LP |
HVS-DWT |
HVS-SWT |
Proposed Algorithm |
|
Aerial of Sukuiso, Japan |
1.857 |
1.714 |
1.571 |
2.71 |
4.28 |
|
Remains of cathedral in Haiti |
1.714 |
2.142 |
2.428 |
3.141 |
4.142 |
|
Yamada town |
1.428 |
1.714 |
2.571 |
2.857 |
4.428 |
|
Collapse of free way |
1.714 |
1.857 |
1.428 |
3.428 |
4.571 |
|
Tsunami and fire damage SE okusuri in island |
1.428 |
2.571 |
3.428 |
3.714 |
4.714 |
-
9) Calculate the enhanced approximation coefficients
by V. Experimental Results z 0(n) = z'(n) + EX PAND [z Q+Ц] (24)
-
10) The enhanced image I =z0 '0)
The analysis and synthesis stages of HVS Multiscale transforms were summarized in Table 1.
The computer simulation shows to facilitate the efficiency of proposed image enhancement algorithms is to be validated. The proposed image enhancement algorithm accustomed to be presented in the HVS-based multi-scale transform domains, which have been developed. The Fig. 4 illustrates the HVS-based multiscale image enhancement is carried out using the multi- scale transforms. The image enhancement using multiscale transform results in each and every transform domain have their slight changes occur, as though the enhancement method can improve the image both locally and global enhancement in each of the wavelet transforms domains. Finally, the proposed HVS algorithm is able yields visually pleasing brightness and removes the brightness non-uniformity and also enhances fine details of the edges. In Fig. 5, SWT over-enhances the image and DWT yields an output which has a very noticeable “graying out” effect. DT-CWT enhances already strong images and some of the details are overenhanced. The proposed algorithm again obtains the most visually pleasing output. In Fig. 6-8, the same changes of algorithms performed same as in all figures. These algorithms are compared by both the quantitative and qualitative image enhancement measures.
Entropy is used as image enhancement measure of visual quality, since the amount of information content in images measured by entropy. Hence, a higher value of entropy gives higher visual content. Entropy is compared using different transforms with different images. The proposed algorithm gives better Entropy value which gives sustainability.
The parameter ‘EME’ is the measure of improvement and measure of enhancement. This is the quantitave image enhancement measure. EME is compared using different transforms with different images [20]. The simulation result gives higher EME value for the proposed method shows in table. The EME and Entropy are the quantitative image enhancement measures, whereas MOS gives qualitative evaluation.
In MOS, the participants are taken into consideration as image processing experts themselves and each enhancement result can be ranking from 1 to 5, whereas 1 is considered as the worst performance, 2 as poor, 3 as fair, 4 is consider as good and 5 is considered as the better performance. The higher MOS score is represented as best performance. MOS [21] is compared using different transforms with different images. This measurement also gives better results to the proposed method. The output of the proposed image enhancement algorithm outperforms the other algorithms which have been compared.
VI. Conclusion
A new parametric contrast measure factoring both the LM and CM characteristics of the HVS was adapted. Based upon the proposed contrast measure, HVS-based transforms were derived, which combined existing multiresolution transform methods with HVS phenomena. A new proposed image enhancement algorithm depends on the proposed transforms was then presented. It has the ability to adjust the certain brightness level of an image directly and used a non-linearly mapping to contrast coefficients at every scale. An inherent role of the proposed methodology has been used the non-linear contrast mappings for HVS-inspired contrast coefficients, in addition to the extension of HVS-based contrast definitions in the SWT and DT-CWT domains. In HVS-inspired transforms, HVS-DT-CWT has the characteristics such as directional sensitivity and edge preservation, which gives better result than the remaining transforms.
Images Courtesy : Website of National Geophysical Data Centre (NGDC), Natural Hazards Database, Dylan McCord, U.S. Navy.
References A Multi-Scale Image Enhancement Model using Human Visual System Characteristics
- S. Agaian, "Visual morphology," Proc. SPIE, vol. 3646, pp. 139–150, Mar. 1999.
- B. Bhanu, J. Peng, T. Huang, and B. Draper, "Introduction to the special issue on learning in computer vision and pattern recognition," IEEE Trans. on Systems, Man, and Cybern. B: Cybern., vol. 35, no. 3, pp. 391–396, Jun. 2005.
- M. K. Kundu and S. K. Pal, "Thresholding for edge detection using human psychovisual phenomena," Pattern Recognit. Lett., vol. 4, no. 6, pp. 433–441, 1986.
- E. Wharton, S. Agaian, and K. Panetta, "Adaptive multi-histogram equalization using human vision thresholding," Proc. SPIE, vol. 6497, p. 64970G, Jan. 2007.
- J. Tang, E. Peli, and S. Acton, "Image enhancement using a contrast measure in the compressed domain," IEEE Signal Process. Lett., vol. 10, no. 10, pp. 289–292, Oct. 2003.
- A. Grigoryan and S. Agaian, "Image Enhancement," in Advances in Imaging and Electron Physic. New York, NY, USA: Academic, May 2004, pp. 165–243.
- K. Panetta, S. Agaian, Y. Zhou, and E. J. Wharton, "Parameterized logarithmic framework for image enhancement systems," IEEE Trans.Man, Cybern., B, Cybern., vol. 41, no. 2, pp. 460–473, Feb. 2011.
- K. Panetta, S. Agaian, S. Nercessian, and A. Almunstashri, "Shape dependent canny edge detector," Opt. Eng., vol. 50, no. 8, pp. 087008-1–087008-12, 2011.
- E. Wharton, K. Panetta, and S. Agaian, "Human visual system based multi-histogram equalization for non-uniform illumination and shadow correction," in Proc. IEEE Int. Conf., vol. 1. Apr. 2007, pp. 729–732.
- F. Yang, Y. Chang, and S.Wan, "Gradient-threshold edge detection based on the human visual system," Opt. Eng., vol. 44, no. 2, p. 020205, Feb. 2005.
- B. M. T. H. Romeny, Front-End Vision and Multiscale Image Analysis: Introduction to Scale-Space Theory. Norwell, MA, USA: Kluwer, 1997.
- A. V. Rangan, L. Tao, G. Kovacic, and D. Cai, "Multiscale modeling of the primary visual cortex," IEEE Eng. Med. Biol. Mag., vol. 28, no. 3, pp. 19–24, May–Jun. 2009.
- K. Panetta, E.Wharton, and S. Agaian, "Logarithmic edge detection with applications," J. Comput. Process., vol. 3, no. 9, pp. 11–19, Sep. 2008.
- G. Buchsbaum "An analytical derivation of visual nonlinearity," IEEE Trans. Biomed. Eng., vol. 27, no. 5, pp. 237–242, May 1980.
- A. Liu, W. Lin, M. Paul, C. Deng, and F. Zhang, "Just noticeable difference for images with decomposition model for separating edge and textured regions," IEEE Trans. Circuits Syst. Video Technol., vol. 20, no. 11, pp. 1648–1652, Oct. 2010.
- S. Nercessian, K. A. Panetta, and S. S. Agaian, "A multi-scale nonlocal means algorithm for image de-noising," Proc. SPIE, vol. 8406, pp. 84060J-1–84060J-12, May 2012.
- S. G. Mallat, "A theory for multiresolution signal decomposition: The wavelet representation," IEEE. Trans. Pattern Anal. Mach. Intell., vol. 11, no. 7, pp. 674–693, Jul. 1989.
- S. G. Mallat, "A theory for multiresolution signal decomposition: The wavelet representation," IEEE. Trans. Pattern Anal. Mach. Intell., vol. 11, no. 7, pp. 674–693, Jul. 1989.
- W. Selesnick, R. G. Baraniuk, and N. G. Kingsbury, "The dual-tree complex wavelet transform," IEEE Signal Process. Mag., vol. 22, no. 6, pp. 123–141, Nov. 2005.
- Sos S. Agaian, Karen P. Lentz, and Artyom M. Grigoryan, "A New Measure of Image Enhancement", in Division of Engineering, IEEE Trans. Man, Cybern., B, Cybern., vol. 41, no. 2, pp. 460–473, Feb. 2000.
- Methods for Subjective Determination of Transmission Quality, International Telecommunication Union (ITU), Geneva, Switzerland, Aug. 1996.
