A New Design Approach for Speaker Recognition Using MFCC and VAD

Author: Geeta Nijhawan, M.K Soni
Journal: International Journal of Image, Graphics and Signal Processing(IJIGSP) @ijigsp
Article in issue: 9 vol.5, 2013.
Free access
This paper presents a new approach for designing a speaker recognition system based on mel frequency cepstral coefficients (MFCCs) and voice activity detector (VAD). VAD has been employed to suppress the background noise and distinguish between silence and voice activity. MFCCs were extracted from the detected voice sample and are compared with the database for recognition of the speaker. A new criteria for detection is proposed which gives very good performance in noisy environment.
Mel frequency cepstral coefficients, Voice activity detector, Pre emphasis, Discrete Fourier Transform, Windowing, Graphical user interface
Short address: https://sciup.org/15013031
IDR: 15013031
Text of the scientific article A New Design Approach for Speaker Recognition Using MFCC and VAD
Published Online July 2013 in MECS (http://www.
-
I. INTRODUCTION
Development of speaker recognition system began in early 1960’s with the exploration into voiceprint analysis, where the characteristics of an individual voice were thought to be able to characterize the uniqueness of an individual much like a fingerprint. The early systems designed had many flaws and their detection efficiency gets easily affected in the presence of noise. This fact was the main motivation behind the need to derive a more reliable method of predicting the correlation between two sets of speech utterances. Speaker recognition is the process of automatically recognizing the speaker based on unique characteristics contained in the speech wave. Most of the speaker recognition systems contain two phases. In the first phase feature extraction is performed in which the unique features from the voice data are extracted which can be used latter for identifying the speaker. In the second phase feature matching is done and this phase comprises of the actual procedures carried out for identifying the speaker by comparing the extracted voice data features with the database of known speakers. The overall efficiency of the system depends on the fact that how efficiently the features of the voice are extracted and the procedures used for comparing the real time voice sample features with the database.
The main requirement of the modern speaker recognition system is that it should have high accuracy , low complexity and easy calculation. Hidden Markov
Model (HMM) has been successfully applied to both the isolated word and continuous speech recognition, however it fails in addressing discrimination and robustness issues for classification problems. The acoustic analysis based on MFCC which represents the ear model [1], has given good results in speaker recognition. Background noise and microphone used also effect the overall performance of the system. [2].
In this paper, Mel Frequency Cepstrum Coefficient (MFCC) feature is used along with the voice activity detector (VAD) to design a speaker recognition system [3]. The problem of background noise removal from the voice sample is given main priority .By implementing a voice activity detector before extracting the important features from the input obtained from microphone reduces the noise effect considerably. The remainder of this paper is organized as follows. Section II presents a flow chart for speaker recognition system. In section III MFCC used for feature extraction from the input voice is presented in detail. Section IV gives the experimental results and finally in section V conclusions are drawn.
-
II. FLOW CHART
Speaker recognition is a process through which a person can be recognized based on the unique characteristics contained in the speech waves. This process can be text dependent or text independent. Text dependent system recognizes the speaker’s identity based on the speaker saying exactly the enrolled or given password while text independent system aims at recognizing a speaker irrespective of the content of speech. Speaker recognition system consists of two important phases. The first phase is training phase in which a database is created which acts as a reference for the second phase of testing. Testing phase consists of recognizing a particular speaker. Fig.1shows the flow chart of the proposed speaker recognition system.
Database voice sample MFCCs
Incoming speech samples
VAD block to detect voice
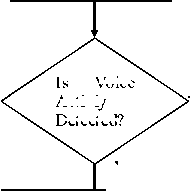
Voice
Is
Activiy
Detected?
NO
Yes
Extract AFCCs of the detected Voice activity
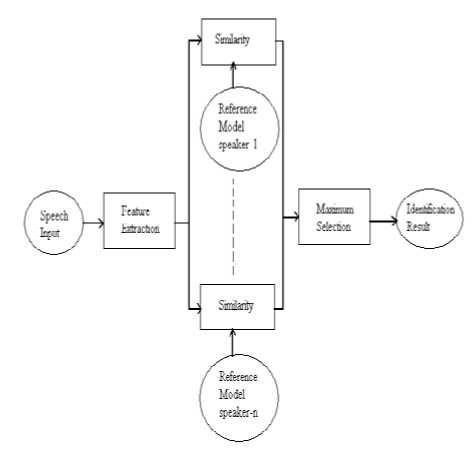
Figure.2 Block diagram of Speaker Recognition System
Comparision block (compares present voice with the databsae)
in database
Current voice from speaker
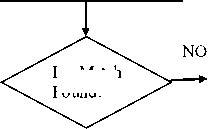
Is Match Found?
Yes

STOP
Figure.1 1Flowchart of Speaker Recognition System
Comparison block compares the new input voice sample with the database voices and for comparison both voice print analysis and MFCC features are used. If a valid speaker is recognized then the ID of the speaker will be the output of the speaker recognition system and if speaker is not recognized then it means that the speaker is not an authorized speaker.
-
III. FEATURE EXTRACTION
It is a process of extracting a small amount of speaker specific information in the form of feature vectors at reduced data rate from the input voice signal which can be used as a reference model to represent a particular speaker’s identity. A general block diagram of speaker recognition system is shown in Fig.2.
It is clear from the above diagram that the speaker recognition is a 1:N match where an unknown speaker’s extracted features are matched to all the templates in the is not present reference model for finding the closest match. The
speaker whose feature shows maximum similarity is selected.
A. MFCC Extraction
Mel frequency cepstral coefficients (MFCC)[4],[5] is probably the best known and most widely used technique for both speech and speaker recognition. A mel is a unit of measure based on human ear’s perceived frequency. The mel scale has approximately linear frequency spacing below 1000 Hz and a logarithmic spacing above 1000Hz. The approximation of mel from frequency can be expressed as- mel (f) = 2595*logio(1 + f)
where f denotes the real frequency and mel(f) denotes the perceived frequency. The block diagram showing the computation of MFCC is shown in Fig.3.
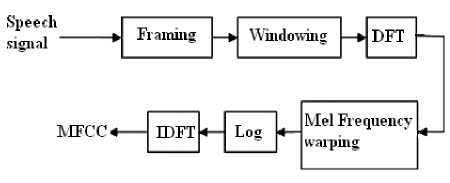
Figure.3 MFCC Extraction
MFCCs are obtained as follows[6],[7]:
-
1 .Take the Fourier transform of (a windowed excerpt of) a signal.
-
2 .Map the powers of the spectrum obtained above onto the mel scale, using triangular overlapping windows.
-
3 .Take the logs of the powers at each of the mel frequencies.
-
4 .Take the discrete cosine transform of the list of mel log powers, as if it were a signal.
-
5 .The MFCCs are the amplitudes of the resulting spectrum.
Speech signals are normally pre-processed before features are extracted to enhance the accuracy and efficiency of the extraction processes . Speech signal preprocessing covers digital filtering and speech signal detection. Filtering includes pre-emphasis filter and filtering out any surrounding noise .
Pre-emphasis filter
In general, the digitized speech waveform has a high dynamic range and suffers from additive noise. In order to reduce this range, pre-emphasis is applied. This preemphasis is done by using a first-order FIR high-pass filter.
In the time domain, with input x [ n ], the filter equation
y [ n ] = x [ n ]-a x [ n -1] where 0.9 ≤ a ≤ 1.0 (2)
and the transfer function of the FIR filter in z-domain is
H ( Z ) = 1 - α z - 1 , 0.9 ≤ α ≤ 1.0 (3)
where α is the pre-emphasis parameter.
The aim of this stage is to boost the amount of energy in the high frequencies. Boosting the high frequency energy makes information from these higher formants available to the acoustic model. The pre-emphasis filter is applied on the input signal before windowing.
Framing and windowing
The first step is framing. The speech signal is split up into frames typically with the length of 10 to 30 milliseconds. The frame length is important due to the trade off between time and frequency resolution. If it is too long it will not be able to capture local spectral properties and if too short the frequency resolution would degrade. The frames overlap each other typically by 25% to 70% of their own length.
The reason for this is because on each individual frame, we will also be applying a hamming window which will get rid of some of the information at the beginning and end of each frame. Overlapping will then reincorporate this information back into our extracted features.
Windowing
Windowing is performed to avoid unnatural discontinuities in the speech segment and distortion in the underlying spectrum [4][5]. A good window function has a narrow main lobe and low side lobe levels in their transfer function.
The multiplication of the speech wave by the window function has two effects :-
1-It gradually attenuates the amplitude at both ends of extraction interval to prevent an abrupt change at the endpoints. . 2-It produces the convolution for the Fourier transform of the window function and the speech spectrum .
We have used hamming window in our speaker recognition system. In speaker recognition, the most commonly used window shape is the hamming window [6].
The hamming window WH (n) , is defined as
WhM — 0.54 - 0.46cos )
Fast Fourier Transform
The third step is to apply the discrete fourier transform on each frame.
The fastest way to calculate the DFT is to use FFT which is an algorithm that can speed up DFT calculations by a hundred-folds[7]. The resulting spectrum is then converted into mel scale.
Mel-scaled filter bank
The speech signal consists of tones with different frequencies. For each tone with an actual frequency, f, measured in Hz, a subjective pitch is measured on the ‘Mel’ scale. The mel-frequency scale is a linear frequency spacing below 1000Hz and a logarithmic spacing above 1000Hz[8],[10].
The information carried by low frequency components of the speech signal is more important compared to the high frequency components. In order to place more emphasis on the low frequency components, mel scaling is performed.Mel filterbanks are non-uniformly spaced on the frequency axis, so we have more filters in the low frequency regions and less number of filters in high frequency regions. The mel frequency warping is normally realized by triangular filter banks as shown in Fig. 4 with the center frequency of the filter normally evenly spaced on the frequency axis[11]. The warped axis is implemented according to equation (1) so as to mimic the human ears perception. The output of the ith filter is given by-
N y (i) = z 5 (j)Q i(j) (5)
j = 1
s(j) is the N-point magnitude spectrum (j =1:N) and Ωi(j) is the sampled magnitude response of a M-channel filter bank (i =1:M).
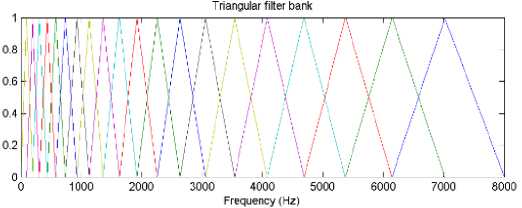
Figure. 4 Triangular filter bank
Cepstrum
In the final step, the log mel spectrum has to be converted back to time. The result is called the mel frequency cepstrum coefficients (MFCCs). The cepstral representation of the speech spectrum provides a good representation of the local spectral properties of the signal for the given frame analysis. Because the mel spectrum coefficients are real numbers(and so are their logarithms), they may be converted to the time domain using the Discrete Cosine Transform (DCT)[13],[14].
The MFCC may be calculated using the equation-
M
i = 1
. 2п
i
N '
where N’ is the number of points used to compute standard DFT[15].
B. Voice Activity Detector (VAD)
It has been used to primarily distinguish speech signal from silence. In the existing energy-based VAD, the energy of the frame is compared with a threshold energy value. Voice activity is detected if the energy of the current frame is above the threshold energy.
ie.
If E1 > KEr, frame is ACTIVE else, frame is INACTIVE where E1 is energy of current frame, Er is energy of noise frame, K is the scaling factor that allows for adapting the threshold. Fig.5 shows a block diagram of the existing energy based VAD design. Threshold value adjustment helps to track time varying changes in the environment.
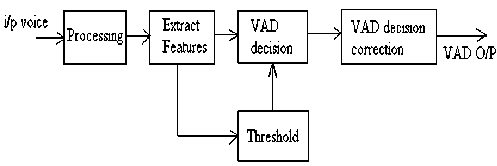
Figure.5 Existing energy based VAD
Fig.6 shows a block diagram of the VAD which is used in the proposed speaker recognition system. It compares the extracted features from the input speech signal with some predefined threshold. Voice activity exists if the measured feature values exceed the threshold limit, otherwise silence is assumed to be present.
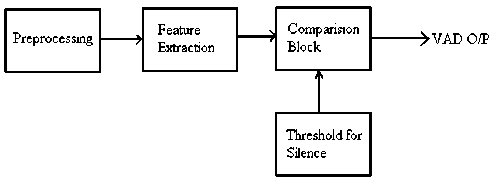
Figure.6 Proposed VAD
The performance of the VAD depends heavily on the preset values of the threshold for detection of voice activity. The VAD proposed here works well when the energy of the speech signal is higher than the background noise and the background noise is relatively stationary. The amplitude of the speech signal samples are compared with the threshold value which is being decided by analyzing the performance of the system under different noisy environments.
-
IV. RESULTS
Detection criteria is the most important aspect that affects the accuracy of recognition. In this paper a new approach for detection is proposed in which two important parameters considered are the mel frequency cepstral coefficients of the speech signal and the amplitude of the input speech waveform. MFCCs of the input voice sample are compared with the database MFCCs under a specific threshold which is being decided by carrying out experimental analysis under different noisy environmental conditions. The amplitude of the input speech waveform are analyzed to count the number of peaks i.e. the number of times the input speech waveform has crossed the threshold value so as to distinguish between silence and voice activity. MFCCs are computed only for the detected voice activity and not the entire input speech waveform and this fact surely improves the % accuracy of recognition as the noise signal in the input speech waveform are not processed by the system.
In this work MATLAB tool [9] has been used for designing speaker recognition system. Database is first created in which 10 sample voices per speaker are stored in the database for three speakers speaking an English word hello. During testing phase 10 trials are conducted for each speaker and the efficiency of the proposed approach comes out to be 90% with no false recognition. False recognition is a condition in which an unauthorized speaker is considered as a valid user by the system. Distance from the microphone is another important aspect that affects the performance of the speaker recognition system. This is due to reduced value of the signal to noise ratio. Results of the speaker recognition system are given in Table 1.
90 % accuracy is obtained at a distance of 5 cm from microphone. Since the proposed approach for speaker recognition aims at recognizing the speaker with high accuracy, this aspect of reduced % accuracy can be overcome by using some kind of signal processing in the initial stages of the voice processing so as to improve the overall SNR for better recognition accuracy. Screen shots of the GUI developed in MATLAB are shown in Fig.7, input speech waveform and detected voice activity during the training phase is shown in Fig.8. Fig.9 shows the input speech, detected voice activity and MFCC plots for the input speech signal at the time of testing.
Table 1:Results of Speaker Recognition System
|
Speaker No. |
No. of attempts |
False acceptance |
False rejection |
|
Speaker 1 |
10 |
0 |
1 |
|
Speaker 2 |
10 |
0 |
0 |
|
Speaker 3 |
10 |
0 |
2 |
|
Total |
30 |
0 |
3 |
Speaker Recognition Systei
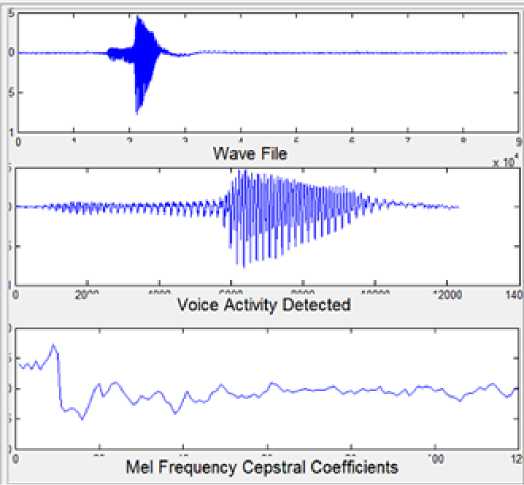
Figure.9 GUI waveforms showing input speech, voice activity detected and MFCC waveforms
Start
Figure.7 GUI of Speaker Recognition System
Clicking on the start button opens another panel in the GUI for further processing which includes creating a database of the speakers and for carrying out real time testing of the system with a new speech input from any user.
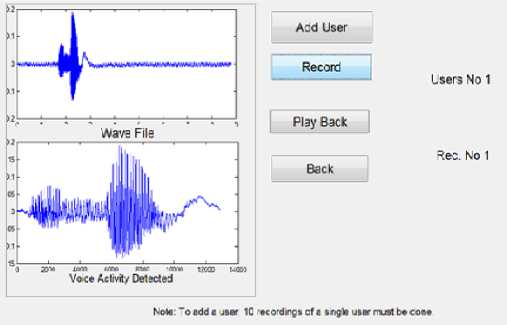
Figure.8 GUI showing input speech and voice activity detected waveform during training phase
Fig.10 shows the spectrogram of the input voice signal (“Hello”). Spectrogram is a visual representation of acoustic signal in frequency domain. It computes the windowed discrete time fourier transform (DTFT) of a signal using sliding window. Spectrogram is a 2-D plot of frequency against time, where the magnitude at each frequency is represented by the grey scale darkness or by colour in position (t,f) in the display, and the darker regions correspond to higher magnitudes.
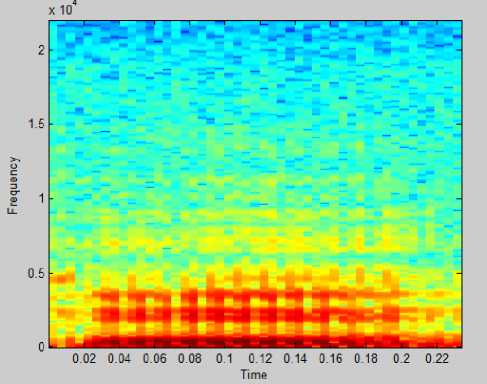
Figure.10 Spectrogram for the word “hello”
The response time of the system is one of the important performance parameter and it must be as small as possible to assure real time functioning of the speaker recognition system. When the database becomes too large then the number of comparisons that are required to be performed for identifying the speaker will also increase and this will increase the response time of the system. Speaker pruning can be used to increase the identification accuracy .
-
V. CONCLUSION
This paper presented a new approach for speaker recognition using MFCC and VAD. A new algorithm for designing VAD aiming at distinguishing between silence and speech has been proposed. Experimental results presented shows that the % accuracy of recognition is around 90% and there is no false recognition which shows the robust performance of the proposed design approach. Analysis of the % accuracy for recognition with distance shows that the performance of the proposed system is good up to a distance of about 10cm from the microphone, however this can be improved by setting varying threshold for detection and adopting signal processing for improving the SNR at the initial stages of the detection.
ACKNOWLEDGMENT
References A New Design Approach for Speaker Recognition Using MFCC and VAD
- Ch.Srinivasa Kumar, Dr. P. Mallikarjuna Rao, 2011, "Design of an Automatic Speaker Recognition System using MFCC, Vector Quantization and LBG Algorithm'', International Journal on Computer Science and Engineering,Vol. 3 No. 8 ,pp:2942-2954.
- Amruta Anantrao Malode,Shashikant Sahare,2012 , "Advanced Speaker Recognition", International Journal of Advances in Engineering & Technology ,Vol. 4, Issue 1, pp. 443-455.
- A.Srinivasan, "Speaker Identification and verification using Vector Quantization and Mel frequency Cepstral Coefficients",Research Journal of Applied Sciences,Engineering and Technology 4(I):33-40,2012.
- Vibha Tiwari, "MFCC and its applications in speaker recognition",International Journal on Emerging Technologies1(I):19-22(2010).
- Md. Rashidul Hasan,Mustafa Jamil,Md. Golam Rabbani Md Saifur Rahman, "Speaker Identification using Mel Frequency Cepstral coefficients",3rd International Conference on Electrical & Computer Engineering,ICECE 2004,28-30 December 2004,Dhaka,Bangladesh.
- Fu Zhonghua; Zhao Rongchun; "An overview of modeling technology of speaker recognition", IEEE Proceedings of the International Conference on Neural Networks and Signal Processing Volume 2, Page(s):887 – 891, Dec. 2003.
- Seddik, H.; Rahmouni, A.; Sayadi, M.; "Text independent speaker recognition using the Mel frequency cepstral coefficients and a neural network classifier"First International Symposium on Control, Communications and Signal Processing, Proceedings of IEEE 2004 Page(s):631 – 634.
- John G. Proakis and Dimitris G. Manolakis, "Digital Signal Processing", New Delhi: Prentice Hall of India. 2002.
- Rudra Pratap. Getting Started with MATLAB 7. New Delhi: Oxford University Press, 2006.
- S. Furui, "Speaker-independent isolated word recognition using dynamic features of speech spectrum," IEEE Trans. Acoust., Speech, Signal Process., vol. ASSP-34, pp. 52-9, Feb. 1986.
- Sasaoki Furui, "Cepstral analysis technique for automatic speaker verification," IEEE Trans. Acoust., Speech, Signal Process., vol. 29(2), pp. 254-72, Apr. 1981.
- D.A. Reynolds, "Experimental evaluation of features for robust speaker identification," IEEE Trans. Speech Audio Process., vol. 2(4), pp. 639-43, Oct. 1994.
- L. Rabiner, and B.H. Juang, "Fundamentals of Speech Recognition", Singapore: Pearson Education, 1993.
- B. Yegnanarayana, K. Sharat Reddy, and S.P. Kishore, "Source and system features for speaker recognition using AANN models," in proc. Int. Conf. Acoust., Speech, Signal Process., Utah, USA, Apr. 2001.
- C.S. Gupta, "Significance of source features for speaker recognition," Master's thesis, Indian Institute of Technology Madras, Dept. of Computer Science and Engg., Chennai, India, 2003.
- B. Peskin, J. Navratil, J. Abramson, D. Jones, D. Klusacek, D.A. Reynolds, and B. Xiang, "Using prosodic and conversational features for high-performance speaker recognition," in Int. Conf. Acoust., Speech, Signal Process., vol. IV, Hong Kong, Apr. 2003, pp. 784-7.
- H. Sakoe, and S. Chiba, "Dynamic programming algorithm optimization for spoken word recognition," IEEE Trans. Acoust., Speech, Signal Process., vol. 26, pp. 43-9, Feb. 1978.
- Y. Linde, A. Buzo, and R.M. Gray, "An algorithm for vector quantizer design," IEEE Trans. Communications, vol. COM-28(1), pp. 84-96, Jan. 1980.
- R. Gray, "Vector quantization," IEEE Acoust., Speech, Signal Process. Mag., vol. 1, pp. 4-29, Apr. 1984.
- F.K. Soong, A.E. Rosenberg, L.R. Rabiner, and B.H. Juang, "A Vector quantization approach to speaker recognition," in Proc. IEEE Int. Conf. Acoust., Speech, Signal Process., vol. 10, Detroit, Michingon, Apr. 1985, pp. 387-90.
- L. Lin, and S. Wang, "A Kernel method for speaker recognition with little data," in Int. Conf. signal Process., Budapest, Hungery, May, 2006.
- T. Matsui, and S. Furui, "Comparison of text-independent speaker recognition methods using VQ-distortion and Discrete/continuous HMMs," IEEE Trans. Speech Audio Process., vol. 2(3), pp. 456-9, July 1994.
- R.P. Lipmann, "An introduction to computing with neural nets," IEEE Trans. Acoust., Speech, Signal Process., vol. 4, pp. 4-22, Apr. 1989.
- W.M. Campbell, J.P. Campbell, D.A. Reynolds, E. Singer, and P.A. Torres-Carrasquillo, "Support vector machines for speaker and language recognition," Computer Speech and Language, vol. 20, pp. 210-29, 2006.
- D.A. Reynolds, T.F. Quateri, and R.B. Dunn, "Speaker verification using adapted Gaussian mixture models," Digital Signal Processing, vol. 10, pp. 19-41, 2000.
- B. Yegnanarayana, and S.P. Kishore, "AANN: An alternative to GMM for pattern recognition," Neural Networks, vol. 15, pp. 459- 69, 2002.
