A new efficient 2D combined with 3D CAD system for solitary pulmonary nodule detection in CT images

Author: Xing Li, Ruiping Wang
Journal: International Journal of Image, Graphics and Signal Processing(IJIGSP) @ijigsp
Article in issue: 4 vol.3, 2011.
Free access
Lung cancer has become one of the leading causes of death in the world. Clear evidence shows that early discovery, early diagnosis and early treatment of lung cancer can significantly increase the chance of survival for patients. Lung Computer-Aided Diagnosis (CAD) is a potential method to accomplish a range of quantitative tasks such as early cancer and disease detection. Many computer-aided diagnosis (CAD) methods, including 2D and 3D approaches, have been proposed for solitary pulmonary nodules (SPNs). However, the detection and diagnosis of SPNs remain challenging in many clinical circumstances. One goal of this work is to develop a two-stage approach that combines the simplicity of 2D and the accuracy of 3D methods. The experimental results show statistically significant differences between the diagnostic accuracy of 2D and 3Dmethods. The results also show that with a very minor drop in diagnostic performance the two-stage approach can significantly reduce the number of nodules needed to be processed by the 3D method, streamlining the computational demand. Finally, all malignant nodules were detected and a very low false-positive detection rate was achieved. The automated extraction of the lung in CT images is the most crucial step in a computer-aided diagnosis (CAD) system. In this paper we describe a method, consisting of appropriate techniques, for the automated identification of the pulmonary volume. The performance is evaluated as a fully automated computerized method for the detection of lung nodules in computed tomography (CT) scans in the identification of lung cancers that may be missed during visual interpretation.
Lung Cancer, Computer-aided Diagnosis, Solitary pulmonary nodules, 3D, Automated
Short address: https://sciup.org/15012151
IDR: 15012151
Text of the scientific article A new efficient 2D combined with 3D CAD system for solitary pulmonary nodule detection in CT images
Published Online June 2011 in MECS
The Lung cancer is the second most commonly diagnosed cancer and the lung is a most frequent site of metastasis from other cancers that manifest as pulmonary nodules. The Chest computed tomography (CT) is the most sensitive diagnostic imaging modality for the detection of lung cancer and the resolution of any equivocal abnormalities detected on chest radiographs [1,
2]. Recently, CT techniques have been applied to screening for the detection of the lung cancer in high-risk populations and have been shown to be promising for detection of early lung cancers [3]. Thin-section threedimensional nodules reconstruction may allow us to evaluate small lung nodules automatically at early stages. With sequential follow-up CT scans, early changes in nodule size and number can be assessed [4, 5].
In order to improve the survival rate of lung cancer patients, early detection has a significantly more hopeful prognosis and is the key treatment. CT scanning presents great opportunities for lung cancer diagnosis. However, the large amount of CT images caused increasing work and inevitable false diagnosis rate. Image processing techniques, for example segmentation and extraction of nodules, reconstruction and rendering of suspicious objects, make it possible that computer aided reading images, help doctors to analyze pathological changes and other regions of interest in character and even in accurate quantity, and release the doctors’ burden.
Previous studies have shown that making an accurate diagnosis based on CT data alone is often a very difficult task[6,7]. As a result, many computer-aided diagnosis (CAD) methods have been proposed for SPNs. Based on the dimension of measurements, these CAD methods can be divided into two categories: 2D and 3D methods.
In a 2D CAD method, features that are used to differentiate benign and malignant nodules are generated from a representative (typically the largest) slice of the nodule[8-11]. This eliminates the requirement of processing the entire 3D nodule volume and significantly reduces the operational complexity and computational cost that have hindered the application of 3D methods. Another factor that has hampered the development of 3D CAD methods is a limitation of early CT hardware. With single detector row, early CT scanners often generate highly anisotropic image data. For these images, the resolution in the axial dimension was typically 10–20 times the size of the inplane resolution, making accurate 3D nodule modeling very difficult.
With the introduction of multidetector row CT (MDCT), which significantly improves the resolution and acquisition time, scanning the thorax with approximately isotropic 3D resolution without significant breathing artifacts is now possible[12]. Therefore, by employing features that characterize the entire nodule, 3D CAD methods have also been proposed[13-19]. The addition of the extra dimension dramatically increases the operational complexity and computational cost. This is particularly true for nodule segmentation, considered to be one of the most difficult tasks in analyzing SPN images[20-23]. The major challenge for 3D segmentation is that nodules are frequently attached to other structures, such as the local pulmonary vas culature and the pleural surface adjoining the thoracic wall. A fully automatic segmentation method that can separate a nodule fromsuch structures is not available.As a result, laborious, slice-by-slice,manual or semi-automatic segmentation operations are often required.
These additional costs required by the 3D CAD methods maybe worthwhile if the 3D method can provide better diagnostic performance than the 2D method. To the best of ourknowledge, this idea has never been studied systematically.Therefore, a first goal of this work is to compare the diagnostic performance of 2D and 3D CAD methods. Considering the operational complexity and the computational cost of the 3D method, a second goal is to develop a criterion to determine which nodules can be diagnosed reliably by the 2D method to minimize the requirement for processing using a 3D method.
The automated lung nodules detection scheme consists of four stages: lung extraction, ROI reconstruction, tubular structures elimination, and false positive reduction.
-
II. LUNG EXTRACTION
Watershed transformation is a common technique for image segmentation. It is a classical and effective segmentation method by which one-pixel-wide continuous edge can be extracted. More importantly, it has the advantages of high segmentation precision and accurate positioning. Its drawbacks include oversegmentation and sensitivity to noise [24]. Currently, there are two main methods to solve the problems. The first one is post-processing for the segmented images. But this method is time-consuming and its computation is much large. The second one is preprocessing, belonging to the watershed segmentation algorithm based on the marker. According to V. Grau et al[25], marker-based watershed algorithm is more effective to solve the oversegmentation. Therefore, Marker-based Watershed Transform is tried in this paper.
-
A. The principle of Watershed Transform
Generally, the watershed transform is computed on the gradient image, where the boundaries of the catchment basins are located at high gradient points. The principle of the immersion-based watershed algorithm can be illustrated by imaging the gradient image as a relief, with the ‘height’ variable being the grey-value for each pixel position. Imagine, water immersing from the bottom of the relief (the darkest parts), every time the water reaches a minimum which corresponds to a region in the original image, a catchment basin is ‘grown’. When two neighboring catchment basins eventually meet, a dam is created to avoid the water merging at that level of flooding and spilling from one basin into the other. We utilized this property to make the left and right lung separate during the transformation. When the water reaches the maximum gray-value, the union of all dams forms the watershed lines.
-
B. Marker-based Watershed Transform
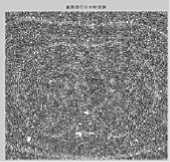
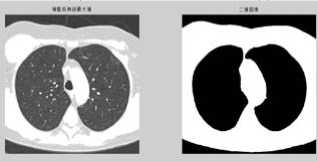
Over-segmentation is a well-known drawback in watershed segmentation. This phenomenon is more serious by applying standard watershed transform on the gradient image of a pulmonary CT slice (figure 1.(b)).
By using marker-based watershed transform proposed in this paper, we can decrease the regional minima and bound them within the regions of interest to prevent oversegmentation.
The details of our approach are described in the following steps.
-
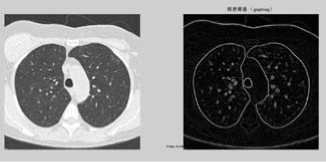
(1) First, read an image and the original one is transformed into a gray image (figure a).
-
(2) Watershed transform is applied on the gradient image, so the step is to obtain the gradient image (right, figure1.(a)). The Sobel masking operator is applied on the CT gray image in both horizontal and vertical directions to create the gradient image. Watershed algorithm can be directly tested on it, and then its segmentation result will be as a contrast (figure b).
-
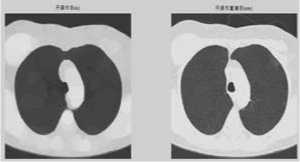
(3) If the over-segmentation is serious, the foreground and background should be marked. Select a circular structure element and then apply open morphological operation and morphological reconstruction (figure c).
-
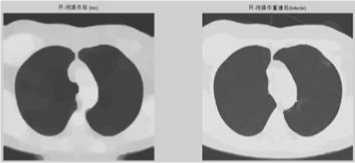
(4) Following, apply morphological clearance operation and reconstruction, obtain its complement image (figure d).
-
(5) A local maximum (display the maximum areas in original image) (figure e f).
-
(6) Again apply an appropriate open and clearance operators to modify local maximum areas (figure g).
-
(7) The modified image then is changed into binary image (figure h).
-
(8) Finally, watershed transform on the binary image.
(a)
(b)
(c)
(d)
о о
(g)
(h)
Figure 1. (a) The gray image and gradient image. (b)Apply watershed algorithm diectly without any preprocessing. The picture shows the serious over-segmentation. (c)Open and reconstruction operations. The two pictures show that, its outline is clearer after reconstruction. (d)Morphological clearance operation and reconstruction based on the picture c. The outline is kept complete, and remove some disrelated objects effectively. (e)Local maximum. (f)Local maximum displayed on the original image. (g)The modified local maximum and binary image. (h)After watershed transform.
Ш. ROI RECONSTRUCTION
The Lung nodule detection is a very difficult step in every CAD system development. Actually, in CT lung images, nodules are frequently attached to blood vessels or to the pleura; and also the grey tone is so similar to vessel sections that traditional intensity-based methods are inappropriate. Instead, an effective nodule detection algorithm must take both the grey level and the object shape into account.
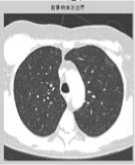
Occasionally the lung extraction stage erroneously eliminatessome voxels which belong to the pulmonary parenchyma. These mistakes can lead to elimination, inclusively, of possible nodules, inducing an error in detection. This way, the reconstruction stage(Figure 2) has great importance for preservation of peripheral nodules. In our CAD system we adopt a method that uses 3D shape information to identify spherical regions with a given grey level. Following the approach described in [26], the idea is to distinguish spherical from cylindrical (typically blood vessels) shapes analyzing a shape index (SI), defined in terms of 3D characteristics, extracted from sets of voxels with grey level in the range of the nodule intensity.
In order to recover the correct lungs outlines, this stage uses the rolling-ball Algorithm [27], a mathematical morphology technique based on closing operations executed with a circular structuring element, whose radius, in this specific case, was of 30 pixels.
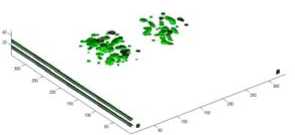
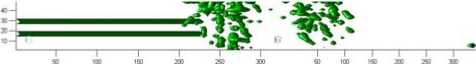
Figure 2. The reconstruction of aurto-segmented ROI
^.TUBULAR STRUCTURES ELIMINATION
We observed that among the objects identified by the 3D connectivity property exist structures that correspond to the bronchial and vascular trees. Besides, there are cases where each nodule is connected to one or more of these structures. This creates a problem for the detection of these nodules, generating the need for identifying the bronchial and vascular trees of the pulmonary parenchyma so that distinguishing these trees from possible nodules can be possible. Blood vessels are, as a rule, tubular. The depth of themedial axis varies very gradually, inclusively in ramifications. In other words, blood vessels have thickness almost constant in a certain location.Nodules have totally different characteristics. As they are compact structures, they present an abrupt increase in the depth of the medial axis. This is perceived more clearly in spiculated nodules. The process consists in verifying to which of both patterns the structures match better. With this objective, observing the structures to be identified, we use an analysis based on their skeleton. This is possible since they resemble very much their medial axis, obtained by means of the 3D skeletonization algorithm proposed in [28]
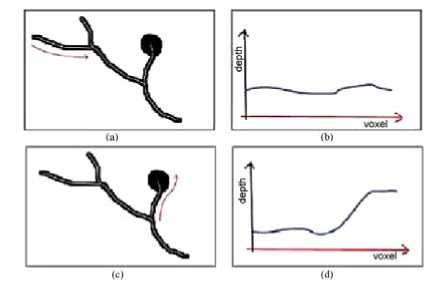
Figure.3 Analysis of the medial axis of some structures.
As an example of what has been said, one can notice in Figure.3(a) that the highlighted branch probably represents a blood vessel. The observation of the average depth of its medial axis on Figure.3(b) allows us to notice its low variation.
On the other hand, the structure indicated in Figure.3(c) has great potential to be a nodule aggregated to a vessel. The same analysis on the average depth of the voxels of its skeleton indicates a very different pattern. As in Figure.3(d), we notice an abrupt increase of values fromthe nodule border, behavior that can be used for detection.
The bifurcations among the vessels possibly present an increase in the depth of the medial axle, but this increase, besides being small when compared with the diameter of the vessel, is gradual. On the other hand, in the case of aggregated nodules, the increase in the depth of the media axle is much more abrupt and intense. With the correct balance of cut off thresholds it is possible to come to a stage that results in few false positives or false negatives, with a good sensibility. Anyway, errors generally occur in this stage,making necessary the posterior stage of reducing false negatives and false positives, which, in our case, was based on SVM.
(a) (b)
(c)
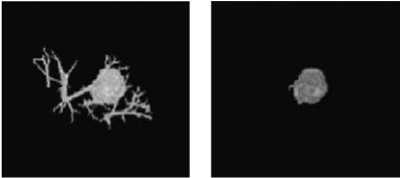
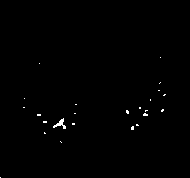
Figure.4 Tubular structures elimination
For each individual structure, the skeleton is calculated. fter that, all of its segments are scanned sequentially. During the scan of each segment the maximum value of depth is elected and its neighborhood with the same pattern is also selected. The selection of the neighborhoodmust consider the verage depth of the adjacentmedial voxels and the variation rom one to another, in sequence.
After the region is selected, it is previously evaluated.Averylarge rate between the length of the selected part of the branch and its thickness clearly indicates a tubular region. However, a great thickness in relation to the length indicates a compact structure, possibly a nodule.
This process allows solving a difficult case of lung nodule detection, which is when they adhere to the pulmonary trees, making the correct delimitation of its bounds more difficult. The structureswith excessively affiliated shape to be a lung nodule are readily eliminated. The remaining structures are considered candidates to lung nodules and pass to the next stage. An example can be seen in Figure.4(a) where we can notice a nodule connected to several blood vessels. Figure. 4(b), on theother hand, presents the same region after the elimination of these vessels.
V .FALSE POSITIVES REDUCTION
False positives reduction is the stage in which the detection is refined by eliminating the false lung nodules. For that, we used the support vectormachine (SVM) [29] previously trained to recognize the true nodules with basis on a series of descriptive characteristics. This work used characteristics commonly used in other works [30] and [31] with the same objective, but with new characteristics as well, especially developed for describing lung nodules and distinguishing them from other pulmonary structures.
The complete list of the studied characteristics is geometry (spherical disproportion, spherical density, pondered radial distance, sphericity, elongation, Boyce-Clark radial shape index), texture (contrast, energy, entropy, homogeneity, moment), histogram (average, standard deviation, skewness, kurtosis, energy, entropy), gradient (average, standard devia- tion, skewness, kurtosis, energy, entropy) and spatial (location of the candidate). The equations and details for all thosemeasurements can be found in [32] or in AppendixA. The set of characteristics extracted from every candidate origins a vector which characterizes them. As each characteristic, however, bears on one isolate aspect of the candidate, it occurs thatmany of themare in different units and frequently in disproportional scales.
To minimize the complexity of the model and speed up the process, we attempted to select a subset of characteristics which are more significant for classification. We empirically tested several subsets of characteristics and verified which one had the best performance. The starting model had 24 variables and after selecting the best subset, there were 8 variables left: geometry (spherical disproportion, spherical density), histogram (standard deviation, skewness, entropy), gradient (standard deviation, kurtosis), and spatial
(location of candidate). The adoption of the vector, such as obtained after calculating these characteristics would cause some of them to be overestimated by the SVM classifier due to the numerically greater value,while others, because they vary in smaller intervals, would be underestimated. This way, the characteristics vector must be normalized so that all the characteristics have the same representativeness.
After all candidates have been completely measured and described, each one by a normalized characteristics vector, these vectors are passed to the SVM, which uses the previous knowledge, obtained by the analysis of other seemingly cases, to identify the real nature of each candidate, recognizing them as lung nodules or as normal lung structures. As SVM kernel, we used the radial basis function. The library LIBSVM [33] was used for training and validation of the SVM classifiers. Fig. 2(g) shows the correct identification of a lung nodule among other normal lung structures which came from the previous stage. Fig. 2(h) presents the same nodule identified in the original tomography image by an arrow.
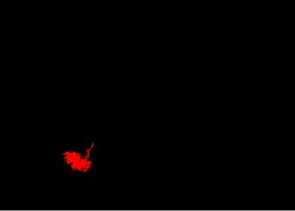
Figure.5 The final candidates after elimination the false nodulesubular
^.RESULTS AND DISCUSSION
Despite the common belief that 3D CAD methods can outperform 2D CAD methods in diagnosing solitary pulmonary odules, to the best of our knowledge, this property has never een investigated systematically. The efficiency/accuracy tradeoff of these methods has also never een studied. By combining orphometric and perfusion CT features, this work performs a omparative study for the 2Dand 3DCADmethods for SPNs.As emonstrated by the results of a series of experiments, the diagnostic performance metrics of the 3D method are consistently etter than those of the 2D method.Moreover, these differences re also statistically significant.
An important drawback of the 3D method is that it is computationally more intensive and complex than the 2D method. To combine the simplicity of the 2D method and the accuracy of the 3D method, our work proposes a two-stage CAD approach for SPNs. The first stage uses the 2D method to segment nodules. By studying the sensitivity of the decision made by the 2D method to the classifier training error, this work introduces a criterion to estimate the reliability of the classification results made by the 2D method. To improve the computational efficiency and processing complexity, only the nodules that fail to pass this reliability test are sent to the second stage which differentiates nodules by the 3D method. The efficiency/accuracy tradeoff of this two-stage approach can be controlled by adjusting a parameter that characterizes the tolerance of the reliability test. Experimental results show, with a small loss of diagnostic performance, that the efficiency of the computerized diagnosing process can be improved significantly.
This work has restricted the number of features to two. A possible future research direction is to expand the scope using more features. In addition, to more rigorously verify the results obtained in this study, it may be valuable to repeat this work using a more comprehensive dataset.
Lung cancer, occuring in the greatest part of the world, has a considerable prevalence in Brazil. It is the second commoner kind of cancer among men and the forth commoner among women in most part of Brazilian regions.
Since precocious diagnosis represents a considerable increase in the patient’s survival chances, the proposed methodology promotes this increase, as it is shown as a very useful tool for the specialist in the attempt to anticipatemore and more the nodule identification. Another point is that the public network of hospitals in some places suffers from the lack of specialists. The resources to increase the staff, however, are also limited. Redirecting qualified craft of the available specialists to less repetitive tasks may mean making better use of their skills. One step in that direction is to use the proposed methodology in the preliminary analysis of CT exams, being the specialist just in charge of validating the result.
Finally, the proposed methodology also is a financially attractive solution because it works on simple microcomputers,many of which are already available in the hospitals. Large investments in infrastructure would not be necessary for its implantation.
References A new efficient 2D combined with 3D CAD system for solitary pulmonary nodule detection in CT images
- HeitzmanER. The role of computed tomography in the diagnosis and management of lung cancer: an overview. Chest 1986; 89(suppl 4): 237S–241S.
- HoweMA, Gross BH. CT evaluation of the equivocal pulmonary nodule. Comput Radiol 1987; 11: 61–67.
- HenschkeCI, McCauley DI, Yankelevitz DF, et al. Early Lung Cancer Action Project: overall design and findings from baseline screening. Lancet 1999; 354: 99–105. CrossRefMedlineWeb of Science
- YankelevitzDF, Reeves AP, Kostis WJ, Zhao B, Henschke CI. Small pulmonary nodules: volumetrically determined growth rates based on CT evaluation. Radiology 2000; 217: 251–256.
- ormanns D, Fiebich M, Saidi M, Diederich S, Heindel W. Automatic detection of pulmonary nodules at spiral CT: clinical application of a computer-aided diagnosis system. Eur Radiol2002; 12: 1052 -1057.
- McNitt-Gray M. Lung nodules and beyond: approaches, challenges and opportunities in thoracic CAD. Int Congr Ser 2004;1268:896–901.
- Li Q, Li F, Suzuki K, Shiraishi J, Abe H, Engelmann R, et al. Computer-aided diagnosis in thoracic CT. Semin Ultrasound CT MR 2005;25(5):357–63.
- McNitt-GrayMF,WyckoffN, Sayre JW,Goldin JG,AberleDR. The effects of co-occurrence matrix based texture parameters on the classification of solitary pulmonary nodules imaged on computed tomography. Comput Med Imaging Graph 1999;23(6):339–48.
- YiCA, LeeKS,KimEA,Han J,KimH,KwonOJ, et al. Solitary pulmonary nodules: dynamic enhanced multi-detector row CT study and comparison with vascular endothelial growth factor andmicrovessel density. Radiology 2004;233(1):191–9.
- Jeong YJ, Lee KS, Jeong SY, Chung MJ, Shim SS, Kim H, etal. Solitary pulmonary nodule: characterization with combined wash-inand washout features at dynamic multi-detector row CT. Radiology 2005;237(2):675–83.
- Suzuki K, Li F, Sone S, Doi K. Computer-aided diagnostic scheme for distinction between benign and malignant nodules in thoracic low-dose CT by use of massive training artificial neural network. IEEE Trans Med Imag 2005;24(9):1138–50.
- Fuchs TOJ, Kachelriess M, Kalender WA, Fast volume scanning approaches by X-ray-computed tomography. In: Proc IEEE Comput Soc Bioinform Conf; 2003;91(10). p. 1492–502.
- Kanazawa K, Kawata Y, Niki N, Satoh H, Ohmatsu H, Kakinuma R, etal. Computer-aided diagnosis for pulmonary nodules based on helical CT images. Comput Med Imaging Graph 1998;22(2):157–67.
- Kawata Y, Niki N, Ohmatsu H, Moriyama N. Example-based assisting approach for pulmonary nodule classification in three-dimensional thoracic computed tomography images. Acad Radiol 2003;10(12):1402–15.
- Awai K, Murao K, Ozawa A, Nakayama Y, Nakaura T, Liu D, et al. Pulmonary nodules: estimation ofmalignancy at thin-section helical CT-effect of computer-aided diagnosis on performance of radiologists. Radiology 2006;239(1):276–84.
- Mori K, Niki N, Kondo T, Kamiyama Y, Kodama T, Kawada Y, et al.Development of a novel computer-aided diagnosis system for automatic discrimination of malignant from benign solitary pulmonary nodules on thin-section dynamic computed tomography. J Comput Assist Tomogr 2005;29(2):215–22.
- Shah SK, McNitt-Gray MF, Rogers SR, Goldin JG, Suh RD, Sayre JW, et al. Computer aided characterization of the solitary pulmonary nodule using volumetric and contrast enhancement features. Acad Radiol 2005;12(10):1310–9.
- Petkovska I, Shah SK, McNitt-Gray MF, Goldin JG, Brown MS, Kim HJ, et al. Pulmonary nodule characterization: a comparison of conventionalwith quantitative and visual semi-quantitative analyses using contrast enhancement maps. Eur J Radiol 2006;59(2):244–52.
- Yeh C, Lin C-L, Wu M-T, Yen C-W, Wang J-F. A neural network based diagnosis method for characterizing solitary pulmonary nodules. Neuro computing 2008, doi:10.1016/j.neucom.2007.11.009.
- Hu S, Hoffman EA, Reinhardt JM. Automatic lung segmentation for accurate quantitation of volumetric x ray CT images. IEEE Trans Med Imag2001;20(6):490–8.
- Armato SG 3rd, MacMahon H. Automated lung segmentation and computer-aided diagnosis for thoracic CT scans. Int Congr Ser 2003; 1256:977–82.
- Kuhnigk JM, Dicken V, Bornemann L, Bakai A,Wormanns D, Krass S, etal. Morphological segmentation and partial volume analysis for volumetry of solid pulmonary lesions in thoracic CT scans. IEEE Trans Med Imag 2006;25(5):417–34. Reeves AP, Chan AB, Yankelevitz DF, Henschke CI, Kressler B, Kostis WJ. On measuring the change in size of pulmonary nodules. IEEE Trans Med Imag 2006;25(4):435–50.
- H.P.Ng, S.H.ong, K.W.C.Foong, P.S.Goh, and W.L.Nowinski, “Medical image segmentation using K-means clustering and improver watershed algorithm,” in Proc. IEEE Southwest Symposium on Image Analysis and Interpretation, pp.61-65, 2006.
- V. Grau, A. U. J. Mewes, M. Alcañiz, R. Kikinis and S. K. Warfield, “Improved Watershed Transform for Medical Image Segmentation Using Prior Information”, IEEE Transactions on Medical Imaging, Vol. 23, No. 4, April 2004
- ormanns D, Fiebich M, Saidi M, Diederich S, Heindel W. Automatic detection of pulmonary nodules at spiral CT: clinical application of a computer-aided diagnosis system. Eur Radiol2002; 12: 1052 -1057.
- M.N. Gurcan, B. Sahiner, N. Petrick, H.P. Chan, E.A.Kazerooni, P.N. Cascade, L.M. Hadjiiski, Lung nodule detection on thoracic computed tomography images: preliminary evaluation of a computer-aided diagnosis system, Medical Physics (2002) 2552–2558.
- J.R.F. da Silva Sousa, Metodologia Automatica para Deteccao de Nodulos Pulmonares, Master’s Thesis, Universidade Federal do Maranhao, 2007.
- V.N. Vapnik, Statistical Learning Theory, Wiley-Interscience, ISBN: 0471030031, URL http://www.amazon.ca/exec/obidos/redirect?tag=citeulike0420&path=ASIN/0471030031,1998.
- G. Agam, S.G.A. Iii, C. Wu, Vessel tree reconstruction in thoracic CT scans with application to nodule detection, IEEE Transactions on Medical Imaging 24 (4) (2005) 486–499.
- K. Peldschus, P. Herzog, S.A. Wood, J.I. Cheema, P. Costello, U.J. Schoepf, Computer-aided diagnosis as a second reader: spectrum of findings in CT studies of the chest interpreted as normal, Chest 128 (2005) 1517–1523.
- J.R.F. da Silva Sousa, Metodologia Automatica para Deteccao de Nodulos Pulmonares, Master’s Thesis, Universidade Federal do Maranhao, 2007.
- S. Chang, H.D. Emoto, L.A. Metaxas, Pulmonary micronodule detection from 3-D chest CT, Lecture Notes in Computer Science-Medical Image Computing and Computer-Assisted Intervention 3217 (2004) 821–828.
- X. Lu, G.-Q. Wei, J.Z. Qian, A.K. Jain, Learning-based pulmonary nodule detection from multislice CT data, CARS (2004) 1356.
- W. Mousa, M. Khan, Lung nodule classification utilizing support vector machines, in: ICIP02, III, 2002, pp. 153–156.
- J.R.F. da Silva Sousa, Metodologia Automatica para Deteccaode Nodulos Pulmonares, Master’s Thesis, Universidade Federal do Maranhao, 2007.
- K. Suzuki, Z. Shi, J. Zhang, Supervised enhancement of lung nodules by use of a massive-training artificial neural network (MTANN) in computer-aided diagnosis (CAD), in: ICPR08, 2008, pp. 1–4.
- S.-C.B. Lo, L.-Y. Hsu, M.T. Freedman, Y.M.F. Lure, H. Zhao, Classification of lung nodules in diagnostic CT: an approach based on 3-D vascular features, in: Nodule Density Distributions, and Shape Features, The International Society for Optical Engineering, Presented at the Society of Photo-Optical Instrumentation Engineers (SPIE) Conference, San Jose, California -EUA, 2003, pp. 183–189.
- X. Zhang, G. McLennan, E.A. Hoffman, M. Sonka, Computerized detection of pulmonary nodules using cellular neural networks in CT images, in: Medical Imaging 2004: Image Processing, San Diego, CA, USA, 2004.
- A. Farag, A. El Baz, G. Gimel’farb, R. Falk, Detection and recognition of lung nodules in spiral CT images using deformable templates and Bayesian post-classification, in: ICIP04 V, 2004, pp. 2921–2924.
- C.C. McCulloch, R.A. Kaucic, P.R. Mendonca, D.J. Walter, R.S. Avila, Model-based detection of lung nodules in computed tomography exams 1: thoracic computer-aided diagnosis, Academic Radiology 11 (3) (2004) 258–266.
- J.R.F. da Silva Sousa, A.C. Silva, A.C. de Paiva, Lung structure classification using 3D geometric measurements and SVM, in: CIARP, Iberoamerican Congress on Pattern Recognition, 2007, pp. 783–792.
- S.G. Armato, M.L. Giger, H. MacMahon III, Automated detection of lung nodules in CT scans: preliminary results, Medical Physics 28 (2001) 1552–1561.
- H. Arimura, S. Katsuragawa, K. Suzuki, F. Li, J. Shiraishi, S. Sone, K. Doi, Computerized scheme for automated detection of lung nodules in low-dose CT images for lung cancer screening, Academic Radiology 11 (2004) 617–629.
- S.G.A. Li, F. Giger, M.L. MacMahon, H. Sone, S. Doi III, Lung cancer: performance of automated lung nodule detection applied to cancers missed in a CT screening program, Radiology, 225 (2002) 685–692. V. Grau, A. U. J. Mewes, M. Alcañiz, R. Kikinis and S. K. Warfield, “Improved Watershed Transform for Medical Image Segmentation Using Prior Information”, IEEE Transactions on Medical Imaging, Vol. 23, No. 4, April 2004.
