A New Hybrid Classification Method for Condensing of Large Datasets: A Case Study in the Field of Intrusion Detection

Автор: SAEED Khazaee, ALI Bozorgmehr
Журнал: International Journal of Modern Education and Computer Science (IJMECS) @ijmecs
Статья в выпуске: 4 vol.7, 2015 года.
Бесплатный доступ
In large data sets data pre-processing always has been the most essential data processing stages. Sampling and using small volumes of data has been an integrated part of data pre-processing to decrease training errors and increase speed of learning. In this study, instead of sampling from all data and using small parts of them, a method has been proposed to not only benefit from sampling but all data be used during training process. In this way, outliers would be detected and even used in completely different way. Using artificial neural networks, new features for instances will be built and the problem of intrusion detection will be mapped as a 10- feature problem. In fact, such a classification is for feature creation and as features in new problem only have discrete values, in final classification decision tree will be used. The results of proposed method on KDDCUP'99 datasets and Cambridge datasets show that this has improved classification in many classes dramatically.
Intrusion Detection, Artificial Neural Network, Decision Tree, Sampling
Короткий адрес: https://sciup.org/15014747
IDR: 15014747
Текст научной статьи A New Hybrid Classification Method for Condensing of Large Datasets: A Case Study in the Field of Intrusion Detection
Published Online April 2015 in MECS DOI: 10.5815/ijmecs.2015.04.04
Recently and due to significant increase in computer networks and the attempts to intrude the networks, most of studies in the field of computer sciences and information technology have been allocated to intrusion detection with different methods presented to implement these intrusion detection systems.
In most research related to classification problems, preprocessing plays a significant role in improving their classification accuracy [1]. Considering that the intrusion detection problem in a general case of multi- class classification problem with large number of training instances, training data preprocessing has always gained the attention of researchers [2-3]. Usually smaller pats of the data sets are used to train the system, thus so the high volume of data would not reduce the performance of system during training process [4-7].
It should be noted that the more use of training instances may lead to identifying more appropriate patterns which makes better model [8]. Therefore, the method that can utilize all available training instances with no negative impact of high volume of training instances can be very useful and interesting. It has been tried to make use of almost all training instances in the proposed method in order to improve intrusion detection with training instances segmenting and use of them in several different phases. So instead of the usual use of a small part of training instance, initially 10% of the instances in the form of stratified detached and then 90% of the remainder will be used in training features’ creation classifiers.
In section II related works on IDS will be reviewed. Section III and section IV will be included a preliminary about intrusion detection and explanations about classification and clustering. In Section5 the proposed method will be explained. In section5 the proposed method is going to be compared with some other methods and its performance is evaluated and finally, section 6 draws on conclusions.
-
II. Related Works
Today, data mining approaches in the design of intrusion detection systems have been highly regarded. In a lot of research in the field of data mining the famous models such as: decision rules, decision trees [1,2], artificial neural networks [3], associative rules, backup vector machine and other kinds, has been used to discover the knowledge of the data, that is each of the techniques listed may work better for a variety of different problems than other techniques [4] and [9].
For instance, categorizing a data mining technique to build models in spaces with high dimensions as well as problems with discrete features values would be beneficial, while the same trees would not be appropriate in problems with clear boundaries among classes [3, 4]. Therefore, a specific method would not be suitable for all problems and certainly the selection of an appropriate classification algorithm for specific applications requires a careful study. Sometimes the combination of various methods of data mining and methods of classification, improves the learning process, resulting in better classification [1,2] and [4]. Data mining approaches to detect misuse and anomaly detection in Intrusion Detection Systems includes statistical methods, artificial neural networks, hidden Markov model, rule learning and other machine learning methods [3,4] and [7-9]. In the recently works about intrusion detection problem, researchers have used combination of all effective machine learning tools for improving the accuracy of the intrusion detection systems. For example, in reference [4], fuzzy clustering and neural networks have combined to separate the inappropriate samples than appropriate samples for better learning in the classification process.
In this paper, we will use fuzzy clustering and neural network and propose an impressive hybrid method for condensing large data sets that will be quite different from other hybrid methods.
-
III. Intrusion Detection
Nowadays with a wide variety of attacks and intrusions taking place in networks, techniques such as user authentication, data protection, avoid programming error, firewalls and other methods are considered of being the most primitive techniques in computer security. Currently, intrusion detection systems by systems monitoring the behavior of users and the tools they use to identify the pattern of the attacks will be inevitable. Intrusion detection approaches are divided into two main categories including 1) Misuse Detection and 2) anomaly detection.
-
A. Misuse Detection
In this way, intrusion patterns are made and kept legitimately so that any pattern contains different varieties of a specific intrusion and in the case occurrence of these patterns in the system intrusion will be announced.
The advantage of this method is that it has a high speed and accuracy when detecting intrusions with identically given to system. Therefore, this model provides for system administrators who may not even be professionals in relation to security issues with tools that they can easily monitor their system. The biggest disadvantage of this type of intrusion detection is that it only detects attacks that are already known. For this reason it is essential that the system constantly be updated of signs related to new attacks [7].
-
B. Anomaly Detection
The anomaly detection model is a system for detecting computer intrusions by searching for network traffic unusual cases [9]. Firstly, patterns of normal behaviors (system, network or users) will be made and then any violations of these patterns will be considered as anomalous and intruding. Intrusion detection systems are looking for; network traffic will be able to intrusion detection.
The advantage of this method is that, unlike the misuse detection, identification of attacks with no prior information about them would be possible biggest disadvantage of the method is that generally false alarm rate is high .This is due to the fact that behavior of network and users is not always in a way that is known in advance . Accordingly, any minor change in behavior considered as aggressive.
As mentioned above, each of the listed types of intrusion detection have advantages and disadvantages and none can be described any better than another .In this paper, the proposed system is based on misuse detection.
-
IV. Classification And Clustering
-
A. Classification
Classification is a kind of supervised learning with determined training instances labels. In classification, a set of records are given to the system as training data and each row of data sets , includes a set of feature values. One of these attributes is the class of the row or instance .Thus, the classifier, seeks for a model for the class of instances as a function of the other attributes [10]. Generally, intrusion detection is a classification problem. Various techniques for classification such as decision tree-based methods, rule-based methods; support vector machine (SVM), artificial neural networks has been used in intrusion detection [2-9]. Given that in this study, the Multilayer Perception network and decision tree are used at the various stages of the proposed approach, a brief explanation will be given.
Decision Tree: Decision tree, is one of the methods of machine learning for the classification. The technique uses an algorithm to induct a decision tree out of data is called decision tree, which is one of the most common methods of data mining. In General, decision tree learning represents on problems with in pair featurevalues instances, problems with discrete output values, and problems in which training data with errors may seem appropriate.
Artificial Neural Network MLP: The network consists of three inputs, hidden and output layers, with cells number is determined by trial and error [11]. The input signals are normalized by normalization coefficients as a normalized value and after calculations output amounts to be refunded. Also initial value weights are assumed to be random. This network is trained based on the error back propagation algorithm. Thus, the desired outputs are compared to the actual ones and weight using back propagation algorithm, applied to a set of suitable models to be monitored. Contrary to the perceptron, multilayer networks can be used in learning nonlinear problems as well as problems with multiple decisions. More information about MLP is in reference [11].
-
B. Classical and Fuzzy Clustering
Clustering means unsupervised classification or in another words, labels of the training data are not available. In the process of clustering instances are divided into groups with similar members called cluster. In classical clustering each instance belongings only and only to one cluster and it cannot be a member of two or more clusters, and thus classical clustering will face with trouble in determining which instance belongs to each cluster in a state of similarity of one or two or more instances to a cluster. The main difference between classical clustering and fuzzy clustering is that in fuzzy clustering an instance can be owned by more than one cluster, namely according to fuzzy logics, clustering belonging function not two values (0 or 1) but, may have any values between 0 and 1 [12].
Fuzzy c-means algorithm: one of the most widely used clustering algorithms is c-means algorithm. In this algorithm, the instances are divided into two or more clusters and the number of clusters pre- specified. Also, in fuzzy version of this algorithm the number of clusters is pre- specified. In Fuzzy c-means algorithm objective function is as follows:
Zf . 1 z^ 1 и№ d?k = Zf . 1 Z^ i< Hxk - . (1)
In the above formula, m is a real number greater than 1, in most cases; the amount of 2 is selected for m . where m = 1, we obtain non-fuzzy c mean clustering objective function (classical). In the above formula X k is k th instance and v i is representative or center of i th cluster and n is the number of instances. u ik is the belonging value of i th in k th . ||*|| is the amount of similarity (distance) of instance to (from) cluster center which can use any function showing the similarity of the cluster center and instance.
A U matrix can be defined by u ik with c rows and n columns, its components can be any value between 0 and 1. Where all U matrix components are U are as 0 or 1, the result algorithm is the same as c-means algorithm.
However, U matrix components can chose any values between 0 and 1, but the sum of the components of each column must be equal to 1 and we have:
Zt. 1 Utk = 1, V к = 1,...,n (2)
FCM(I);
begin read fuzziness parameter m for each in ∈ I read K (number of clusters)
until max { H ^+1) — H^ |} < ^
for each tp ∈ D (p = 1, 2, …, n)
for each cluster j (j = 1, 2, …, K) calculate µ
FP= set of fuzzy clusters (partitions) after completion of above iteration.
return (FP);
end
Fig 1. Fuzzy C-means algorithm [14]
This condition means that sum of each instance belonging to c cluster must be equal to 1 [13, 14]. Figure 1 shows this algorithm.
V. Proposed Framework Design
In this paper, a framework proposed for intrusion detection consists of four stages which are discussed in the following sections:
-
A. Preprocessing
The data sets used in this study contain the values of the properties in the form of discrete, contiguous and symbolic. Range of values of some of these attributes is very large and different with other values. Moreover, due to the high volume of data and the relatively high attributes in training data, it is evident that the intrusion detection problem in general is a high scale problem. So the current data are not suitable in an efficient classification, so it is necessary to preprocess training data. Although some other parts of the proposed framework by nature are a kind of preprocessing, but preprocessing in this context means data refinement before any data mining process which is done in two parts.
Normalization and Transformation: Training data in KDDCUP ‘99 and Cambridge datasets includes features with symbolic, discrete and continuous values, and sometimes ranges of these values are very different from some other values. Many data mining algorithms are not able to explore such data as well. So, it is necessary to transform it before any implementations. For this, all symbolic data transforms to numerical data and then the following relation is used to scale features in to the range [0, 1]:
N(m,n)= (C(m'n) - m(n)) (3) , ( M(n) - m(n) )
Where: M (n) is the maximum of column nth , m(n) is the minimum of column nth , C (m, n) is the integer value mth rows and nth columns, N (m, n) is the normalized value of the mth row of the nth character.
Feature Selection: Performance of a pattern recognition system is highly dependent on the features selection method. Most problems with high dimensions, selecting features impacting the problem and eliminating other ones, can greatly increase the accuracy of classification and decrease the complexity of data processing in later stages. For example, KDD Cup99 data includes 41 different features as well as a labeled class [15]. Generally, the intrusion detection problem data sets include less important and redundant features. In most previous works selection techniques have been used to enhance the performance of clustering and reduce the dimension of feature [16- 20]. In this paper, the need to reduce the size of the problem by ranking method based on the characteristics of each class with the highest score are selected .This is done by using Chi-Squared Attribute Evaluation. The Chi-Squared is a popular feature selection method that evaluates features individually by computing Chi-Squared statistics with respect to the classes. Comparison with other methods of feature selection in Weka showed that this method is effective and suitable to select attributes [20].
-
B. Detection and Isolation of Outliers
At this stage and after normalization and feature selection, applying a method of fuzzy clustering, outliers will be separated from training instances and collected in another set of data. In this paper clustering is done through a Fuzzy c-means algorithm. For example, there will be 5 clusters on KDD CUP’99 dataset after algorithm application. It should be noted that the clustering was done on MATLAB (R2010a) software; accordingly, clustering of all instances begins with the following command:
[center,U,obj_fcn] = fcm(data, n_clusters) (4)
Clustering of instances is carried out without regarding the instances classes. Here the center is the final cluster center matrix, U a matrix that indicates the degree of membership of every instance of clusters, obj_fcn Values for each iteration observations, data is what on it clustering will be done and n_cluster the number of clusters.
Separation is carried out in two phases with two different approaches:
Using the Membership Degree for Data Separation: In this approach using U –matrix instances with no relevant membership degrees to any of the clusters are separated. Table 1 shows a part of U matrix for the four instances. In this table, S1 to S 4 , are 4 instances for C 1 to C 5 membership degree and cluster instances are 5. Considering that the intrusion detection problem is a problem of classification, sampling should be to improve the classification. Given that clustering in this problem could be with 5 clusters we can conclude that cluster is correspondent to each class. Thus, where an instance shows the higher degree of membership in a clusters than others, we can say that probably, the mentioned instance has the class label similar to that of cluster. So, if maximum membership degree of an instance to clusters for example C i shows a short distance to other membership degree ({C k : 1 < k < 5, k⧧i}), so it is not possible to consider the instance class the same class of cluster C i Clearly an instance with such a property is not a good representative for any of the classes.
Thus, these instances in appropriate pattern building process for each class and actually the training of final classifier would have a negative impact. Table 1 show an example of such a property is in S4. In this table, the maximum membership degree is determined by the color gray.
The maximum membership degree of S 4 in C 4 equals to 0.3808. In the proposed approach, given that this number is smaller than 0.5, the instance will be removed from the original data and the instances S 1 , S 2 , S 3 with appropriate membership degrees at C 4 , C 5 , C 3 will remain.
The remaining data sets are called Remained-Dataset from this point. Removed instances will be considered as a separate data set called Removed-dataset. Data in Removed-dataset are not suitable for training, but consider that these instances of test data might exist and removing them makes no pattern of these outliers for final classification. Thus, the instances in Removed- dataset are collected separately to be used differently in the future.
Using the Similarity between the Clusters and Instances Classes to Separate Data: As mentioned earlier, in this problem, the clustering was done with 5 clusters, therefore each cluster is correspondent with a class. In this step the first clusters are named; so that the name of each cluster will be similar to the same cluster class name. In this approach, where a majority of the instances in a cluster are of the class i, the cluster will be similar to class i. After clusters were named, it is time to remove the inappropriate examples.
-
C. Creating Features and Dataset Changing
Dataset Changing: this stage of the proposed method 10 new features for each instance will be created so that previous features would be put aside after final model feature creation stage for intrusion detection. As already mentioned, the training data are partitioned into three data sets (Figure 2): TrD 1 , TrD 2 and Removed Data. TrD 1 consists of about 90 % of total training instances to train a few paragraphs here under the name of “Feature creation classifiers (FC-Classifiers)". Also, TrD2 which consists of 10 % of instances will be used in the final feature creation and decision tree training.
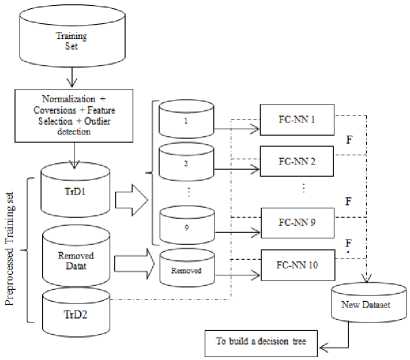
Fig.2. Changing of dataset to the New Training set
TrD1 data set will be used to train the 9 feature creation classifiers, because each classifier will be trained by approximately 10% of the data. Moreover, Removed-Data data set which has been created in separation stage will be used in 10th feature creation classifier's training. Many researchers explore the outliers remove them from data training [21-23]. In this paper, outliers indirectly participate in the training process and are used to create 10th new feature. The use of these data will be shown in the experimental results. As mentioned earlier and shown in Figure 2, TrD1 be partitioned into 9 sections. In this figure, each FC-NN is an artificial neural network of MLP kind and Back propagation algorithm including two hidden layers and use TanhSigmoid activation function for each neuron. Each of the nine sections of TrD1 and outlier dataset or Removed-D is considered to train a neural network of FC-NN1 to FC-NN10. Thus, FC-NN is being trained by training data. Although these trained networks will be appeared as the classifier in the next stage, the ultimate goal is to create an attribute. For example, in the implementation of the KDD Cup99 dataset after attribute selection stage, each classifier has 15 entries. The 14 input values related to selected attributes of each connection and label related to each of mentioned classes as target will be selected to classifiers. Thus, the output values of each of these classifiers will be one of Dos, Normal, R2L, Probe, and or U2R classifiers. TrD2 will be used in the next phase other part of training data, for two important purposes:
-
• TrD2 use in New-TrD2 building: at this point any instance contained in TrD 2 , regardless of its original label, will be tested with every single feature creation classifiers and regarding classifiers responses will be located in 5 similar or different classes. Response of each classifier for each instance, such as A will be a new feature, so that the values of these features may be Dos, R2L, Normal, Probe, and or U2R. These new features put together, and out of instance A new instance called A' will be created. Thus, instance A' instead of 14 properties will have 10 properties that have been created by the FC-Classifier (Figure 2).The values of these attributes are the classes and accordingly, it is clear that the values for each attribute is discrete and one of the five classes listed. Hence, attributes creation transition will creates a new data set in which each instance contains only 10 created attribute. This data set is called New-TrD 2 .
-
• New-TrD 2 use in training decision tree building: after new attributes creation and New-TrD2 data sets building final classifier will be trained by this data set. As previously mentioned, this data set includes instances with the attribute values of Dos, R2L, Normal, Probe, and or U2R, so it is clear that attribute values are located in a small set of discrete values. In problems where each attribute has a fixed small number of possible values decision tree acts very powerfully [24]. In addition, the construction of the model is easier compared to many other classifiers. On the other hand, Decision tree training methods are more resistant to errors than other training data and considering that the attribute values created may contain error, they can be a good option for the final classification decision tree.
-
D. Decision Tree Construction from New-TrD2Data Set
In previous stage each instance selected in TrD2 with 14 attributes has been transformed to an instance with 10 attribute by a system based on neural network model. So, TrD 2 data set transformed to a data set with discrete values. This data set is called New-TrD 2 will be used for training a classifier. As mentioned earlier, Depending on the type of data in the dataset, decision tree would be very convenient option. But it should be noted that new data set considering values and the limited number of attributes in the new data set, there would be very high chance of getting duplicate data. The test results will determine that much of the data are removed and the data reduction would be desirable for fast decision tree creation. Figure 3 shows proposed framework that j48
decision tree is used which is based on C4.5 algorithm. Figure 4 shows the pruning decision tree dataset created by KDD CUP'99 data set.
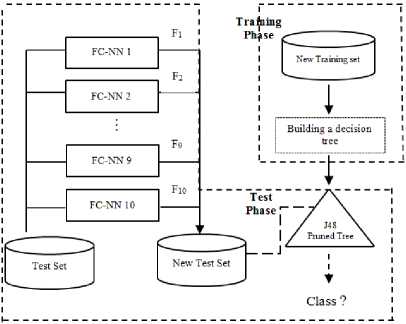
Fig.3. Proposed framework
-
F3 = Normal
| F9 = Normal: Normal
| F9 = DoS: Normal
| F9 = Probe: DoS
| F9 = R2L: DoS
| F9 = U2R: DoS
F3 = DoS
| F4 = Normal: Normal
| F4 = DoS: DoS
| F4 = Probe: DoS
| F4 = R2L: DoS
| F4 = U2R: DoS
F3 = Probe
| F10 = Normal: DoS
| F10 = DoS
| | F9 = Normal: Normal
| | F9 = DoS: DoS
| | F9 = Probe
| | | F1 = Normal: DoS
| | | F1 = DoS: DoS
| | | F1 = Probe: R2L
| | | F1 = R2L: DoS
| | | F1 = U2R: DoS
| | F9 = R2L: DoS
| | F9 = U2R: DoS
| F10 = Probe
| | F4 = Normal: Normal
| | F4 = DoS: Normal
| | F4 = Probe
| | | F6 = Normal: Probe
| | | F6 = DoS: DoS
| | | F6 = Probe: Probe
| | | F6 = R2L: Probe
| | | F6 = U2R: Probe
| | F4 = R2L: DoS
| | F4 = U2R: DoS
| F10 = R2L: DoS
| F10 = U2R: DoS
F3 = R2L
| F1 = Normal: Normal
| F1 = DoS
| | F2 = Normal: Normal
| | F2 = DoS: DoS
| | F2 = Probe: DoS
| | F2 = R2L: DoS
| | F2 = U2R: DoS
| F1 = Probe: DoS
| F1 = R2L: Probe
| F1 = U2R: DoS
F3 = U2R
| F9 = Normal: Normal
| F9 = DoS: R2L
| F9 = Probe: Normal
| F9 = R2L: Probe
| F9 = U2R: Probe
Fig 4. pruned decision tree created form KDD cup99 dataset
-
VI. Results And Discussion
In this section, the results of experiments conducted on two datasets KDD CUP'99, and Cambridge datasets is presented and it is worth mentioning that the simulation software MATLAB on a PC Pentium IV processor with dual-core 3.6 GHz, the systemWindows7 OS and 4GB of main memory are applied.
-
A. Evaluation Criteria
Generally, false negative, false positive (false alarm), true negative, and true positive (Detection rate) Criteria are proposed for evaluating the accuracy of an intrusion detection system. True positive indicates that the system detected attack is true and it really happened. True negative indicates that the system does not detect a normal connection and a non-attack as an attack. False positive indicates that the system has detected a special attack erroneously. False negative indicates that the system has failed detecting an occurred attack. Given that the number of training instances and testing for used certain classes is not suitable, accordingly it requires the use of criteria where the number of instances and test does not show any negative impact on accuracy. Recall and F-value are such measures do not depend on the size of the training and testing data so here they are used to evaluate the system. Values close to 1 would be appropriate for these measures. Equation (5) and (6) show how to calculate Precision and Recall where FN, FP, and TP are True Positive, False Positive, and False Negative respectively. Also, equation (7) shows have to calculate the F-value where β equals to proportional importance of Precision compared to Recall; its value is generally considered to be 1.
Precis ion = ———
TP + FP
R e с a 11 = ———
TP + FN
( 1 + g2^ x Reca. 11 x Pre cisi о n г v a I и e ~ “ ,, . „ г-, ■
Pz x (R e ca 11 + P rec isi о n)
At the stage of attribute selection, using a method based on the rating, 14 attributes with higher scores together with each instance class have been selected. This was done by Chi-Squared Attributed Evaluation method. 14 attributes with higher ratings were selected. According to the proposed method at the stage, after the isolation of outliers, this data set was collected in a set called Removed-D. This data set contains 68 instances labeled Probe, 13 instances labeled U2R, 1470 instances labeled DOS, 27 instances labeled R2L, and 629 instances labeled Normal. So it is clear that Removed-D in comparison to the size of data is very small.
To show the impact of the use of the data sets in proposed approach, attributes were created once without the use of this data set by applying 9 artificial neural networks, and later on using these data sets and 10 artificial neural network's feature. However, the new data set with 10 attributes emerged after the elimination of redundant data instances. The Number of remained instances for decision tree creation is less than 2% of the total variance. In the final stage of training, the training data set converted to a smaller data set which was an abstract of the original data set.
The remaining instances for each class are shown in Figure 4. Figure 5 shows the decision tree generated by the algorithm J48. After tree pruning, tree size was 66 with 53 leaves. As the tree shape indicates, F 10 feature created by FC-NN 10 neural network and Removed-D plays a relatively important role in the tree decision making. Table 3 clearly indicated that created attribute by outliers leads to significant improvement especially in Probe and R2L attacks detection. In Table 4, the methods proposed by some earlier works with Weka and the measures of Precision, Recall and F-value are compared. To get to Weka results, the test data set is not changed, but instead of using all the training instances, a stratified method was applied to sampling. In this table it is clear that the proposed method acts more accurately in detecting Dos, R2L and U2R attacks. In Table 5 proposed method was evaluated by Accuracy, Detection Rate and False Alarm Rate Criteria.
B. KDD CUP’99 Data Set Results
KDD CUP’99 data set is a standard data set in intrusion detection problems provided in 1999. This set includes LAN Air America network connectivity information as well as a wide variety of simulated attacks. KDD CUP’99 data set may be used in intrusion detection systems evaluations, but due to high amounts of data in KDD CUP’99, most papers generally use small portion of the in training and system evaluations [25-27]. This paper applies all training instances used in different stages. In this data set , the types of attacks against computer networks categorized into four, DOS, Probe, U2R, R2L. Also consider another set i.e. Normal, entries will belong to one of five categories above .Table 2 shows the number of instances in the data set.
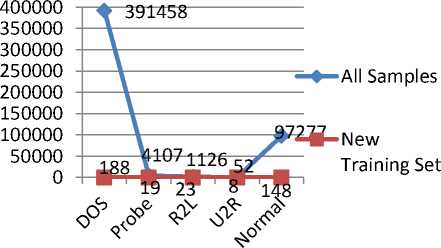
Fig 5. Number of samples in new training set versus original dataset (KDD CUP99 dataset)
Table 1. Matrix U for 5 samples in KDD Cup dataset
|
Membership: Samples |
C1 |
C2 |
C3 |
C4 |
C5 |
|
S1 |
0.0025 |
0.0247 |
0.0140 |
0.9417 |
0.0171 |
|
S2 |
5.2043 |
5.6872 |
4.4742 |
7.5706 |
0.9999 |
|
×10-6 |
×10-6 |
×10-6 |
×10-6 |
||
|
S3 |
0.0411 |
0.0313 |
0.9019 |
0.0038 |
0.0219 |
|
S4 |
0.1920 |
0.1851 |
0.2002 |
0.3808 |
0.0419 |
Table 2. Samples in KDD CUP99 dataset
|
Class Number |
ClassName |
Number of Samples |
|
|
Train |
Test |
||
|
1 |
DOS |
391458 |
229853 |
|
2 |
Probe |
4107 |
4166 |
|
3 |
R2L |
1126 |
16189 |
|
4 |
U2R |
52 |
288 |
|
5 |
Normal |
97277 |
60593 |
Table 6. Comparing of the proposed method with other methods in terms of DR, and Accuracy. (Experiments on KDD CUP99)
|
Method Metric |
TCSA [29] |
Bayesian Analysis Technique [31] |
Proposed Method |
|
|
Q |
WWW |
65.97 |
99.27 |
100 |
|
|
56.85 |
90.69 |
98.6 |
|
|
FTP-CONTROL |
89.26 |
89.76 |
100 |
|
|
FTP-PASV |
89.26 |
89.76 |
95.6 |
|
|
ATTACK |
58.08 |
13.46 |
21.1 |
|
|
P2P |
45.59 |
36.45 |
46.8 |
|
|
DATABASE |
20.20 |
86.91 |
100 |
|
|
FTP-DATA |
89.26 |
89.76 |
100 |
|
|
MULTIMEDIA |
59.45 |
80.75 |
92 |
|
|
SEVICES |
91.19 |
63.68 |
97.7 |
|
|
Accuracy (%) |
83.98 |
93.73 |
99.5 |
|
Table 7. Comparing of the proposed method with other methods in terms of precision, recall and f-value. (Experiments on KDD CUP99)
|
Classes |
Measurements |
Methods |
|||||
|
Decision Tree |
Naïve Bayes |
BPNN |
Ridor |
SVM |
Proposed Method |
||
|
WWW |
Precision |
0.871 |
0.941 |
0.923 |
0.846 |
0.948 |
0.995 |
|
Recall |
0.911 |
0.978 |
0.858 |
0.903 |
0.962 |
1 |
|
|
F-value |
0.891 |
0.959 |
0.889 |
0.874 |
0.955 |
0.997 |
|
|
|
Precision |
0.684 |
0.873 |
0.956 |
0.912 |
0.709 |
0.999 |
|
Recall |
0.746 |
0.813 |
0.898 |
0.994 |
0.852 |
0.994 |
|
|
F-value |
0.714 |
0.842 |
0.926 |
0.951 |
0.774 |
0.996 |
|
|
FTP-CONTROL |
Precision |
1 |
0.934 |
0.922 |
0.999 |
1 |
1 |
|
Recall |
0.999 |
0.916 |
0.995 |
0.967 |
0.999 |
1 |
|
|
F-value |
0.999 |
0.925 |
0.957 |
0.983 |
0.999 |
1 |
|
|
FTP-PASV |
Precision |
0.993 |
0.902 |
0.713 |
0.609 |
0.998 |
0.988 |
|
Recall |
0.947 |
0.891 |
0.689 |
0.887 |
1 |
0.956 |
|
|
F-value |
0.969 |
0.896 |
0.700 |
0.723 |
0.999 |
0.972 |
|
|
ATTACK |
Precision |
0.302 |
0.213 |
0.101 |
0.333 |
0.189 |
0.25 |
|
Recall |
0.113 |
0.139 |
0.151 |
0.014 |
0.143 |
0.211 |
|
|
F-value |
0.164 |
0.168 |
0.121 |
0.027 |
0.163 |
0.229 |
|
|
P2P |
Precision |
0.545 |
0.847 |
0.876 |
0.881 |
0.878 |
0.936 |
|
Recall |
0.479 |
0.581 |
0.358 |
0.526 |
0.562 |
0.468 |
|
|
F-value |
0.51 |
0.689 |
0.508 |
0.659 |
0.685 |
0.624 |
|
|
DATABASE |
Precision |
0.92 |
0.866 |
0.92 |
0.912 |
0.964 |
0.994 |
|
Recall |
0.961 |
0.381 |
0.936 |
0.994 |
0.971 |
1 |
|
|
F-value |
0.94 |
0.529 |
0.927 |
0.951 |
0.967 |
0.997 |
|
|
FTP-DATA |
Precision |
0.968 |
0.971 |
0.899 |
0.998 |
0.997 |
1 |
|
Recall |
0.992 |
0.912 |
0.923 |
0.972 |
0.998 |
1 |
|
|
F-value |
0.978 |
0.941 |
0.911 |
0.985 |
0.997 |
1 |
|
|
MULTIMEDIA |
Precision |
0.544 |
0.722 |
0.456 |
0.766 |
0.688 |
0.885 |
|
Recall |
0.43 |
0.596 |
0.644 |
0.891 |
0.81 |
0.92 |
|
|
F-value |
0.48 |
0.653 |
0.534 |
0.823 |
0.744 |
0.902 |
|
|
SERVICES |
Precision |
1 |
0.97 |
0.983 |
0.999 |
1 |
1 |
|
Recall |
0.973 |
0.923 |
0.976 |
0.987 |
0.946 |
0.977 |
|
|
F-value |
0.986 |
0.946 |
0.979 |
0.993 |
0.972 |
0.989 |
|
-
B. Results on Cambridge Datasets
This data set is based on the footprint record at network in form of 10 separate data sets. This data was collected on the Genome Campus network in August 2003 [28]. Stored file format for these 10 data sets is so that its reading is done via Weka software. The number of instances in each of data sets is different. Table 6 shows flow a record of each dataset, as well as any type of existing labels. Each instance in this data set has 248 attributes which are available at Weka after attributes selection using Best-First. The number of effective attributes reduced to 7, and all tests done by 8 attributes one of them is of instance class. Also, in this data set
outliers are located in Removed-D using proposed approach, dataset outliers includes 1003 data with www label, 234 data with MAIL label, 63 data with FC label, 14 data with FP label, 369 data with ATTACK label, 19 Data with P2P label, 11 data with DB label, 6 data with FD label, 9 data with MM label, and 13 data with SRV label. Data labeled INT and GM were not included in tests. Ks. Table 6 shows the comparison between proposed methods and two previous works [29, 30]. This table clearly shows that proposed method has been successful in classifying all classes. Although, proposed method in classifying ATTACK class than TCSA [29] is weaker, but the other classifications, particularly FC, FD, WWW and DB are very good and everything is done
correctly. Table 7 shows the comparison between the proposed method and some existing methods in Weka [31] and the criteria of precision, Recall and F-value. This table indicates that the classification accuracy is favorable in most classes.
-
VII. Conclusion
In this research, all training data using the new approach were applied in several steps. Most of the training instances were used to build and modify training dataset. Also outliers instead of putting aside are used to build an importance attribute. Due to a change of data sets and discrete values of the attribute values, J48 decision tree was used as the final classifier.
Detection and training speed in this method is slightly lower due to the use of multiple artificial neural networks in attributes creation. However, this method has the quality of parallel implementation of its different parts, thus parallel processing largely speeds up detection systems. This method is well suited for large data sets and is quite capable of using different data sets, and in general we can say that the high volume of data in this method makes learning algorithms suffer fewer difficulties. The results of the proposed method implemented shows significant improvements in the proposed system criterions as Detection Rate, False Alarm Rate, Accuracy Precision, and Recall, F-value compared to other methods of Weka and previous works.
Список литературы A New Hybrid Classification Method for Condensing of Large Datasets: A Case Study in the Field of Intrusion Detection
- Yuksel Ozbay, Gulay Tezel. A new method for classification of ECG arrhythmias using neural network with adaptive activation function. Digital Signal Processing 2010; 20(4):1040–1049.
- Yuksel Ozbay, Rahime Ceylan, Bekir Karlik. A fuzzy clustering neural network architecture for classification of ECG arrhythmias. Computers in Biology and Medicine 2006; 36: 376–388.
- Saeed Khazaee, Maryam Sharifi Rad. Using fuzzy c-means algorithm for improving intrusion detection performance. In: 2013 13th Iranian Conference on Fuzzy Systems, 27-29 Aug 2013, doi: 10.1109/IFSC.2013.6675669, IEEE Computer society.
- Saeed Khazaee, Karim Faez,"A Novel Classification Method Using Hybridization of Fuzzy Clustering and Neural Networks for Intrusion Detection", IJMECS, vol.6, no.11, pp.11-24, 2014.DOI: 10.5815/ijmecs.2014.11.02.
- Jose´ M. Jerez, Ignacio Molina, Pedro J. Garcıa-Laencina, Emilio Alba, Nuria Ribelles, Miguel Martın , Leonardo Franco. Missing data imputation using statistical and machine learning methods in a real breast cancer problem. Artificial Intelligence in Medicine 2010; 50(2): 105-115.
- Shih-Wei Lin, Kuo-Ching Ying, Chou-Yuan Lee, Zne-Jung Lee. An intelligent algorithm with feature selection and decision rules applied to anomaly intrusion detection. Applied Soft Computing 2012; 12(10) 3285–3290.
- S.J. Han, S.B. Cho. Detecting intrusion with rule-based integration of multiple models. Computer & Security, 2003; 22(7): 613-623.
- Subhash Chandra Pandey, Gora Chand Nandi. TSD based framework for mining the induction. Journal of Computational Science 2013; available online on Elsevier.
- S. Kummar. Classification and detection of computer intrusions. Ph.D Thesis, Purdue University, 1995.
- Pang-Ning Tan, Michael Steinbach, Vipin Kumar. Introduction to Data Mining. Boston: Pearson Addison Wesley, 2005.
- D. Fisch, A. Hofmann and B. Sick. On the versatility of radial basis function neural networks: A case study in the field of intrusion detection. Information Sciences 2010; 180(12): 2421-2439.
- F. Keller. Clustering. Computer University Saarlandes, Tutorial Slides.
- J. C. Bezdek. Pattern Recognition with Fuzzy Objective Function Algorithms. New York: Plenum, 1981.
- J.C. Bezdek, R. Ehrlich, W. Full. FCM: The fuzzy c-means clustering algorithm. Computers & Geosciences 1984; 10: 191-203.
- 1999 KDD Cup Competition (Available on http://kdd.ics.uci.edu/databases/kddcup99/kddcup99.html).
- Gang Wang, Jinxing Hao. A new approach to intrusion detection using Artificial Neural Networks and fuzzy clustering. Expert Systems with Applications 2010; 37: 6225–6232.
- M. Sheikhan and M. Sharifi Rad. Misuse detection based on feature selection by fuzzy association rule mining. World Applied Sciences Journal (Special Issue of Computer & Electrical Engineering) 2010; 10: 32-40.
- H.T. Nguyen, K. Franke and S. Petrovi'c. Towards a generic feature-selection measure for intrusion detection. In: 20th International Conference on Pattern Recognition; 23-26 Aug 2010, pp. 1529-1532, 2010.
- A. Zainal, M.A. Maarof and S.M. Shamsuddin. Feature selection using Rough-DPSO in anomaly intrusion detection. Lecture Notes in Computer Science, Computational Science and its Applications 2007; 4705: 512–524.
- Z. Farzanyar, M. Kangavari and S. Hashemi, "Effect of similar behaving attributes in mining of fuzzy association rules in the large databases", Lecture Notes in Computer Science, Computational Science and its Applications, Volume 3980, pp. 1100 – 1109, 2006.
- F. Martínez-Álvarez, A. Troncoso, J.C. Riquelme, J.S. Aguilar–Ruiz. Discovery of motifs to forecast outlier occurrence in time series. Pattern Recognition Letters 2011; 32(12): 1652–1665.
- Oral Alan, Cagatay Catal. Thresholds based outlier detection approach for mining class outliers: An empirical case study on software measurement datasets. Expert Systems with Applications 2011; 38(4): 3440–3445.
- Zhenxia Xue, Youlin Shang, Aifen Feng. Semi-supervised outlier detection based on fuzzy rough C-means clustering. Mathematics and Computers in Simulation 2010; 80(9): 1911-1921.
- Phurivit Sangkatsanee, Naruemon Wattanapongsakorn, Chalermpol Charnsripinyo. Practical real-time intrusion detection using machine learning approaches. Computer Communications, 2011; 34(18): 2227–2235.
- Mansour Sheikhan, Maryam Sharifi Rad. Gravitational search algorithm–optimized neural misuse detector with selected features by fuzzy grids–based association rules mining. Neural Computing and Applications 2013; 23(7): 2451-2463.
- A. N. Toosi, M. A. Kahani. New approach to intrusion detection based on an evolutionary soft computing model using neuro-fuzzy classifiers. Computer Communications 2007; 30: 2201–2212.
- S.J. Horng, M.Y. Su, Y.H. Chen, T.W. Kao, R.J. Chen, J.L. Lai and C.D. Perkasa. A novel intrusion detection system based on hierarchical clustering and support vector machines. Expert Systems with Applications 2011; 38(1):306-313.
- Hongli Zhang, Gang Lu, Mahmoud T. Qassrawi, Yu Zhang, Xiangzhan Yu. Feature selection for optimizing traffic classification. Computer Communications 2012; 35(12): 1457–1471.
- Denis Zuev, Andrew W. Moore. Traffic Classification using a Statistical Approach. Technical report, Intel Research, Cambridge, 2005.
- Andrew W. Moore, Denis Zuevy. Internet Traffic Classification Using Bayesian Analysis Techniques. Technical report, Intel Research, Cambridge, 2005.
- Witten, I. H., & Frank, E. Data mining: Practical machine learning tools and techniques. Boston: Morgan Kaufmann Publishers, 2005.
