A New Method of Equivalent Material Model Deformation Observation

Author: Lailiang CAI, Kan WU, Qisheng YU,Jinpeng FENG
Journal: International Journal of Modern Education and Computer Science (IJMECS) @ijmecs
Article in issue: 5 vol.3, 2011.
Free access
Equivalent Material Model is a staple method that can be used to imitate the strata and the ground surface movement which caused by human’s underground activities, such as coal resources extraction. The precision of indoor imitations are mainly decided by ways of models’ deformation observation. This paper proposes a new method of measuring models after analyzing the status of deformation observation of equivalent material models. In this paper, the industrial measuring system is used to measure deformations of the model. The system includes two main parts: photographic surveying of industry instruments and structure lighting scanning devices. The first part is used to get the coordinates of the target points which are set on the model; the second one is used to scan the model surface for catching the cracks on the model surface. Due to the high accuracy of photographic surveying of industry method, it can meet the need of monitoring imperceptible movements of target points; also the structure lighting scanning has a high precision on scanning the model surface, which can get the very thick points cloud of the model surface. The system is originally used for reverse engineering, and it scarcely used for Equivalent material model until our research used, so there is no mature method on data management. This paper researches the special data procession method for the model, and results show that methods in the paper are suit for the industrial measuring system.
Short address: https://sciup.org/15010263
IDR: 15010263
Text of the article A New Method of Equivalent Material Model Deformation Observation
Published Online August 2011 in MECS
Wherever minerals are won by underground mining, the overlying rock mass subsides into the underground cavities opened by mining, and the upper surface of the ground subsides correspondingly, forming hollows,
National environmental nonprofit industry-specific subsidies of China (200809128); Qing Nan Project.
trenches and extensive troughs [1]. Mining subsidence is a terrible environment problem in mining areas. It is very significant to research the mechanism of strata and the ground surface movement which caused by mining. There are many ways to research it. The direct one is surveying in the open air, and then using the statistic results of the field data to describe the ground movement; the other way is indoors imitation (physical imitation or numerical imitation). The real data of ground movement can be gotten from the open air works, but the work cannot be repeated at the same place, and it costs too much manpower and money, especially it’s very hard to get the movement laws inside the rock layers by using the ground surface observations. The indoors imitation cannot provide the real filed data, but it can be repeated. It’s easy to get laws of mining subsidence, not only on the ground surface, but also on the underground strata movement. The equivalent material model is used to imitate the strata movement which is caused by mining since 1937 in Soviet Union [2]. In China, the similar work started in 1958. Equivalent material model imitates the movement of ground and strata should follow the similarity principles. The real strata and coal seam have to be constricted before their model is made. After the model is finished, imitating coal excavating is carried out, and the excavating makes the model deformed. For studying the mechanism, it’s very significant to monitor the deformations. In traditional ways, people use theodolite [3], total station and close-range photogrammetry technology [4, 5, and 6], etc, to monitor the movements of target points on the model. For there are hundreds of points on the model, the theodolite and total station method only observe the point one by one, and the work efficiency is too low and the progress is too slow, so the photogrammetry is much better than the theodolite method, but the precision should be improved. In YANG Huachao’s paper, the precision is about 1mm, and there is room to be improved. The crack information of the model cannot be acquired by using traditional ways. In this paper, a new method of deformation observation on equivalent material model is proposed. The researcher uses a kind of industrial measuring system which includes photographic surveying of industry instruments and structure lighting scanning devices, which can be used to monitor the deformations on equivalent material model. In the fallowing parts of this paper, the basic concepts of Equivalent material model. Next part will discuss the observation system and the method of data procession in details.
-
II. basic theories of Equivalent material model
Using equivalent material model to imitate coal seam and rocks should follow some similarity laws. Model and real strata must have similarity on geometric, kinematic and dynamical [2].
-
A. Geometric Similarity
The equivalent material model and its archetype should have geometric similarity. The length, height and width of model must have the same scale. The relationship between model and archetype is as follow:
al = l / L al –Scale; l- length of model; L-length of archetype
-
B. Kinematic Similarity
The equivalent material model and its archetype should have kinematic similarity. The corresponding points on model and its archetype should have similar movement. The time of the movement of corresponding points must be proportioned. The relationship is as follow:
at =t /T at –time scale; t- Time of the model costs to finish the movements; T-Time of archetype costs to finish the movements.
C. Dynamical Similarity
The equivalent material model and its archetype should have kinematic similarity. The applied loads of model and archetype similar. The relationship is as follow:
l
RM , l
M
H
• M • Rh rH
R M - mechanical property of equivalent material
RH- mechanical property of real rock rM- density of equivalent material rH- density of real rock lM- length of equivalent material model lH- length of archetype
-
III. Equivalent material model experiment system
The experiment system of equivalent material model has two main parts: the model and observation system.
-
A. Equivalent Material Model
Equivalent materials are sand, mica powder, gypsum powder, light calcium carbonate powder and water, etc. After calculating out the strength of equivalent material with the similarity laws, the mixture ratio of equivalent material can be worked out [1]. The materials are mixed together according to the mixture ratio before putted into an iron box which is used to shape the model. One example of mixture ratio data is in table1. The model is completed when the box is set about 5 or 6 days later. An instance of equivalent material model is showed in Fig.1.
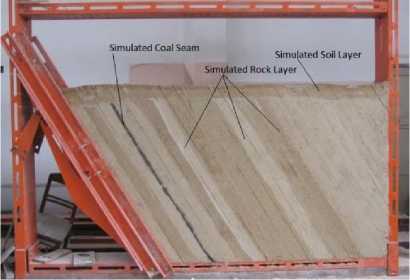
Figure 1. An instance of equivalent material model
TABLE I.
an example of E quivalent M aterial mixture ratio
|
Rocks |
Compressive strength |
Material |
Cementing agent |
||||
|
Real (Mpa) |
Model (N/cm2) |
Sand |
Mica powder |
Cementing agent |
Plaster |
Light calcium carbonate |
|
|
Mudstone |
12.7 |
3.74 |
80 |
17 |
3 |
3 |
7 |
|
Sand mudstone |
27.7 |
7.71 |
80 |
17 |
3 |
7 |
3 |
|
Sandy shale |
37.2 |
10.61 |
71 |
23 |
6 |
3 |
7 |
|
Shale |
20 |
5.66 |
80 |
18 |
2 |
7 |
3 |
|
Limestone |
87.8 |
20.98 |
70 |
12 |
18 |
3 |
7 |
|
Glutenite |
54.7 |
15.84 |
71 |
23 |
6 |
5 |
5 |
|
Siltstone |
76.2 |
21.45 |
70 |
22 |
8 |
5 |
5 |
|
Coarse sandstone |
91.2 |
26.82 |
74 |
16 |
10 |
5 |
5 |
|
Conglomerate |
90.8 |
23.89 |
71 |
23 |
6 |
7 |
3 |
should be B. Observation System
After finishing the model, simulated mining is carried out. For analyzing the influence of mining to ground and rock layer, some measures to monitor the deformation of
the model should be taken. The observation method of equivalent material model has been researched for a long time. First we use steel ruler method, then bulb-lens method, the theodolite method, total station method, short distance photogrammetry, and 3D laser scanning technology. The steel ruler method for model deformation measurement can only get the displacement of target point on one direction. The bulb-lens method can get the points’ displacement on two directions: the vertical and horizontal. The steps of the method are: firstly, the miniature bulb should be attached to the model surface; secondly, a set of magnifying glasses should be installed between the bulb and screen on the wall; lastly, the filament of the light bulb can be projected on the screen through the magnifying glass. It’s a classic method, which is popular to be used in china, but it’s too manual to be operated, and it cannot set too many points on the model at once, these are its limitations. There is a sketch map of it in Fig.2.
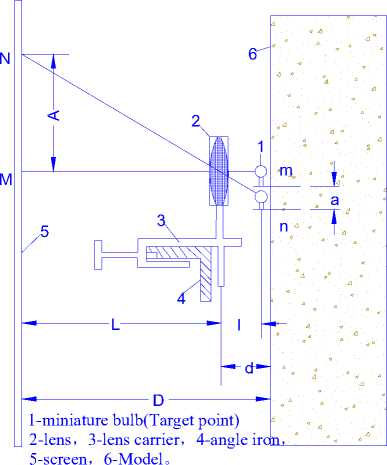
Figure 2. Sketch map of bulb-lens method
The theodolite method and total station method can be used to observe the target point by point, if there are hundreds point, it will take too much time to finish the work. Short distance photogrammetry and 3D laser scanning technology are advanced technologies for 3D scene observation which have lots of advantages for large objects, but for small one, just like the model, the precision is not enough.
In this paper, a system composed of photographic surveying of industry and structure lighting scanning devices, which is used to monitor the deformation. Photogrammetry is based on the theory of geometric perspective. By using the images, the 3D coordinates can be calculated out with the method of intersection, the details are showed in Fig.3.
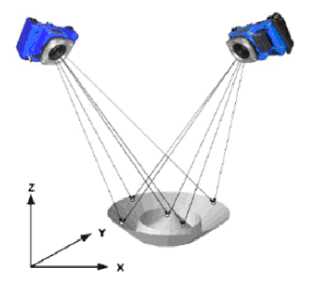
Figure 3. Principle of close-range photogrammetry
This paper chooses XJTUDP photographic surveying devices to accomplish the observation task. XJTUDP system measurement principle is to shot the objects from different perspectives with a camera, and use the images to calculate the coordinates of the target points; the schematic diagram is showed in Fig.4.
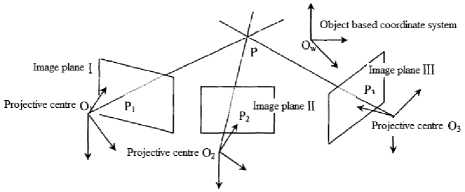
Figure 4. Forward intersection schematic diagram of multiple images
The photographic surveying of industry system includes a digital single lens reflex camera, ruler, code points and non-code points. The details are showed in Fig.5.
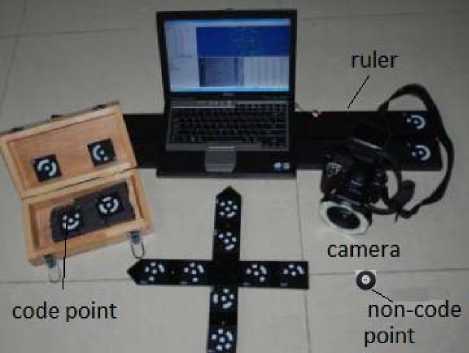
Figure 5. Photographic surveying of industry devices
Camera: the camera and lens must be regulated; when it’s used to take pictures of the targets, the photoflash must be on.
Code point: the code points are a set of white prints with black background, there is a white dot at the center, and loop type code around the dot. Each code point has its own serial number.
Non-code point: A single white dot with black background, it is used to be pasted up on the surface of target. Its coordinates were calculated out by analyzing the neighbor code points, the series of non-code point is random, and the numbers are changing by each observation.
Ruler: The rulers have standard length with high accuracy; there are two code points at each end of the ruler, the ruler is scale of the coordinates.
Computer: The coordinate’s calculation system is installed on the computer.
The code points and non-code points should be set on the model surface, and the results are in Fig.6.
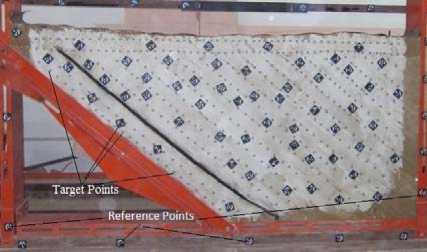
Figure 6. Arrangement of target points on model surface
The structure lighting scanning devices XJTUOM is used to scan the model surface, aiming at get the changing process of the model surface when the simulated mining is carried out. At each scanning the optical grating sender sends sets of grating to the target surface, and two CCD cameras which have an angle between them, get the image of grating at the same time. Computer decodes the images, and gets the phase position. At last, the 3D coordinates of the points on the image are worked out which based on triangulation principle and stereo matching theory. Schematic diagram of grating sending is showed in Fig.7.
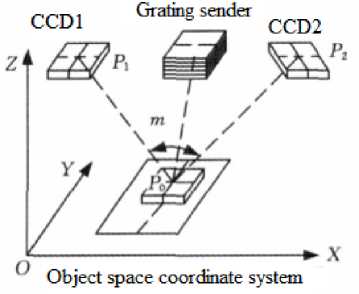
Figure 7. Schematic diagram of grating sending
The structure lighting scanning devices are showed in Fig.8.
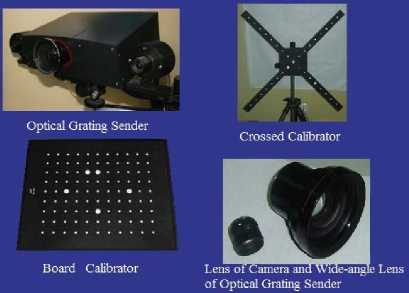
Figure 8. Structure lighting scanning devices
Optical grating sender: It is composed by light source, two CCDs, grating equipment and lens. Its main function is sending grating, picking up grating image and sending the signal to computer.
Crossed calibrator and board calibrator are standardized, which are used to calculate the angle between the two CCD cameras.
The photographic surveying of industry devices (XJTUDP) are used to acquire the coordinates of the target points. The precision of the method is about 1/70000 to 1/150000, in another word when you survey an object in length of 1m, and the error would be less than 0.01mm.
Structure lighting scanning devices (XJTUOM) are used to acquire the point cloud of the model surface. Each scanning, it can cover the range of 128mm by 96mm to 2200mm by 2000mm, and creates 1 million to 6 million points with 3D coordinates in 5 seconds. In points cloud, the distance between two neighbor points is about 0.08 to 1 mm. The position accuracy of each point is about 0.05mm; it is enough for catching the slight deformation on the model.
-
IV. Data processing
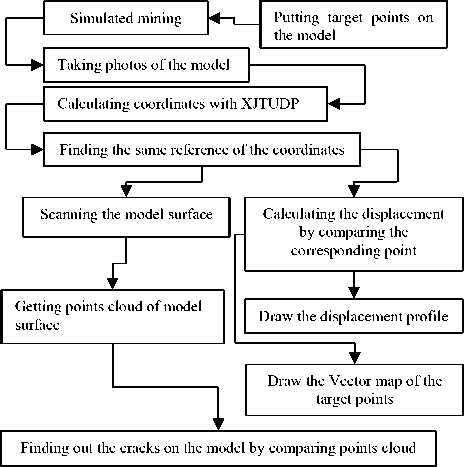
Figure 9. Data flow chart
The observation system is introduced from Xi’an Jiao tong University, there are some software tools to calculate the coordinates of target points, but for analyzing the mining subsidence factors, the programs should be improved. The data processing flow is showed in Fig.9.
Figure9 illustrates the steps of data processing, and there are two branches in it. On one hand the displacement profile and vector map of the points can be worked out, on the other hand also the cracks on the model surface are found.
-
A. Displacement profile
Displacement profile is the basic format of ground movement, and it is the foundation of mining subsidence research. After the target points are set on the model, the simulated mining is carried out. Each observation, a series of photos are taken, and the coordinates of target points can be calculated out with the photos by using of XJTUDP program (Fig.10).
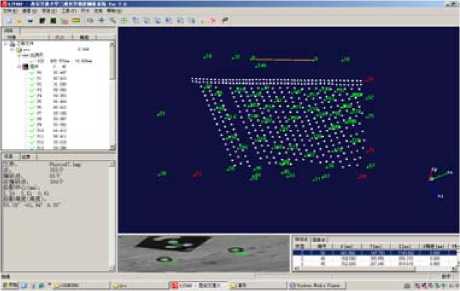
Figure 10. XJTUDP Photogrammetric three-dimensional optics measuring system
The coordinate system of each observation is random. Some code points are arranged on the iron frame as the reference points of every observation (Fig.11).
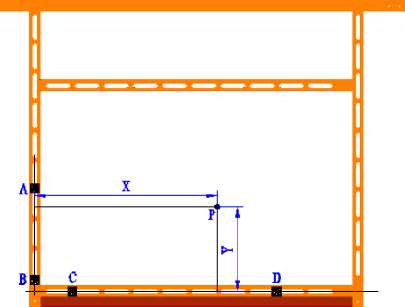
Figure 11. Reference points
A (A x ,A y ,A z ) , B (B x ,B y ,B z ), C (C x ,C y ,C z ), D (D x ,D y ,D z ), P (P x ,P y ,P z ) The coordinates of ABCDP are 3D coordinates calculated by XJTUDP system.
By using of P(X, Y), the vertical displacement (W) and horizontal (U) displacement can be worked out as follows:
W = Y n -Y 0
U= X n -X 0
(X0, Y0) is coordinates of the first observation, (Xn, Yn) is coordinates of the nth observation.
After comparing the coordinates of two different observations, according to the unified coordinate system, the profile of ground movement can be worked out. An example of displacement profile is showed in Fig.12.
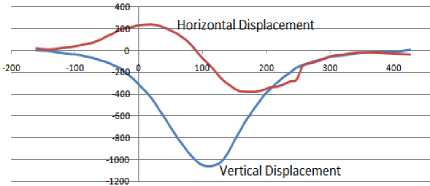
Figure 12. Ground movement profile of equivalent material simulation
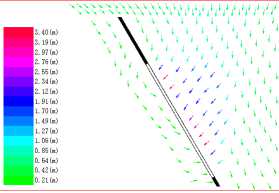
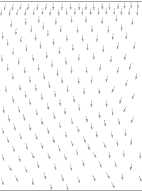
The ground surface movement profile can be very useful for analyzing the shape of ground trough made by mining, but it’s not enough to discover laws of rock mass movement. Thank to the photographic surveying of industry system, it can get all the targets points’ displacement information immediately. After calculating out all the movement direction and distance of each point, the vector map of the target points on the model can be illustrated. The vector map can be used to analyze how the rock layers move when the mining happens underground. The analysis can help people to explain the internal cause of surface movement. An example of vector map is showed in Fig.13.
The points on iron frame are not influenced by mining, they are stationary. Thanks to the reference points, the different coordinate system of each observation can be transformed to a unity. Due to the model in this paper is 2D model, so the 2D coordinate (X, Y) is enough for the research. Reference to the ABCD coordinate system, the method of calculating coordinates of P(X, Y) is as follows:
set :
( . = B x - A .
P = Ву- Ау ■ , c = B z - A z
a ( P . - A . ) + b ( P y - A , ) + c ( Pz - Аг ) a 2 + b 2 + c c
Figure 13. Vector map of equivalent material model
X = >x - ( a t + A . )) 2 + (P y - ( b t + A y ))2 + (P z - ( c t + A z ))2
set :
J d = D . - C . ■ e = D , - C y
g =
d ( P . - C . ) + e ( P y - С , ) + f ( P z - C z )
f = D - C zz
d 2 + e 2 + f 2
Y = 7(PX - ( d g + C . ))2 + (P y - ( e g + C y ))2 + (P z -( f g + C z ))2
B. Analysis of Crack Developing
Mining underground makes cracks in the rocks, and the equivalent material model can imitate it, but the traditional monitoring ways cannot catch the cracks on the model surface. This paper uses XJTUOM-II Structure lighting scanning devices to scan the model surface more than twice, one scanning is before mining, and another is after mining. The software of XJTUOM-II is showed in Fig.14. The comparison of the two scanning results is showed in Fig.15.
Belote Mining After Mining
Figure 15. Part of the Points Cloud of Model surface at two different time
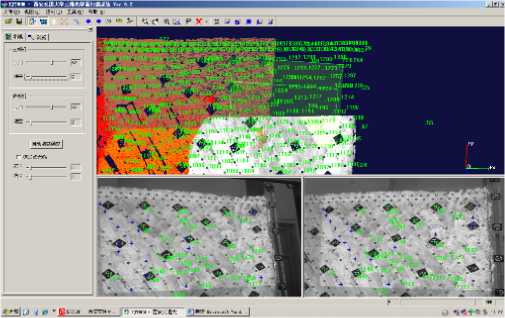
Figure 14. User interface of XJTUOM-II System
^
mm m m a2 xi2 + b2 xiyi + c2 zixi = -2 xi i=1 i=0 i =1 i=1
m mm m a2 xiyi + b2 yi2 + c2 ziyi = —2 yi i=1 i=0 i=1 i=1
a m xzi + b ^m^ yizi + c m zi 2 = - £ zi i = 1 i = 0 i = 1 i = 1
Supposing:
Q =
m
2 xi 2
i = 1
m
2 xiyi i=1
m
2 xizi
_ i = 1
^ Q [ a b
m
2 xiyi i=1
m
2 у- 2
i = 1
m
2 yizi i=1
c ] T = K
m
2 zixi i=1
m
2 ziyi i=1
m
2 zi 2
i = 1
The points and the data are too large to be managed, but it’s much easier to show the cracks by extracting the information out of the points. Due to the model surface is flat, an extracting method which based on plane is given out in this paper. The steps of extracting crack information are as follows:
-
• Preparing two sets of points cloud, one is scanned
before mining, another is scanned after mining.
-
• Finding out two reference planes of the two set of points. Projecting the points on the corresponding plane. This paper uses the least square plane fitting method to calculate the reference plan. The following are details.
Supposing there is a plane equation:
p ( x , y , z ) = ax + by + cz + 1 = 0
And Points cloud(xi,yi,zi)(i=0,1,…,m), fitting the plane and using the points by the least square method:
Parameters of the plane equation is : [ a b c f = Q - K
-
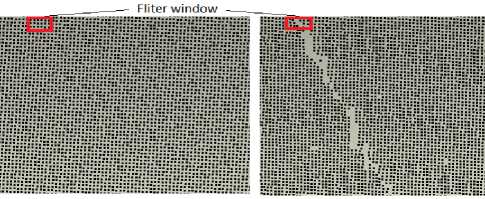
• Using two same filter windows to filter the points on the projection plane. The differences between the two windows can be found, and the crack information is extracted out. The details are showed in Fig.15.
The result of crack extraction in Fig.15 is showed in Fig.16:
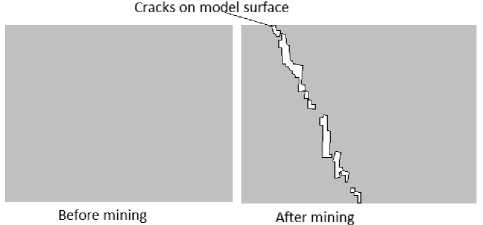
Figure 16. Example of cracks extraction
C. Data management program for equivalent material model experiment system
In order to manage the experiment data well, and calculate the deformations of the model, the author develop a software system to couple with the observation system. The system is implemented in C# computer language, and the data visualization part is based on Microsoft Direct 3D SDK. AutoCAD VBA is also used to draw the profiles and maps. The data management system not only accelerates the speed of data processing, but also expands the usage of XJTUDP and XJTUOM system. The user interface of the program is illustrated in Fig.17.
In the condition of:
d F = 0
5 a
d F = 0 d F = 0
5 b
d c
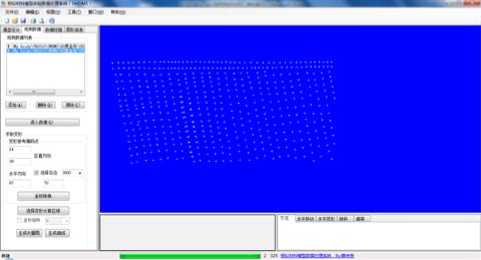
Figure 17. The user interface of data management system
-
V. conclusion
This paper systematically introduces the equivalent material model experiment which is used to imitate mining subsidence. The shortcomings of the traditional methods which are used to monitor the deformation of equivalent material model, is analyzed. A new method which includes the photographic surveying of industry and structure lighting scanning technology, is given out. The author analyzes the strong points of the observation system and points out the key points of using the system to monitor the equivalent material model. For research the characteristics of mining subsidence, this paper discusses the ways to make the data suit for the research. By the mean time, the author implements a software system to couple with the hardware system for dealing with the data. Results show that the method in this paper is more efficient, comprehensive and precise than before.
photogrammetry ,” Journal of China Coal Society , vol.31, NO.3, pp.292-295(in Chinese)
-
[6] YANG Huachao, YU Ruipeng, LIU Chao, etc, “Deformation measurenent of simulated material model based on image sequence,” Journal of Liaoning Technical University , Vol.25 Supp1, pp.40-42(in Chinese)
Lailiang CAI was born in YingShan, SiChuan province, China, on 10/12/1983. Ph.D candidate of School of Environmental Science and Spatial Informatics, China University of Mining and Technology, Xuzhou, Jiangsu, China. He mainly researches surveying and mapping, mining subsidence engineering and
computer software system implementation.
Mr. CAI is member of China Computer Federation (CCF).
Kan WU was born in Dongyang, Zhejiang province, China, on 1/11/1963. Professor in School of Environmental Science and Spatial Informatics, China University of Mining and Technology, Xuzhou, Jiangsu, China. He mainly researches surveying and mapping, and mining subsidence engineering.
Mr. WU is member of China Association of Engineering Surveying Officers
Acknowledgment
This research could not be finished without the help of my Ph.D. supervisor professor Wu Kan, and I want to express my greatest honor to him. Also I want to thank all my friends, who give lots of help during the experiments. At last, thanks to Mo Xiaohua for helping me with the manuscript.
References A New Method of Equivalent Material Model Deformation Observation
- Helnut Kratzsch. “Mining Subsidence Engineering”.Springer-Verlag Berlin Heidelberg New York. 1983.
- HE Guoqin, YANG Lu, “Mining Subsidence Study,” Xuzhou: Publisher of China University of Mining&Technology, pp. 224-240, 1991. (in Chinses)
- LIU Jibo, DAI Huayang, YAN Yueguan, etc, “The precision analysis of equivalent material model deformation monitoring using theodolite,” Mine Surveying, pp.77-79, Mar 2008. (in Chinses)
- CAI Limei, LI Shao-hui, “Improving the automated grid methods to measure the deformation of the similar material model,” China Measurement Technology, vol.31 NO.1, pp.72-74(in Chinese)
- YANG Hua-chao, DENG Ka-zhong, GUO Guang-li, “Monitoring technique for deformation measurement of similar material model with digital close-range photogrammetry ,” Journal of China Coal Society, vol.31, NO.3, pp.292-295(in Chinese)
- YANG Huachao, YU Ruipeng, LIU Chao, etc, “Deformation measurenent of simulated material model based on image sequence,” Journal of Liaoning Technical University, Vol.25 Supp1, pp.40-42(in Chinese)
