A New Parameter Estimation Algorithm for Actual COSPAS-SARSAT Beacons
Author: Kun Wang, Jing Tian, Siliang Wu
Journal: International Journal of Information Engineering and Electronic Business(IJIEEB) @ijieeb
Article in issue: 2 vol.2, 2010.
Free access
According to the high precision demand of estimating frequency of arrival (FOA) and time of arrival (TOA) in Galileo search and rescue (SAR) system, and considering the uncertainty of message bit width in actual received COSPAS-SARSAT beacons, a new FOA and TOA estimation algorithm which combines the Multiple Dimensions Joint Maximum Likelihood Estimation (MJMLE) algorithm and Barycenter calculation algorithm is proposed. The principle of the algorithm is derived and the concrete realization of the algorithm is given. Both Monte Carlo simulation and experimental results show that when CNR equals to the threshold of 34.8dBHz, root-mean-square errors (rmse) of FOA and TOA estimation in this algorithm are respectively within 0.03Hz and 9.5us, which are less than the system requirements of 0.05Hz and 11us. This algorithm has been applied to the Galileo Medium-altitude Earth Orbit Local User Terminal (MEOLUT station).
FOA and TOA, message bit width, Multiple Dimensions Joint Maximum Likelihood Estimation, Barycenter calculation algorithm
Short address: https://sciup.org/15013050
IDR: 15013050
Text of the scientific article A New Parameter Estimation Algorithm for Actual COSPAS-SARSAT Beacons
Published Online December 2010 in MECS
Galileo SAR system mainly includes five parts: Beacon equipments of users, Satellite system, MEOLUT station, Mission Control Centre (MCC) and SAR team [1]. Beacon equipments emit beacon signals when users are in distress. Satellite system receives and transmits beacon signals to MEOLUT station. In MEOLUT station, the functions of beacon signal detection, beacon message extraction, estimation of key parameters and positioning of Beacon equipments are completed. After that, the results are sent to MCC and SAR team [2,3]. The positioning of Beacon equipments mainly relies on the estimation of FOA and TOA. Therefore, how to estimate FOA and TOA accurately is the key to the precisely positioning.
The literature on FOA and TOA estimation of COSPAS-SARSAT Beacons is few. For FOA estimation, performance comparison of several frequency estimation methods such as FFT method, Burg method and MUSIC method is carried out in [4], and the conclusion that the precision is about 1Hz when CNR equals to 34.8dBHz is obtained. Frequency estimation algorithm based on Kay method is discussed in [5]. An integrated frequency estimation algorithm which combines Rife algorithm and Phase difference correction algorithm is proposed in [6].
The precision of both two algorithms above is about 0.1Hz when CNR is 34.8dBHz. For TOA estimation, Reference [7] points out that we can get accurate estimation by using the time-delay correlation algorithm based on Maximum Likelihood criterion. TP (Tone and Preamble) based algorithm and TPD (Tone, Preamble and Data) based algorithms are researched respectively in [8] and [9], and the conclusion is that the performance of TPD based algorithm is better. By assuming the frequency error is 0.1Hz under the condition that the sample rate is 1MHz and CNR is 34.8dBHz, the accuracy of TPD based algorithm is 7us, which is shown in [10]. However, none of the algorithms consider the uncertainty of message bit width. According to the beacon specification, the message bit width in actual COSPAS-SARSAT beacons is 2.5ms±1% [11] and the definition of TOA and FOA are the time at the end of the 24 th message bit and its frequency respectively. If we use the algorithms above to estimate FOA and TOA without considering the uncertainty of message bit width, the precision of the estimation results will decline sharply. As a result, we must estimate the message bit width so as to get the accurate estimations of FOA and TOA.
Considering the uncertainty of message bit width, a new FOA and TOA estimation algorithm is proposed. First, COSPAS-SARSAT beacon structure and model is introduced. Secondly, we propose a new FOA and TOA estimation algorithm which combines the algorithm based on MJMLE criterion and Barycenter calculation algorithm. Then, the principle of the algorithm is derived and the concrete realization of the algorithm is given. Finally, we demonstrate the estimation performance of the algorithm with simulation and experimental results, and conclude this paper.
-
II. B EACON S TRUCTURE AND M ATHEMATICAL
The COSPAS-SARSAT beacon signals emitted by the Beacon equipments are composed of pure carrier (corresponding to 64-bit beacon message) and modulated signals (the length of short message is 280ms±1% corresponding to 112-bit beacon message and the length of long message is 360ms±1% corresponding to 144-bit beacon message). Note that the beacon message is composed of bit synchronization, frame synchronization, the symbol of short/long message and users’ message with message bit width of 2.5ms±1%. The structure of the beacon signals is shown in Tab.I.
where N 0 =
TABLE I. structure of the COSPAS-SARSAT beacon SIGNALS
|
64bit |
15bit |
9bit |
1bit |
87/ 119bit |
|
pure carrier |
bit synchroni zation |
frame synchroni zation |
short/ long message symbol |
users’ message |
т 0 - 88 T b T s
t 0
T s
is the sampling value at
the beginning of the beacon signal, t 0 is the length of the
noise before the beacon signal, M =
(88 + L ) T b T s
is the
For the rate of carrier frequency is quite small (less than 0.7Hz/s) [11], the change of the carrier frequency can be neglected. By using the average carrier frequency in the duration of beacon signals to denote the received signal, we can express the digital baseband beacon signal as
sampling number of the beacon signal which satisfies M ? N 0 and N is the length of the received signal sequence.
III. F OA AND T OA E STIMATION A LGORITHM
r(n) = s ( n ) + wn)
= A exp ^ jWT + ф T b , r 0) + ф н
( т L - 88т )
nT , T b - т 0
I————
( L + 88 ) Tb
+ wn)
where, s ( n ) is beacon signal, w ( n ) is complex white
Gaussian noise with zero mean and variance of 2 c 2, A
is the amplitude of signal,

TT
- 2 ~ t < 2 is the else
rectangular function, fd is the average Doppler frequency, Tb is the message bit width, т 0 is the time when the 24 th message bit ends, i.e. TOA, ф 0 is the initial phase (any value selected), L is the length of the users’ message sequence except bit-frame synchronization message ( L = 88 in short message beacon and L = 120 in long message beacon), Ts is the sampling interval, ф ( n , Tb, т 0) is the sequence of modulated carrier phase, which can be written as
A. FOA and TOA Estimation Algorithm Based on MJMLE
There are several unknown parameters in a received signal. If we get the estimation of FOA and TOA through estimating these parameters one by one, the estimation process will be very complex and the estimation precision will not be guaranteed. As a result, the unknown parameters should be estimated simultaneously, in other words, we should take multiple dimensions joint estimation.
Assume 6 = [ A , f, , T. ,т , Фп ] is the vector of the db 00
unknown parameters of the COSPAS-SARSAT beacon signal. According to (3), the unknown parameters’ joint probability density function (PDF) can be expressed as
'L + 24
^n,T b , T 0 ) =
W ( nT + (25 - Ж -T 0 ) k = 1
- 24 T < nT-т < LT b s 0 b (2)
else
N0-1
p(r;6) П—exp " n=0 2n^_
N0 + M-1
g П —exp n = N 0 2n?J
N-1
g П —exp n = N 0 + M 2 n^
N-1
П.?
N0 +M-1
g П —exp n = N 0 2 пУ
- 2 ^ 7 l r ( n )2
- 2 ^ 2 l r ( n )- s ( n ) 2
1 - 2^ I r ( n )|2
- t2; I r ( n )|
{ --— _ - r ( n ) s * ( n ) - r * ( n ) s ( n ) +1 s ( n )|2 j }
where bk = ± 1 is the k th message and
P™ (t ) = П
( u)
^T
T
V 2 у
П
( t - 3 T
T
V 2 у
is the Manchester pulse.
Parameters need to estimate in (1) are the average
Doppler frequency ( fd ), the message bit width ( Tb ), TOA ( т 0 ), the initial phase ( ф 0 ) and the frequency when the 24 th message bit ends, i.e. FOA.
Suppose the received signal before and after the beacon signals are both noise, (1) can be expressed as
I w ( n ) r ( n ) = < s ( n ) + w ( n )
[ w ( n )
n = 0,1,L, N 0 - 1
n = N 0 , N 0 + 1,L, N 0 + M - 1 (3)
n = N 0 + M , N 0 + M + 1,L , N - 1
where, r is the received signal sequence.
For the received signal r(n) is known, the process of the Maximum Likelihood Estimation for the unknown ± parameters is to seek 6 = [A,fd,Tb,т0,ф0] to make p(r;6) be maximum. Scilicet, it is the process to solve the following nonlinear optimization problem.
о ± о о о . N >+ M -1Г . |2-|
A,L , ть П 00 ф 5 0 = argmin L _ r ( n ) s ,( n )- r ,( n ) s ( n )+| s ( n ) J
A , ffd , Tb ,т„ф, n = N )
Considering the function П( д ) is used to define the range of beacon signal, and the following analysis employs only the beacon signal, we drop the function П( д ) and construct sTPD ( n ) as
sTPD ( n ) = exp ( 1 2n fdnTs + 1 1( n , T b ,т 0 ) ) for convenient derivation. Thus s ( n ) in (1) can be expressed as
Submitting (12) into (11) and simplifying it, we will have
s ( n ) = Ae1 1 sTPD ( n ) (6)
N 0 + M - 1
J (9) = Z n=N0
Z 1 N 0 + M - 1 А
- r ( n ) 77" Z r ( n ) sTpd ( n ) sTpd ( n )
I M n ~ N 0, J
Simultaneously marking
N 0 + M - 1|-
J ( 9 ) = Z [- r ( n ) s * ( n )- r * ( n ) s ( n )+ I s ( n ) J (7) n = N 0
taking (6) to (7), we can get
J( 9 ) = Z [- r ( n ) Ae — M s ™ ( n ) — r *( n ) Ae 1 s TPD ( n ) + A 2 ] (8) n = N J
Seeking partial derivatives for A and ф 0, and letting them equal to 0, then we can get
Z 1 N 0 + M - 1 А
- r *( n ) 77 Z r ( n ) s TpD ( n ) s TPD ( n )
( M n 0 J
1 N 0 + M - 1
+ M Z r ( n ) s TPD ( n )
n = N 0
N 0 + M - 1
= - -M Z r ( n ) sTpd ( n )
n = N 0
' N 0 + M - 1
Z [ - r ( n ) e1 s TPD ( n ) - r * ( n ) e 1 s TPD ( n ) + 2 A ] = 0
n = N 0
N 0 + M - 1
Z [ - r ( n ) A ( j)e 0 s TPD ( n ) - r * ( n ) Ale 1 s TPD ( n ) ] = 0
n = N 0
According to the derivation above, the Maximum
Likelihood Estimation of fd , T b , t 0 is given by
<
f , Д , T 0 = arg min f d , T b > r 0
M
N 0 + M - 1
Z r ( n ) s TPD ( n )
n = N 0
According to (9), we can obtain
= arg max—
M fd , Tb ,T 0
N 0 + M - 1
Z n = N0
r ( n ) sT * PD ( n )
1 N 0 + M -*
A = 777 Z [ r ( n ) e~ 1 1 s TPD ( n )+ r *( n ) e 1 s TPD ( n ) ]
2 M n = N 0 L J
From (14), we can get that the MJMLE of fd , Tb , т 0 is
the process of seeking different fd , Tb , т 0 to make
e * =
N 0 + M - 1
Z r ( n ) s TPD ( n )
n = N 0
M
N 0 + M - 1
Z n=N0
r ( n ) sT * PD ( n )
be maximum. For M is a fixed
N 0 + M - 1
0 1
1 Z r *( n ) s TPD ( n )
| n = N 0
The submit
computational burden will be very large if we (10) to (8) and simplify it directly. So letting
A = Ae 1 and submitting (6) to (7), and we will get
N 0 + M - ip- * * * 2-i
J ( 9 ) = Z [- r ( n ) A STPD ( n ) - r *( n ) A 0 s TPD ( n ) +| 4 )| ] (11) n = N 0
According to (10), we can obtain
A = Ae1 *
= 717 N 0 +M 1 [ r ( n ) e" 1 1 0 s TPD ( n ) + r *( n ) e 1 s TPD ( n )> *
2 M n = N 0
= 777 N Z ' [ r ( n ) s TPD ( n ) + r •( n ) e 2 , ф 0 s TPD ( n ) ]
2 M n = N 0
N 0 + M - 1 ]
Z r ( n ) s TPD ( n )
r ( n ) s TPD ( n ) + r * ( n ) N 0 nM -------------- s TPD ( n )
Z r * ( n ) s TPD ( n )
n = N 0 _
value in (14), the processing above can be implemented by taking three dimensions grid search of frequency, message bit width and time delay. Concretely, it is to generate a local signal with a different frequency, message bit width and time delay, take correlation calculation between the received signal and the local signal, and make modular square of the correlation calculation results. As a result, the frequency, message bit width and time delay value corresponding to the maximum of the modular square results is the Maximum
2 M
N 0 + M - 1
Z n=N1
1 N 0 + M - 1
=77 Z r ( n ) stpd ( n )
M n T N 0
Likelihood Estimation of f. , T ,т ■ db 0
In order to verify the correctness of the algorithm above, we took simulations with the conditions as follows. The baseband signal is long message beacon signal without noise. The sample rate is 200 kHz, the Doppler frequency is 0Hz and the Doppler rate is 0Hz/s. The message bit width is 2.5ms in both received signal and generated local signal. TOA which is relative to the beginning of beacon signal is 220ms and the users’ messages are known. When taking three dimensions grid search, the frequency search interval is 0.02Hz, the message bit search interval is 0.5us and the time delay search interval is 5us. Modular square operation is applied to the correlation results and the maximum of the modular squared results is obtained. Then frequency, message bit width and time delay corresponding to the maximum value above are the parameters estimation we
needed. Projections of the normalized modular squared
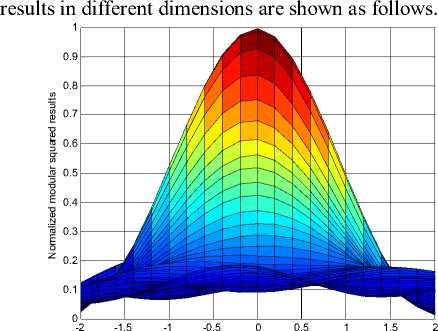
Frequency dimension(Hz)
Figure 1. Projection of the normalized modular squared results in frequency dimension.
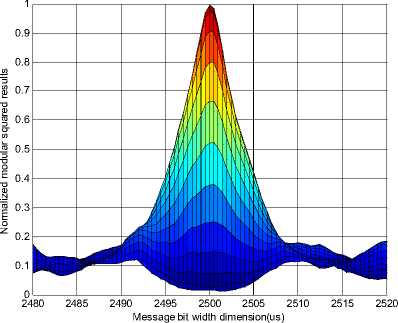
Figure 2. Projection of the normalized modular squared results in message bit width dimension.
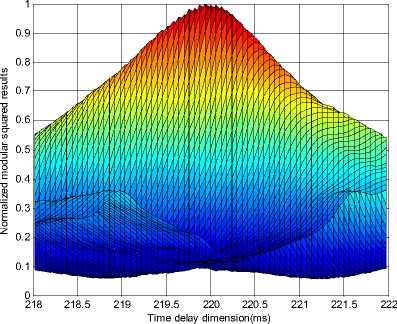
Figure 3. Projection of the normalized modular squared results in time delay dimension.
From Fig.1~3 we can see that the maximum of the modular squared results corresponds to the true value of FOA, message bit width and TOA, which illustrates the correctness of the proposed algorithm.
According to the simulation results above, the beacon message is known to generate complete local signal, then we can take correlation calculation with the received signal when taking MJMLE. While we know only the bitframe synchronization in the beacon signal, so we should extract the users’ message. For the fact that the extraction of users’ message is the demodulation and decoding based on PLL and bit synchronization loop [12], we should get the estimation of fd , message bit width and TOA first. Since the pre-estimation of fd (marked as ±fd 0 ) is obtained in signal detection [13], and the baseband received signal with residual frequency of fd 1 can be obtained by down conversion and low-pass filtering with ±fd 0 , the estimation of fd can be converted into estimating fd 1 . According to the analyzing result above, the process of parameters estimation can be divided to rough estimation process and accurate estimation process, the concrete processes are given as follows.
1 The rough estimation process of fd 1 , message bit width and TOA. Fully utilize the known information of pure carrier and the bit-frame synchronization, take three dimensions search of frequency, message bit width and time delay according to the error range of ±fd 0 , the range of message bit width and the definition of TOA, and we can get the rough estimation of fd 1 , message bit ± width and TOA, i.e. fd1,T∞b1,τ∞01 . Since frequency is independent of message bit width and time delay, the process can be divided to two steps.
-
(1) . Frequency estimation is only taken in the first step. Making full use of the pure carrier, FFT operation is employed to realize the frequency search in the received signal, and the estimation of residual frequency ( fd 1 ) will be obtained(marked as ± fd 1 ).
-
(2) . In the second step, frequency search will not be taken. Instead, two dimensions search of message bit width and time delay is taken by using ± fd 1 obtained in the first step and the bit-frame synchronization. Then, we will get the rough estimation of message bit width and TOA (marked as T ∞ b 1, τ ∞01 ). In this step, the generated local signal contains only bit-frame synchronization.
-
2 The accurate estimation process of fd 1 , message bit width and TOA. After extracting users’ message by ±
using fd1,T∞b1,τ∞01 obtained in the rough estimation process, generate local signal with users’ message, take three dimensions search of frequency, message bit width and time delay according to the error range of ± fd1,T∞b1,τ∞01 , and we will get the accurate estimation of fd 1 , message bit width and time delay(marked as ± fd 2 ,T∞b ,τ∞0 ). Compared with the rough estimation process, the search interval is less. No matter the received signal is long message beacon or short message beacon, we use only the first 88 users’ messages to generate local signal and take correlation calculation in order to make sure the end of the 24th beacon message is the midpoint of the received signal, which will make ±fd 2 to be the estimation of the frequency difference between FOA and ±f , and then, the sum of ±f and ±f is just the FOA d0, , d0 d2
we needed. This process can also be divided into two steps because frequency is independent of message bit width and time delay.
-
(1) . The local signal in the first step contains a pure carrier, the bit-frame synchronization and the first 88 users’ messages. Take three dimensions search of frequency, message bit width and time delay according to ±
the error range of Jd 1,Tb 1, T°1 , and we can get the estimation of residual frequency fd 1 (marked as ±fd 2 )which satisfies the precision requirement. Scilicet, we get the estimation of FOA. Meanwhile, the estimation of message bit width and time delay marking as Tb 2, °, 2 are obtained.
-
(2) . In the second step, no frequency search is carried out and the generated local signal contains only the bit-frame synchronization and the first 88 users’ messages. Take two dimensions search of message bit width and time delay according to the error range of ±
f2,Tb 2, ° 2 obtained in the first step, and we will get the accurate estimation of message bit width and TOA(marked as Tb , t 0 ) which are the final estimation.
B. Barycenter Calculation Algorithm
If we choose the parameters corresponding to the maximum of correlation results after modular squaring as the estimation results, the estimation error is determined by the searching interval. In order to break through the limitation of searching interval and reduce the estimation error, we apply Barycenter calculation algorithm to aid the previous three dimensions grid search.
Let the computational function be
J '( fd , T b , T o
N о + M - 1
) = S r ( n ) 5 TPD ( n ) n = N о
, the searching
positions in the three dimensional searching be { fa ( i ); i = 1,2, L , I } , { T b ( p ); p = 1,2,L, P } and
{ t 0( q ); q = 1,2,L , Q } , and the three dimensional parameters corresponding to the maximum J m ' ax of the searching results be [ fd ( I о ), T b ( P , ), t , ( Q , ) ] , then we can get the parameters estimation by Barycenter calculation algorithm as follows.
1 0 +A I P 0 +A P Q 0 +A Q ___ ___
S S S G { 4 fd ( i ), T b ( p ), T o ( q ) ] } g f a ( i )
± _ i = I о -A I p = P o -A Pq = Q 0 -A Q ____________________________________ fd 1 о +AI P 0 +A P Q о +A Q , ,
S S S G { 47( ( i ), T b ( p ), T o ( q ) ] } i = I о -A I p = P o -A Pq = Q о -A Q
-
1 , +A I P 0 +A P Q +AQ __
S S S G { J '[ fd ( i\ T b ( p\ T , ( q ) ] } g T b ( p )
° _ i = I о -A I p = P o -A P q = Q -A Q ____________________________________
T b = I , +A I P 0 +A P Q +A Q , x
S S S G{■' fd(i),Tb(p).T,(q)]} i=I,-AI p=P,-APq=Qb-AQ
1 0 + A I P 0 +AP Q 0 +A Q ___
S S S G { J '[ fd ( i ) Tb ( p ) t o( q ) ] | t o( q ) ° _ i = I о -A I p = P o -AP q = Q о -A Q __________________________________________
T 0 1 0 +A I P 0 +A P Q 0 +A Q , ,
S S S G{J■ [fd(i),T.(p),To(q)]} i = Iо-AI p=P,-AP q=Q,-AQ where
G { J '[ f d ( i ), Tb ( p \ t , ( q ) ] } =
/ J' [ T( ( i ), T b ( p ), t , ( q ) ] J ' [ T( ( i ), T b ( p ), t , ( q ) ] > n g J max
0 others
The unilateral search range of the parameters is { AI , A P , A Q } and the threshold coefficient is 0 < n - 1. All the above parameters affect the estimation performance of parameters deeply. If only one dimensional searching is carried out, the Barycenter calculation is simplified as the calculation of area centroid.
This new estimation algorithm which combines the multiple dimensions joint Maximum Likelihood Estimation algorithm and Barycenter calculation algorithm is suitable to one or more parameters estimation requirements. What we need to do is to determine search dimensions, adjust the search range, the search interval and the threshold coefficient according to the range of the parameters needed to estimate. Accordingly, this algorithm has generality and extensibility.
-
IV. S IMULATION AND E XPERIMENTAL R ESULTS
-
A. Monte Carlo Simulation
Simulation conditions are set as follows: the baseband signal is long message beacon signal with users’ message changing randomly, the sample rate is fs = 200 kHz, the Doppler frequency fd is changing within the range of -50kHz~50kHz randomly, the Doppler rate is fd = 0.7 Hz/s, the message bit width is changing from 2.5ms-1% to 2.5ms+1% randomly, the time of TOA relative to the beginning of beacon signal is TOA = 88Tb, the corresponding FOA is FOA = fd + fd88Tb . The complex white Gaussian noise is added to the complex baseband beacon signal according to CNR and we can get the received signal. The noise before the beacon signal is 20ms, that is t0 equals to 20ms in (2). The estimation of fd (marked as fd 0 ) obtained by detecting the received signal is used to pass through down conversion and low-pass filter. The pass band of the filter is 2.7 kHz, the stop band is 6 kHz, the pass band ripple is 1dB and the stop band rejection is 50dB.
In the first step of parameters rough estimation, the time of the pure carrier is 160ms approximately and the noise before the beacon signal changes within 100ms [13]. From the standpoint of ease of implementation using FFT, 65536 points FFT operation is carried out on the 65536 points (the corresponding time is about 320ms) starting with the first point after signal detection. Then modular squaring is applied to the FFT results and the rough estimation of residual frequency (marked as ± fd 1 ) can be obtained through Barycenter calculation algorithm. It is noted that 5 points of which 2 points each around the peak are selected for calculation. Taking 104 Monte Carlo simulations with different CNR, we can get the statistical
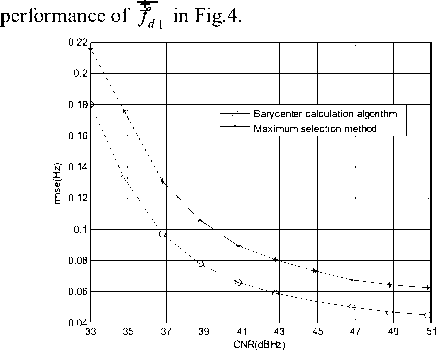
Figure 4. rmse of the rough estimation of residual frequency
Two dimensions search of message bit width and time delay is taken in the second step of parameters rough estimation. The searching range of message bit width is not less than 2.5ms-1%~2.5ms+1% because of the range of beacon signal message bit width is 2.5ms±1%. For the time of bit-frame synchronization is about 60ms and the pure carrier is 160ms approximately, the searching range of time delay is at least 320ms considering the time of the noise before the beacon signal changes within 100ms.
In order to diminish the computational burden, 8 times down sampling is used to the received signal and local signal. And then, FFT operation is employed to realize 8192 points correlation calculation. After modular square applying to the FFT results, the estimation of message bit width and TOA are obtained through Barycenter calculation algorithm. The unilateral search range KL of message bit width is 25us with step of 4us, the unilateral search range KK of time delay is 160ms with step of 40us and the threshold coefficient n is 0.9. Taking 104
Monte Carlo simulations with different CNR, we can get the statistical performance of rough estimation of message bit width (marked as T ∞ b 1 )in Fig.5. Fig.6 shows the statistical performance comparison of rough estimation of TOA (marked as r 01) and TOA estimation result using TP method in [8] under the same condition. Note that when using the method in [8], the frequency difference between the local signal and the received signal is 0, and the estimation of TOA is obtained by
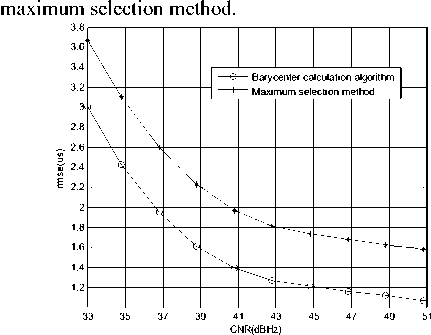
Figure 5. rmse of the rough estimation of message bit width
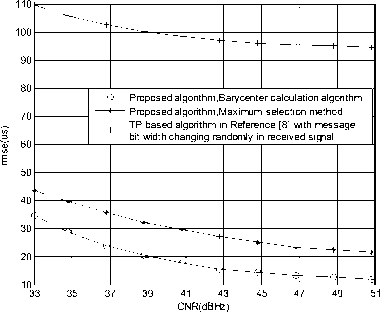
Figure 6. rmse of the rough estimation of TOA
From Fig.6 we can see that when the message bit width of the received signal changes randomly, the estimation error of TOA obtained by TP method is quite large if the message bit width in the generated local signal is the ideal value of 2.5ms. However the estimation error of TOA obtained by searching message bit width and time delay in the proposed algorithm is much smaller. We can get the conclusion that TP method should not be used in this situation and the estimation of message bit width must be taken.
During the first step of parameters accurate estimation, three dimensions search of frequency, message bit width and the time delay is taken after down sampling the received signal and the local signal with the sample rate of 12 which is used to diminish the computational burden. Note the number of the correlation calculation points is
7210. After modular square applying to the correlation results, the parameters needed are obtained through Barycenter calculation algorithm. The respective search range of three dimensions search should contain the error ± range of fd1,T∞b1,τ∞01 . According to Fig.4~6, the unilateral search range ∆I of frequency is 1.2Hz with step of 0.2Hz, the unilateral search range ∆L of message bit width is 14us with step of 0.5us, the unilateral search range ∆K of time delay is 2ms with step of 60us and the threshold coefficient η is 0.96. Taking 104 Monte Carlo simulations with different CNR, we can get the statistical performance of the estimation of message bit width and TOA in Fig.7 and Fig.8. The statistical performance comparison is carried out to evaluate FOA estimation result using the proposed algorithm versus using the method in [4] and [6] under the same condition. The
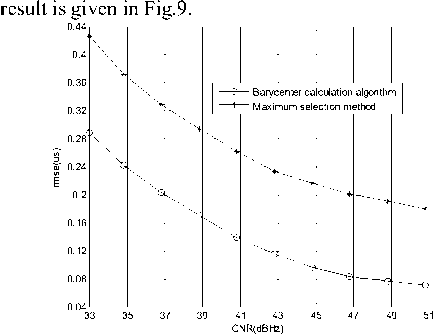
Figure 7. rmse of the accurate estimation of message bit width in the first step
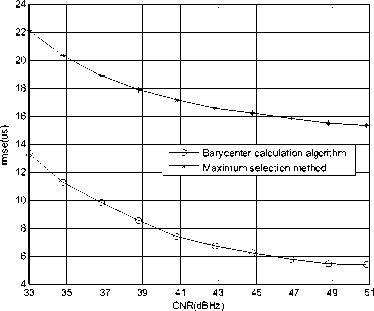
Figure 8. rmse of the accurate estimation of TOA in the first step
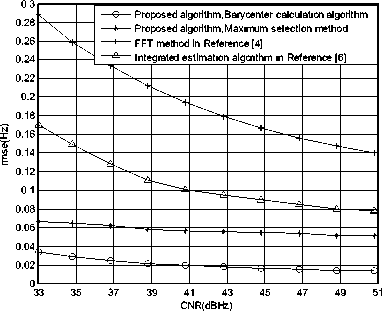
Figure 9. rmse of the estimation of FOA
In the second step, frequency search is not carried out and the generated local signal only contains bit-frame synchronization and the first 88 users’ messages. According to TOA estimation in the first step, the received signal is intercepted from the beginning of bitframe synchronization. And then, two dimensions search of message bit width and time delay is carried out, in which the number of correlation calculation points is 55418. The searching range of message bit width and time delay is determined by the estimation error in the first step. According to Fig.7 and Fig.8, the unilateral search range ∆ L of message bit width is 2us with step of 0.0625us, the unilateral search range ∆ K of time delay is 100us with step of 5us and the threshold coefficient η is 0.996. Taking 104 Monte Carlo simulations with different CNR, the statistical performance of the estimation of message bit width is shown in Fig.10. The statistical performance comparison of TOA estimation between the proposed algorithm and the method in [8] and [9] under the same condition is given in Fig.11. Note that when using the method in [8] and [9], the frequency difference between the local signal and the received signal is 0, the message bit width are both the ideal value of 2.5ms, and the estimation of TOA is obtained by maximum selection
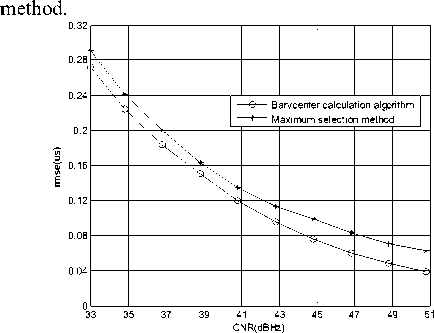
Figure 10. rmse of the accurate estimation of message bit width in the second step
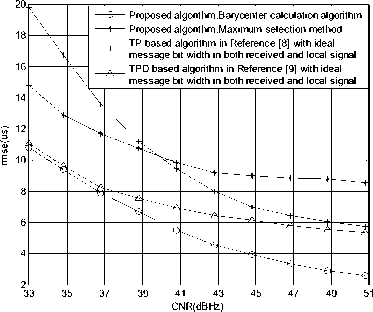
Figure 11. rmse of the final estimation ofTOA
When the message bit width of the received signal changes randomly, the estimation error of TOA obtained by TPD method is quite large and its value is 330us approximately(which is not shown in Fig.11) if the message bit width in the generated local signal is the ideal value of 2.5ms. We can conclude that TPD method can not be used in this situation and the estimation of message bit width is necessary.
We can see from Fig.9 that when considering the uncertainty of message bit width, the rmse of FOA estimation employing the methods in [4] and [6] are 0.258Hz and 0.149Hz respectively when CNR equals to 34.8dBHz, which is far beyond the system requirement of 0.05Hz. While the rmse of FOA estimation using the proposed method is 0.258Hz, which is less than the system requirement. In Fig.11, when considering the uncertainty of message bit width, the rmse of TOA estimation using the proposed method is 9.45us, which is less than the system requirement and much less the TOA estimation precision of TP and TPD algorithm under the condition that the message bit width are the ideal value in both received signal and generated local signal.
From Fig.4 to Fig.11, we can see that the parameter estimation precision of Barycenter calculation algorithm is 20%~30% better than that of the maximum selection method, which illustrates that the Barycenter calculation algorithm can effectively break through the limitation of searching interval and diminish the estimation error.
-
B. Experimental Results
The FOA and TOA estimation algorithm proposed in this paper is implemented in two FPGA of xc5vsx50t-2ff1136 and xc5vsx95t-2ff1136. The flow chart of implementation process is given in Fig.12 and the utilization of FPGA resources is shown in Tab II.
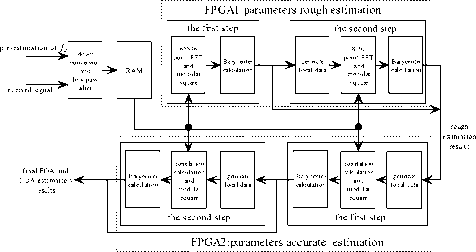
Figure 12. The flow chart of implementation process
TABLE II. U TILIZATION OF FPGA R ESOURCES
|
Name |
Use Number |
percent |
|
|
Slice |
17265 |
52% |
|
|
FPGA1: xc5vsx50t |
Block RAM |
71 |
53% |
|
DSP48Es |
65 |
22% |
|
|
Slice |
37094 |
63% |
|
|
FPGA2: xc5vsx95t |
Block RAM |
132 |
54% |
|
DSP48Es |
480 |
75% |
The algorithm has been applied to Galileo MEOLUT station. The number of the experiments is 5000 and the statistical performance of FOA and TOA estimation in the conditions of different CNR is shown in Tab III.
TABLE III. RMSE OF FOA AND TOA ESTIMATION OF
EXPERIMENTAL RESULTS
|
CNR(dBHz) |
FOA(Hz) |
TOA(us) |
|
33 |
0.0357 |
11.606 |
|
34.8 |
0.0290 |
9.460 |
|
36.8 |
0.0272 |
8.006 |
|
38.8 |
0.0235 |
6.752 |
|
40.8 |
0.0204 |
5.513 |
|
42.8 |
0.0186 |
4.536 |
|
44.8 |
0.0169 |
3.981 |
|
46.8 |
0.0155 |
3.371 |
|
48.8 |
0.0148 |
3.174 |
|
50.8 |
0.0143 |
2.978 |
By comparing Tab. III to Fig.9 and Fig.11, we can see that the experimental results are totally the same as the simulation results.
-
V. C ONCLUSIONS
Considering the uncertainty of message bit width in actual COSPAS-SARSAT beacon signals, a new FOA and TOA estimation algorithm which combines the Multiple Dimensions Joint Maximum Likelihood Estimation algorithm and Barycenter calculation algorithm is proposed. Both Monte Carlo simulation and experimental results show that when CNR equals to the threshold of 34.8dBHz, the rmse of FOA and TOA estimation in this algorithm are respectively within 0.03Hz and 9.5us, which are less than the system requirements of 0.05Hz and 11us. This algorithm has been applied to the MEOLUT station and the positioning precision of the experimental result is within 2km. Therefore, fast searching and rescuing the users in distress can be guaranteed.
References A New Parameter Estimation Algorithm for Actual COSPAS-SARSAT Beacons
- Mo Lin, Shaobo Liu, Lina Shang, Jilin Li. “Performance analysis of the Galileo system search and rescue service in China”, Journal of Telemetry, Tracking and Command, vol. 30, no. 3, pp.2-4, May. 2009.
- Maqsood A, “Satellite-Aided Search and Rescue (SAR) System”. IEEE Aerospace and Electronic Systems Magazine, vol. 22, no. 8, pp. 3-8, Aug. 2007.
- Lewandowski A, Niehoefer B, Wietfeld C, “Galileo SAR: Performance aspects and new service capabilities”, International Journal of Satellite Communications and Networking, vol. 28, no. 6, pp. 1-8, 2010.
- Gomez P C, Prades C F, Rubio J A F, “Design of Local User Terminals for Search and Rescue Systems with MEO Satellites”, The Proceedings of Navitec, ESA/ESTEC, Netherlands, Dec, 2004, pp. 1-10.
- G Liu, B He, J.L. Li, “A new FOA estimation method in for SAR/Galileo system”, The 2nd International Conference on Space Information Technology, Wuhan, Nov, 2007, pp. 1-6.
- Rui Li, Jilin Li, “A FOA Estimation Approach for GALILEO SAR Signal”, Radio Engineering, vol. 37, no. 10, pp. 33-41, 2007.
- Granados G S, Rubio J A F, Prades C F, “ML Estimator and Hybrid Beam former for Multipath and Interference Mitigation in GNSS Receivers”, IEEE Transactions On Signal Processing, vol. 53, no. 3, pp. 1194-1208, 2005.
- Prades C F, Closas P, Rubio J A F, “Advanced Signal Processing Techniques in Local User Terminals for Search & Rescue Systems Based on MEO Satellites”, ION GNSS 18th International Technical Meeting of Satellite Division, Long Beach, CA, Sep, 2005, pp. 1349-1360.
- Prades C F, Gomez P C, Rubio J A F, “Time-frequency estimation in the cospas-sarsat system using antenna arrays: variance bounds and algorithms”, The 13th European Signal Processing Conference, Antalya, Sep, 2005, pp. 1-4.
- G Liu, B He, H Feng, “A novel TOA estimation algorithm for SAR/Galileo system”, IEEE International Conference on Systems, Man and Cybernetics, Suntec, Oct, 2008, pp. 3554-3557.
- Cospas-Sarsat Council, Specification for Cospas-Sarsat 406MHz distress beacons. [EB/OL].2007. http://www. cospas-sarsat.org /Documents/tDocs.htm.
- Zhihong Dong, Na Yang, Wei Cui, Xin Sun, “Design of modulation-decoding algorithm in Galileo SAR system”, Chinese Journal of Science Instrument, vol. 31, no. 8, pp.357-361, Aug, 2010.
- Zhihong Dong, Jian Wang, Kun Wang, Xin Sun, “Design of Signal Detection Methods in Galileo SAR System”, Transaction of Beijing Institute of Technology, vol. 30, no. 8,pp. 969-973, Aug, 2010.
- MECS Journal
- Home Latest News & Events Aims and Scope Submit a Paper Author Guidelines Editorial Board Review Process E-Mail Alert Become a Member Indexing Service Publication Charge Recommend to Library Best Paper Awards Terms & Conditions Special Issues Publication Ethics and Malpractice Statement
