A Novel Algorithm for Color Similarity Measurement and the Application for Bleeding Detection in WCE

Author: Guobing PAN, Fang XU, Jiaoliao CHEN
Journal: International Journal of Image, Graphics and Signal Processing(IJIGSP) @ijigsp
Article in issue: 5 vol.3, 2011.
Free access
Wireless Capsule Endoscopy (WCE) generates a large number of images in one examination of a patient. It is very laborious and time-consuming to detect the WCE video, and so limits the wider application of WCE. Color similarity measurement is the key technique of color image segmentation and recognition, as well as the premise of bleeding detection in WCE images. This paper deduces two color vector similarity coefficients to measure the color similarity degree in RGB color space, and based on which, a novel method of intelligent bleeding detection in WCE image is implemented. The novel algorithm is implemented in RGB color space, and is featured with simple computation and practicability. The experiments showed that the bleeding regions in WCE images can be correctly extracted, and the sensitivity and specificity of this algorithm were 90% and 97% respectively.
Color similarity measurement, color vector, similarity coefficient, bleeding detection
Short address: https://sciup.org/15012170
IDR: 15012170
Text of the scientific article A Novel Algorithm for Color Similarity Measurement and the Application for Bleeding Detection in WCE
Published Online August 2011 in MECS
Bleeding in the digestive tract is not only a common gastrointestinal (GI) trace disease, but also a well-recognized complication, which is a symptom of a fatal disease. Most causes of bleeding are related to conditions that can be cured or controlled [1], yet to detect the bleeding is not easy. The best way to detect bleeding is directly imaging the GI tract, so the endoscopy is a direct and effective diagnostic technique comparing to indirect techniques such as barium angiography and computerized tomography [2]. However, limited by physical reasons, traditional invasive endoscopies such as esophago-duodenoscopy and colonoscopy cannot be pushed through the entire GI tract, leaving the small intestine as a dead zone in the endoscopic diagnosis. They are inconvenient and cause intense pain. Further, they can increase the risk of intestine perforation. Wireless Capsule Endoscope (WCE), as a relatively new technology, allows the physician to noninvasively examine the entire GI tract leaving no dead zone. The WCE system includes capsule endoscope (CE), receiving box, image working station and application software. The
Manuscript received March 29, 2011; accepted ****,2011.
CE is about 11 mm in diameter and 30 mm in length, which is small enough to be swallowed by patients easily. During it travelling through the GI tract with the nature peristalsis, the CE images the GI tract using a short focus lens. The images are transmitted wirelessly outside of patient’s body at the frame rate of 2 f/s (frames per second), and received by the receiving box which is tied to patient’s waist. The images are received by the receiving box outside and showed in PC workstation. The working cycle, which is shown in Figure 1, shows that the usage of WCE system is convenient, safe and the entire GI tract is examined without dead zones [3-6]. The WCE is applied more and more in clinical examinations based on these assets [1, 711].
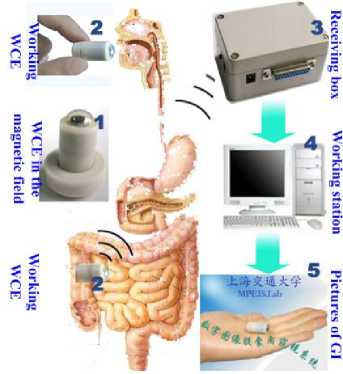
Figure 1. Working cycle of WCE.
During the 8-hour examination, the WCE generates at least 2×3600×8=57600 frames of images. It is very laborious and time-consuming to detect the bleeding regions or other related abnormal characters from the large amount of WCE images. It takes more than 3 hours to inspect these images even by a skilled expert, which is not only time-consuming but also leading false detection because of visual fatigue. With the development of WCE, much more frames of high definition images will be generated during one examination course of a patient. It will be even impossible for the physician to review the full length video footage. Therefore it is necessary and urgent to develop computer aided intelligent bleeding detection technique to process the WCE video automatically.
The Given Image Company provides a software tool to detect the bleeding called Suspected Blood Indicator (SBI). However it was reported to have lower sensitivity of 72% and specificity of 85% [12, 13]. As a consequence it does not free the physician from reviewing the entire footage and should only be used as a fast screening tool. Mackiewicz [14] used color histogram to extracts the bleeding characters and used Support Vector Classification (SVC) to recognize the bleeding WCE images. The procedure of this method is too intricate to be practical in clinic. Bourbakis[15] presented a method of neural network to recognize the bleeding regions in WCE images. However they did not present the neural network structure. They only used 13 images to train the neural network and 3 images to test the method. Moreover the sensitivity of this method was measured as lower than 80% in the experiments. Baopu and Meng [16] presented a three-layer Multilayer Perceptron (MLP) neural network to detect bleeding regions in WCE images. MLP is evolved from linear perceptron which has poor robustness and antiinterference ability, and so is seldom used in the nonlinear pattern recognition. The sensitivity of this method was measured as 90%, unfortunately, the specificity was not presented. Pan[17] built a BP neural network to detect bleeding. Nevertheless BP neural network is slow to process images, and is not feasible to process large amount of WCE images. Some other study works on this topic were reported [18, 19], but few satisfactory results were obtained.
This paper proposes two color vector similarity coefficients to measure the color similarity, and based on them a novel algorithm of bleeding recognition is implemented in RGB color space. The experiments show that the sensitivity of this algorithm is 97% and the specificity is 90%. Compared with existing algorithms, this algorithm is more suitable for WCE images detection because of the low computation complexity and practicability. Furthermore, this algorithm can realize the real time detection during the WCE examination course.
-
II. Color vector and Similarity Measurement
-
2.1 Color space and color vector
-
-
2.2 Color vector similarity coefficient
From the view of application, there are two classes of color space. The first class is the vision and perception oriented color space. The second one is the device oriented color space. HSI is the most common color space of the first class. H (hue) and S (saturation) compose the chroma of color, and I represents the luminance component of color, namely the gray intensity. The most common device oriented color space is RGB. Every color in RGB is composed of three basic color R (red) G (green) and B (blue): C≡rR+gG+bB[20], where C denotes some kind of color; ≡ denotes composing; r,g,b denote proportional coefficients. An ideal algorithm of digital color image processing should be in the basic device oriented RGB color space, without the complex color space transformation. Furthermore, the processed results should be shown in displace devices, so another transformation should be saved.
The RGB color space in normalized Cartesian coordinate system is shown in Figure 2. In this system, the black point is on the origin and the white point is on the farthest point (1,1,1) . It is clear that each color is equivalent to a point in the cube, and the colors can be represented with the vectors of these points.
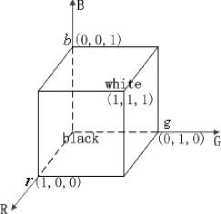
Figure 2. The RGB color space in Cartesian coordinate system.
In color image processing, the color difference measurement is essentially the color similarity measurement, which is the premise of the color image recognition. Distances such as Euler and Mahalanobis distance are often used to measure the color similarity. But the algorithm is not suitable in RGB color space, because RGB is not a uniform linear color space, that is to say the same distance comes with no same color difference. In this section a new algorithm to measure the color similarity applied in RGB is deduced.
A pixel in RGB can be expressed by a 3-dimension vector in Cartesian coordinate system as discussed in Section 2.1. Color C is equivalent to the color vector C(r,g,b) , where r,g,b are the components of the color vector. Assumed C 0 as a known typical bleeding pixel, the equivalent color vector is C 0 (r 0 ,g 0 ,b 0 ) . The color similarity measurement between C and C 0 is equivalent to the similarity measurement between the color vectors C(r,g,b) and C 0 (r 0 ,g 0 ,b 0 ) . Each color vector is uniquely determined by the amplitude and the direction, so the color vector similarity can be judged by the amplitude similarity and the direction similarity, namely the gray intensity similarity and the chroma similarity.
The amplitude of color vector is scalar which can be easily measured. The amplitude similarity between C(r,g,b) and C 0 (r 0 ,g 0 ,b 0 ) can be measured by the absolute value of their difference ||C|-|C 0 || . Normalizing the difference, the amplitude similarity coefficient namely the gray intensity similarity n < C C^ > is gotten:
n
< C , C 0 >
II C | - | C o il | C 0 |
Where | C | = r 2 + g 2 + b 2 and
| C0 |= ^r02 + g0 + b02 are the amplitudes of the color vectors C(r,g,b) and C0(r0,g0,b0) respectively. Formula (1) shows that: bigger the gray intensity similarity coefficient n is, more similar the two color vectors are; on the < c , c o > contrary, smaller n
|C| equals to |C o | , n < C Cg > equals 1, the max value.
The direction similarity can be measured by the included angle between the two color vectors. As shown in Figure 3, a is the included angle between the color vectors C(r,g,b) and C0(r0,g0,b0) . Consider α to be invariant, the locus of C(r,g,b) is a cone whose axis is C 0 (r 0 ,g 0 ,b 0 ) , and whose apex is on the origin.
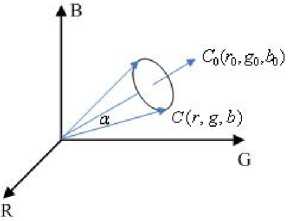
Figure 3. The color vector similarity measurement.
Figure 3 indicates that smaller a is, more similar the directions of the two color vectors are; on the contrary, bigger α is, less similar the directions are. Therefore the value of α scales the similarity degree of the chroma. According to Vectors' Inner-Product, cosα can be formulized as the following formula:
cos a = CC- = "• + gg 0 + bb (2) I C l| C 0 1 V r ’ + g ’ + b 2 7 r + g 0 + b
Where, C·C 0 =rr 0 +gg 0 +bb 0 is the inner product of the two vectors. Formula (2) indicates that bigger the included angle a is, smaller the function value of cos a is, and less similar the directions of the two color vectors are; on the contrary, smaller α is, bigger cosα is, and so more similar the directions are. Therefore, the value of cosα scales the similarity degree of the directions, and define it as the direction similarity coefficient, namely the chroma similarity. When C is proportional to C0 , namely C=kC0 ( k denotes a proportional factor), C coincides with C 0 and the directions are exactly same, then:
cos a = CC- = । "° + gg •+ bb 0 = 1 (3) l C ll C o l Ar ■ + g ■ + b ■ A r 0 + g 0 + b 2
Obviously the direction similarity coefficient cosα gets its max value in this case.
Taken together the measurement principle of the similarity coefficients is that: the similarity measurement of color, which is same to the similarity measurement of color vector, can be judged by the gray intensity similarity and the chroma similarity. The gray intensity similarity is measured by the gray intensity similarity coefficient n
-
III. Bleeding Detection
-
3.1 Bleeding pattern feature extraction
-
A frame of typical bleeding WCE image of the GI tract is shown in Figure 4. The most salient feature of the bleeding region is the color difference. Red as the whole image is, the saturation of the bleeding region looks higher comparing to the non-bleeding region.
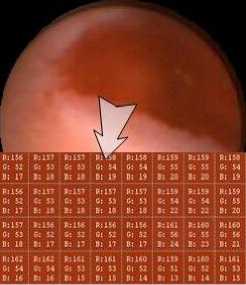
Figure 4. The typical bleeding WCE image and the bleeding region.
The images in Figure 5 is the gray image of the typical bleeding WCE image and the according histogram. The image shows clearly that the gray intensity in the bleeding region is obviously lower than that in the nonbleeding region. The reason is that the saturation in bleeding region is high, namely the color is mixed with little white light, the gray intensity is lower of course; while the saturation in non-bleeding region is low, namely the color is mixed with much white light, the gray intensity is higher. The distributions of bleeding and nonbleeding pixels in the typical bleeding WCE image indicates that there is a certain color range distinguishing bleeding pixels from non-bleeding pixels[21].
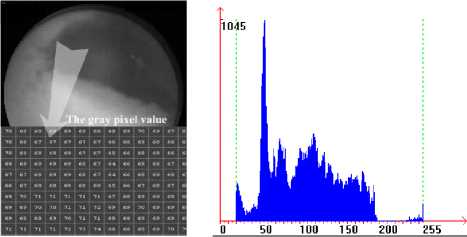
Figure 5. The gray image of bleeding WCE image and the according histogram image.
Comparing the pixels in WCE images with a typical bleeding pixel to measure the color similarity, if the color similarity is low, the two pixels are not similar, therefore the pixel is non-bleeding pixel; if the color similarity is high, the two pixels are similar, and therefore the pixel can be primarily recognized as bleeding pixel. We select a sample group of 181,480 bleeding pixels from 10 frames of WCE images to count the typical bleeding pixel. The mode (the most frequently occurring value) of the sample group is taken as the cluster center C0(r0,g0,b0) of the bleeding pattern. Based on the Traversal algorithm, the mode is calculated as C0(109,37,13). Taking the cluster center of bleeding pattern C0(109,37,13) as the typical bleeding pixel, and then the difference between the bleeding pixels and non-bleeding pixels is that the bleeding pixels are similar to the cluster center C0(109,37,13), while the non-bleeding pixels are not similar to it.
-
3.2 Classifier of pattern based on the similarity coefficient
In the sample group of 181,480 bleeding pixels, comparing all the pixels with the cluster center C 0 (r 0 ,g 0 ,b 0 ) to calculate these gray intensity similarity coefficients, n min =0.754 is the minimum one. So let n min =0.754 be the threshold value of the gray intensity similarity coefficient classifying function, and then the classifying function is:
d I
(
X
)
=
n
— ' ' < X , C о > min < X , C о >
Where X is the pixel to be recognized. If d_I(X) is nonnegative, the pixel X is recognized as bleeding pattern; otherwise, the pixel X is recognized as non-bleeding pattern. Consider B_I(X) to be the gray intensity similarity coefficient classifier, and B_I(X)=1 is defined as bleeding pattern, B_I(X)=0 is defined as non-bleeding pattern. Upon that, the gray intensity similarity coefficient classifier can be formulized as the following function:
B I ( X ) = | 0
d _ I ( X ) > 0
d _ I ( X ) < 0
By the same token, in the sample group of 181,480 bleeding pixels, comparing all these bleeding pixels with the cluster center C 0 (r 0 ,g 0 ,b 0 ) to calculate these chroma similarity coefficients, cosα min =0.96 is the minimum one. So let cosα min =0.96 be the threshold value of the chroma classifying function, and then the classifying function is:
d _ c ( X ) = cos < X , C 0 > - cos a min = cos < X , C 0 > - 0.96
Where
1 d c ( X ) > 0
B C ( X ) = _ V ’ (7)
- [ 0 d _ c ( X ) < 0
The contents of WCE images of the GI tract are complex, and many pixels are on the edge between the bleeding pattern and the non-bleeding pattern. So it is hard to simply classify all the pixels into bleeding pattern and non-bleeding pattern. To address this problem, the pixels on the edge are classified into suspicious bleeding pattern. And then each pixel to be recognized can be classified into three patterns: bleeding pattern, nonbleeding pattern and suspicious bleeding pattern. When the output values of B_I(X) and B_C(X) are all 1, that means the gray intensity and chroma of the pixel to be recognized are all similar to the typical bleeding pixel, consequently the pixel is recognized as bleeding pattern; when the output values of the two classifiers are all 0, that means neither the gray intensity nor the chroma is similar to the typical bleeding pixel, consequently the pixel is recognized as non-bleeding pattern; when one output value is 0 and another is 1, the pixel is considered to be on the edge, consequently it is recognized as suspicious bleeding pattern. Consider d_out(X) to be the output pattern classifier, and define the output value B, NB and SB as bleeding pattern, non-bleeding pattern and suspicious bleeding pattern respectively, the output pattern classifier can be formulized as the following function:
[ B B _ I ( X )&& B _ C ( X ) = 1
d _ out ( X ) = WB B _ I ( X )|| B _ C ( X ) = 0 (8)
[ SB others
Where && represents the logical AND operation and || represents the logical OR operation.
-
3.3 Bleeding detection algorithm and implementation
Based on the classifier in Formula (8) , the bleeding detection algorithm is implemented as the following steps, which is illustrated in Figure 6: (a) Read the WCE image to be detected, remove the black margin and too dark regions, because too dark pixels are hardly recognized even for human, maybe they are unsuccessfully imaged or caused by signal interference; (b) Scan the WCE image pixel by pixel, measuring the gray intensity similarity and chroma similarity between the pixel and bleeding pattern cluster center C 0 (r 0 ,g 0 ,b 0 ) , then put the results of the two similarity measurements into the classifier d_out(X) to judge. Go on measuring and judging pixel by pixel until the first bleeding pixel in the WCE image is gotten; (c) Take this bleeding pixel as the first seed, and take the output of the classifier d_out(X) as the growing law to go on the seeded-region-growing algorithm. After a new bleeding pattern pixel is gotten, take it as a new seed and go on the seeded-region-growing steps until the whole WCE image is finished; (d) The pixels are classified into bleeding pattern, non-bleeding pattern and suspicious bleeding pattern; (e) If a bleeding area is too small, this bleeding region is not really bleeding pattern because it is impossible for bleeding pixel emerges insularly or only few number.
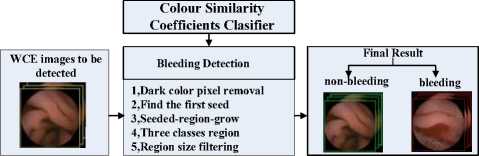
Figure 6. The frameworks of the bleeding detection algorithm.
After these steps, the WCE image will be included into the bleeding images if there are bleeding regions, otherwise it will be included into the non-bleeding images.
According to the bleeding detection algorithm and the implementation steps, the bleeding detection application software is programmed, and the WCE images shown in Figure 7 are detected. The images in Figure 7 are the confirmed bleeding WCE images, and the detection results are shown in Figure 8. In the results, red green and yellow regions are the bleeding region, non-bleeding region and suspicious bleeding region respectively. After being filtered out, the small area bleeding regions are marked as the suspicious bleeding regions which are shown as yellow. The detection results show that the bleeding and non-bleeding regions are clearly and correctly marked out and the suspicious bleeding regions are also marked out as yellow.
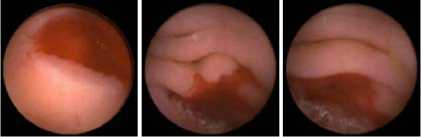
Figure 7. Images to be detected.
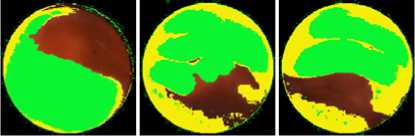
Figure 8. The detection result.
-
IV. Experiments and Analyses
-
4.1 Pixel level test
Medical diagnostic applications are often perceived by physicians as providing absolute answers. The absolute answer of the bleeding detection is bleeding image or non-bleeding image. As a consequence, the bleeding images can be possibly recognized as non-bleeding images which are called false non-bleeding ( Fnb ) recognition, and the non-bleeding images can be possibly recognized as bleeding images which are called false bleeding ( FB ) recognition. Others cases are true recognitions and the true bleeding recognition is presented by TB , and the true non-bleeding recognition is presented by Tnb . To assess the capability of the bleeding detection algorithm, namely the performance of the classifier, sensitivity ηse and specificity ηsp are adequate which are estimated as: [22]
~ Z Tb n se = Z Tb + Z Fnb
Z Tnb n = — sp Z Tnb + Z Fb
To assess the performance of the bleeding detection algorithm, we test the bleeding detection software on the pixel level and the frame level.
Totally 20 frames of confirmed bleeding WCE image are chosen for the test on pixel level. Pick the bleeding pixels and the non-bleeding pixels to compose the sample group, which contains 339,850 bleeding pixels and
590,725 non-bleeding pixels. Run the bleeding detection software on the sample group, and the result is shown in Tab 1.
Table 1. The result of the pixel level test (units: pixels).
detected as detected as non- total bleeding bleeding
|
actually bleeding |
312,662 |
27,188 |
339,850 |
|
actually non- |
70,887 |
519,838 |
590,725 |
|
bleeding |
|||
|
total |
383,549 |
547,026 |
930,575 |
|
sensitivity |
92% |
||
|
specificity |
88% |
Table 1 shows the sensitivity and specificity of this algorithm is 92% and 88% respectively. In the test, the suspicious bleeding pixels are considered as non-bleeding pixels for convenience. The most misclassified pixels are those bright-less pixels whose chrominance feature is unobvious, and they are even cannot be detected by human. They are classified into the bleeding sample group just because they are in bleeding region and are recognized by morphological characters. From the bleeding detection steps (shown in Figure 6) we know if there are bleeding regions, the WCE image will be recognized as bleeding image. So misclassification on some pixels won’t affect the results of the detection from the view of physician. Therefore the test on pixel level is not as important as the test on image level.
-
4.2 Frame level test
For the test on image level, we obtain 150 full length video clips consisting of 14,630 frames of WCE image which are available on the endoscopy organization website. There are 3,172 bleeding images and 11,458 non-bleeding images detected manually. We run the bleeding detection software on these full length video clips and the detection result is shown in the Tab 2.
Table 2. The result of the image level test (units: frames).
detected as detected as non- total bleeding bleeding
|
actually bleeding |
3,087 |
85 |
3,172 |
|
actually non- |
1,154 |
10,304 |
11,458 |
|
bleeding |
|||
|
total |
4,241 |
10,389 |
14,630 |
|
sensitivity |
97.32% |
||
|
specificity |
89.93% |
The result in Tab 2 shows that the sensitivity of this algorithm is 97% and the specificity is almost 90%. Comparing with Tab 1, the sensitivity on frame level is obviously higher than that on pixel level. The reason is that the most misclassifications of pixels are mostly on the edge of bleeding pattern and non-bleeding pattern, but this kind of misclassification doesn’t affect the image classification. The most image misclassifications mostly occur when the old hemorrhage is present in the WCE images so the bleeding regions are too dark. If set the thresholds of the classifier function more undemanding, the sensitivity will be some higher, while the specificity will be draw down.
-
V. Conclusions
WCE is a relatively new technology to examine the entire GI trace non-invasively, painlessly and without a dead zone. But during one examination course of a patient WCE will generate large amount of images. With the development of this technology, much more high definition images will be generated, then it is even impossible for the physician to analyses the full length video footage. Therefore it is necessary and urgent to develop computer aided intelligent algorithm to inspect the WCE images with low computation complexity.
After studying the color vector similarity measurement deeply, this paper proposes a new algorithm to measure the color similarity using the gray intensity similarity coefficient n < C Co > and chroma similarity coefficient cos a.
Bigger the values of the similarity coefficients n < C , C o > and cosα are, more similar the two color vectors are; on the contrary, smaller the similarity coefficients are, less similar the color vectors are; when the two color vectors are exactly same, the two similarity coefficients both equal 1, their maximum values. Based on the similarity coefficients, the color similarity coefficient classifiers are built which are applied in the RGB color space; combining the classifier with the seeded-region-growing, a novel algorithm of bleeding intelligent detection in WCE image is implemented. The experiments show that the sensitivity and the specificity of this method are 97% and 90% respectively. Compared with existing bleeding detection algorithms, this algorithm is featured with clear concept, low computation complexity and practicability, consequently is more suitable for the video WCE images processing.
Acknowledgment
This work was supported by the National Natural Science Foundation of China (No. 30771247).
References A Novel Algorithm for Color Similarity Measurement and the Application for Bleeding Detection in WCE
- K.R. Canlas, B.M. Dobozi, S. Lin, A.D. Smith, D.C. Rockey, A.J. Muir, N.M. Agrawal, M.H. Poleski, K. Patel, and J.G. McHutchison, “Using capsule endoscopy to identify GI tract lesions in cirrhotic patients with portal hypertension and chronic anemia,” Journal of Clinical Gastroenterology, vol. 42, (no. 7), pp. 844-848, 2008.
- R. Eliakim, A. Suissa, K. Yassin, D. Katz, and D. Fischer, “Wireless capsule video endoscopy compared to barium follow-through and computerised tomography in patients with suspected Crohn's disease--final report,” Digestive and Liver Disease, vol. 36, (no. 8), pp. 519-522, 2004.
- G. Iddan, G. Meron, A. Glukhovsky, and P. Swain, “Wireless capsule endoscopy,” Nature, vol. 405, (no. 6785), pp. 417-417, 2000.
- P. Swain, G.J. Iddan, G. Meron, and A. Glukhovsky, “Wireless capsule endoscopy of the small bowel: development, testing, and first human trials,” Biomonitoring and Endoscopy Technologies, Amsterdam, Netherlands, SPIE, vol.4158, pp. 19-23, 2001. [In Chinese]
- P. GuoBing, Y. GuoZheng and S. XinShua, “Design of Digital RF Module for JPEG-Based Wireless Capsule Endoscope,” Journal of Shanghai Jiaotong University, vol. 43, (no. 6), pp. 894-897, 2009.
- P. GuoBing, Y. GuoZheng, S. XinShuai, and Q. Xiangling, “A novel JPEG-based wireless capsule endoscope,” Biomedical Instrumentation and Technology, vol. 44, (no. 6), pp. 519-522, 2010.
- M. Delvaux and G. Gay, “Capsule endoscopy in 2005: Facts and perspectives,” Best Practice & Research in Clinical Gastroenterology, vol. 20, (no. 1), pp. 23-39, 2006.
- M. Pennazio, “Capsule endoscopy: Where are we after 6 years of clinical use?,” Digestive and Liver Disease, vol. 38, (no. 12), pp. 867-878, 2006.
- G.C. Sturniolo, V. Di Leo, M.G. Vettorato, M. De Boni, F. Lamboglia, M. De Bona, A. Bellumat, D. Martines, and R. D'Inca, “Small Bowel Exploration by Wireless Capsule Endoscopy: Results from 314 Procedures,” American Journal of Medicine, vol. 119, (no. 4), pp. 341-347, 2006.
- N. Kameda, K. Higuchi, M. Shiba, M. Tabuchi, S. Sugimori, T. Yukawa, K. Kadouchi, H. Okazaki, H. Machida, M. Inagawa, T. Wada, T. Tanigawa, H. Yamagami, K. Watanabe, T. Watanabe, K. Tominaga, Y. Fujiwara, N. Oshitani, and T. Arakawa, “A Prospective Trial Comparing Wireless Capsule Endoscopy and Double-Balloon Enteroscopy in Patients with Obscure Gastrointestinal Bleeding,” Gastrointestinal Endoscopy, vol. 63, (no. 5), pp. AB162-AB162, 2006.
- I.M. Storch, I. Schmelkin, S. Vance, and J. Barkin, “A Double Blind Placebo Controlled Study of Tegaserod to Increase Gastric and Small Bowel Transit Times with Wireless Capsule Endoscocpy (WCE): Preliminary Data,” Gastrointestinal Endoscopy, vol. 63, (no. 5), pp. AB192-AB192, 2006.
- J.M. Buscaglia, S.A. Giday, S.V. Kantsevoy, J.O. Clarke, P. Magno, E. Yong, and G.E. Mullin, “Performance Characteristics of the Suspected Blood Indicator Feature in Capsule Endoscopy According to Indication for Study,” Clinical Gastroenterology and Hepatology, vol. 6, (no. 3), pp. 298-301, 2008.
- S. Liangpunsakul, L. Mays, and D.K. Rex, “Performance of given suspected blood indicator,” The American Journal of Gastroenterology, vol. 98, (no. 12), pp. 2676-2678, 2003.
- M. Mackiewicz, M. Fisher, and C. Jamieson, “Bleeding detection in Wireless Capsule Endoscopy using adaptive colour histogram model and Support Vector Classification,” Medical Imaging 2008 Conference, San Diego, CA, SPIE, vol.6914, pp.R1-R12, 2008.
- N. Bourbakis, S. Makrogiannis, and D. Kavraki, “A neural network-based detection of bleeding in sequences of WCE images,” 5th IEEE Symposium on Bioinformatics and Bioengineering,Minneapolis, MN, pp. 324-327, 2005.
- L. Baopu and M.Q.H. Meng, “Computer aided detection of bleeding in capsule endoscopy images,” 2008 Conference on Electrical and Computer Engineering,Niagara Falls, CANADA, pp. 1963-1966,2008.
- G. PAN, G. YAN, X. SONG, and X. QIU, “BP neural network classification for bleeding detection in wireless capsule endoscopy,” Journal of Medical Engineering & Technology, vol. 33, (no. 7), pp. 575-581, 2009.
- S. Hwang, J. Oh, J. Cox, S.J. Tang, and H.F. Tibbals, “Blood detection in wireless capsule endoscopy using expectation maximization clustering,” 2006 Image Processing Medical Imaging,San Diego, CA, USA, SPIE, pp.1-11, 2006.
- J. Yun Sub, K. Young Ho, L. Dong Ha, and K. Jong Hyo, “Active Blood Detection in a High Resolution Capsule Endoscopy using Color Spectrum Transformation,” 2008 International Conference on BioMedical Engineering and Informatics,Sanya, Hainan , China, pp. 859-862, 2008.
- Z. Yujin, Image Engineering, Beijing, China: Tsinghua publisher press, 2007.
- G. PAN, G. YAN, X. QIU, and J. CUI, “Bleeding Detection in Wireless Capsule Endoscopy Based on Probabilistic Neural Network,” Journal of Medical Systems, 2010.
- A. DG and B. JM, “Diagnostic tests. 1: Sensitivity and specificity. ,” BMJ, vol. 308, (no. 6943), pp. 1552, 1994.
