A Novel Algorithm for De-Noising Radiographic Images

Author: Alireza Azarimoghaddam, Lalitha Rangarajan
Journal: International Journal of Image, Graphics and Signal Processing(IJIGSP) @ijigsp
Article in issue: 6 vol.4, 2012.
Free access
The radiographic image has low contrast and high noise. In order to improve the image for observation and accurate analysis, various digital image processing techniques can be applied. In this research we propose Two Dimensional Left Median Filter method for de-noising radiographic images of welding. We have used the measures Peak Signal-to-Noise Ratio and the Mean Absolute Error for comparison. The accuracy of results obtained through our method is better than the Median and Mean Filter methods.
Two Dimensional Left Median Filter, Median Filter, Weld, Radiographic Image
Short address: https://sciup.org/15012330
IDR: 15012330
Text of the scientific article A Novel Algorithm for De-Noising Radiographic Images
Published Online July 2012 in MECS DOI: 10.5815/ijigsp.2012.06.04
-
I. INTRODUCTION
Radiography (X-rays or sometimes gamma rays) seems to be the most effective method and the experts are able to identify most types of defects in the images produced by this method. The method is based on the fact that the defective areas absorb more energy and thus the defects appear darker in the image. Radiography is a reliable and tested method of nondestructive radiative testing and diagnostics perfected during more than 100 years from the moment of the discovery of mysterious rays by Wilhelm Konrad Roentgen in 1895. Afterwards, these rays have been called Roentgen rays or X-rays [1]. The radiographic images are contaminated with noise and are also
blurred. In order to improve the image for observation and accurate analysis, various digital image processing techniques can be applied. Noise removal is required for improving the quality of the image in order to better recognize the defects. Use of various filters such as mean, median are found in literature [ A. Rale; et al (2010)]. In digital image processing, filtering is the most common and basic operation, because the results of filtering directly influence all the following operations such as image enhancement, edge detection, shape detection etc [ M. Fu; et al (2010)].
Images may be corrupted by noise. Noise is introduced as a result of the electronic circuitry of cameras or during transmission of images [A. Aboshosha ; et al (2010)]. A large number of linear and non linear filtering algorithms have been developed to reduce noise from corrupted images to enhance image quality.
A lot of filtering methods, such as Median and Mean filters and etc are proposed to eliminate salt and pepper noise. The most widely used filter for smoothing noise in radiograph images is the median type. The output value of a pixel while using this filter, is the mid of the pixel values of its neighbors. The Standard Median filter first suggested by Tukey (1971) is improved rapidly and widely used in image processing [S. Liu; et al(2010)]. Median filter is a statistical sort filtering; it sorts the pixels in the fixed window to find the middle gray level value and the centre pixel in the window is replaced by this median value [S. J. Ko; T. M. Forest(1993)]. The drawback is handling all pixels uniformly, which causes blur of the image at the same time [J. Jiang and J. Shen(2010)].Use of Median Filter to reduce noise and to enhance contrast is very common as this is simple and quick process [8-14].
In this research we propose Two Dimensional Left Median (2D-LMF), Two Dimensional Right Median (2D-RMF) and Two Dimensional Centre Median (2D-CMF) Filters for the reduction of noise, and we have compared the performance of these methods with Median and Mean filter.
The Median and Mean Filters are described in section 2, proposed algorithm is shown in section 3, experimental results and comparison study may be found in section 4. Section 5 concludes the paper.
-
II. STANDARD FILTERS
-
A. Median Filter
The median filter has good performance in noise elimination, without removing relevant defects and without decreasing image sharpness as much as mean filter [G. Wang; T. W. Liao; (2002)]
In the Median Filter Method, a square window of size p x p (p is an odd number) is considered. The centre pixel in the scan window is to be de-noised. The first step is to sort the value of all pixels in the scan window, next step is to find out the median (middle value of pixel intensities) of all the pixels in the scan window, and finally change the value of the central pixel in the scan window into the median of the sorted sequence. In the median filter, the centre element of the window is replaced by the median of the p2 pixels.
For the window shown in below, suppose MF (i,j) is the median of the values in 3 x 3 neighborhood pixels where (i,j) represents pixel coordinates in the window centre. Figure -1 shows the filtered pixel intensity of the selected pixel. The median filter method is a simple and efficient technique to remove impulse noise, and it has been used since long and continues to be in use for many applications.
-
B. Mean Filter
Mean Filter, is windowed filter of linear class, that smoothes image. The filter works as low-pass one. The basic idea behind filter is for any element of the image take an average across its neighborhood. In the Mean Filter Method, same Median filter, a square window of size p x p (p is an odd number) is considered, but the centre element of the window is replaced by the mean of the pixels.
MF (i,j) = Median (x 1 , x 2 , . . . , x 8 , x 9 )
Mean (i,j) = (x 1 + x 2 +…+ x 8 + x 9 ) / 9
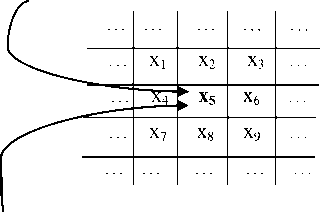
Figure 1. 3x3 neighborhood pixels as a mask for median or mean filtering
-
III. TWO DIMENSIONAL LEFT, RIGHT, AND CENTER MEDIAN FILTER
In this paper, we also consider a square window of size p X p (p is an odd number) for filtering. In our methods, we replace the value of the central pixel in the scan window by the mean of q pixels of the scan window.
In these methods, after sorting the value of all pixels in the scan window, we choose q pixels from median pixel to left for 2D-LMF, from median pixel to right for 2D-RMF, and centre pixels for 2D-CMF, then we calculate the mean of these q pixels, and finally replace the value of the central pixel in the scan window by this mean of q pixels.
Methodology:
Algorithm: 2D- LMF Algorithm
Input: I = A radiographic image (m X n), p = size of window
Output: Filtering image (m X n)
Algorithm:
Step 1: Compute q = (p+1) / 2
Step 2: Create a matrix J by ((m+p-1) X (n+p-1)),
I is center of J.
Step 3: Consider scan window W of size p X p, with centre (i,j)
Step 4: Sort elements of W as (X 1 , . . . ,X med-1 , X med , X med+1 , . . . , X pxp )
med
Step 5: Define 2DLMF i,j = ( ∑ X k ) / q , (1)
(med-q+1)
End.
In the 2D- RMF Algorithm, we changed the step 5.
(med+q-1)
Step 5: Define 2DRMF i,j = ( ∑ X k ) / q , (2)
med
In the 2D- CMF Algorithm, we changed the step 5.
(u+q-1)
Step 5: Define 2DCMF i,j = ( ∑ X k ) / q (3)
u
Where, u= med – fix ((p - q)/2)
-
IV. EXPERIMENT AND RESULTS
We tested the proposed approach with gray-scale radiographic images of weld, with gray values in [0 to 255]. We implemented our algorithm in MATLAB environment. In the simulations, images are corrupted by “salt” and “pepper” (with values 255, 0 respectively) noise with equal probability. Noise levels were varied from 5% to 85% with increments of 5%.
We have experimented with different window sizes for any given noise level and found suitable window sizes for the filtering as shown in Table 1. For our experiment, we have selected window size to be 27 X 27.
TABLE 1- EXPERIMENTED OPTIMAL SIZE OF WINDOW
|
Noise Level |
Window size |
|
5 ≤ 50 |
7 x 7 |
|
55, 60 |
9 x 9 |
|
65 |
11 x 11 |
|
70 |
13 x 13 |
|
75 |
15 x 15 |
|
80 |
21 x 21 |
|
85 |
27 x 27 |
The resultant noise tends to be very spiky of from a distribution with long tails as shown in Figure 2. Our filtering methods of this edge enhanced image results in blurred edges and the spiky noise points would be smoothened. Figure 3 illustrates this with our proposed filtering method from figures 3 it is evident that the two dimensional left median filter has reduced the spiky noise in original profile (figure 2).
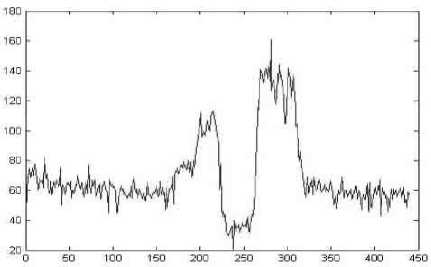
Profile Size
Figure 2- A profile of sample image before 2D-LMF
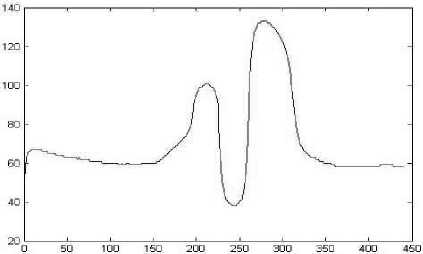
Profile Size
Figure 3- A profile of sample image after 2D-LMF

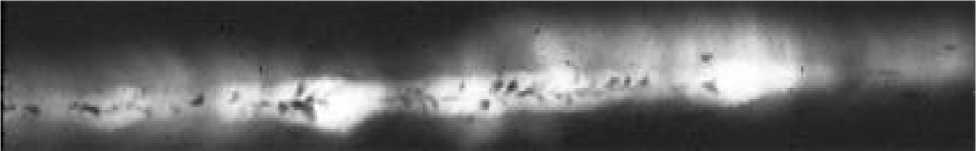
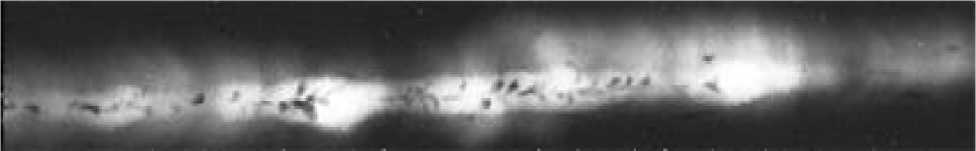
(a)
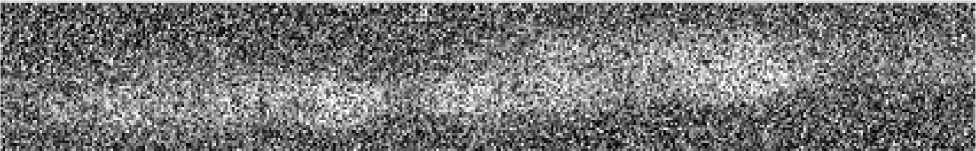
(b)
(c)

(d)

(e)
(f)
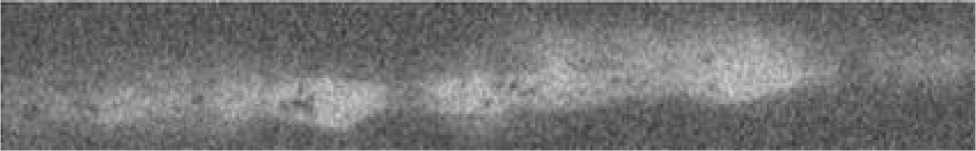
(g)
Figure 4- Sample of Welding image: (a) Original Image, (b) Corrupted image with 60% salt-and-pepper noise, (c) Median Filter, (d) 2D-LMF, (e) 2D-RMF, (f)2D-CMF, and (g) Mean Filter
We have used the measures Peak Signal-to-Noise Ratio and the Mean Absolute Error for comparison. We have compared our algorithm with standard median filter and mean filter, with same window sizes and noise levels.
-
A. Peak Signal-to-Noise Ratio (PSNR)
We calculated the Peak Signal-to-Noise Ratio (PSNR) [A. Bovik(2000)]. PSNR measure is very common in image processing. A sample use is in the comparison between an original image and a restored image. Typical values for the PSNR in loosy of noisy image and video compression are between 30 and 50 dB, where higher is better.
m X n X Max2
PSNR = 10 log 10 (4) ∑ i,j (r i,j – x i,j )2
Here, r i,j and x i,j denote the pixel values of the restored image and the original image, respectively, m and n are size of image, and ‘ Max ’ is the maximum possible pixel value of the image. When the pixels are represented using 8 bits per sample, this is 255.
Peak signal-to-noise ratio (PSNR) has traditionally been used in analogue systems as a consistent quality metric. However, digital video technology has exposed some limitations of PSNR. Yet, because of its low complexity, PSNR is still used as a video quality metric for evaluating image processing algorithms (e.g. video de-noising methods) and is considered to be a reference benchmark for developing perceptual video quality metrics. The peak signal-to-noise ratio (PSNR) is the ratio between a signal's maximum power and the power of the signal's noise. Engineers commonly use the PSNR to measure the quality of reconstructed images [Q. Huynh-Thu; M. Ghanbari;(2008)].
-
B. Mean Absolute Error (MAE)
The Mean Absolute Error (MAE) is a statistical measure of how far estimates or forecasts are from actual values. It is most often used in time series, but can be applied more widely, to any sort of statistical estimate. In fact, it could be applied to any two pairs of numbers, where one set is original and the other is an estimate, forecast or prediction.
MAE = ∑ i,j |r i,j – x i,j | (5) m X n
Our proposed de-noising methods accomplish a significantly high PSNR and low MAE even when the noise level is high. Chan R.H. and et al found similar results [R. H. Chan; et al (2005)]. This is mainly based on the accurate noise detection by the median filter and the edge-preserving property of Nikolova’s variational method [M. Nikolova;(2004)].
We have measured PSNR and MAE between the original images by our methods and Median and Mean Filters on the equivalent window size for all images.
Window size 27 X 27 in PSNR resulted in higher PSNR with our methods than other, especially for wider range of noise levels greater than 5%. In measuring MAE the level of our methods are less than Median and Mean Filter.
As can be seen in Fig. 5and 6, the difference of measure of PNSR (and MAE) increases with noise levels. Therefore, even at a higher level (85%) accuracy of our methods is better than Median and Mean Filters.
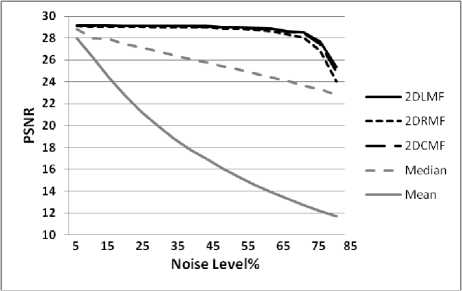
Figure 5-- PSNR at various noise levels in sample image
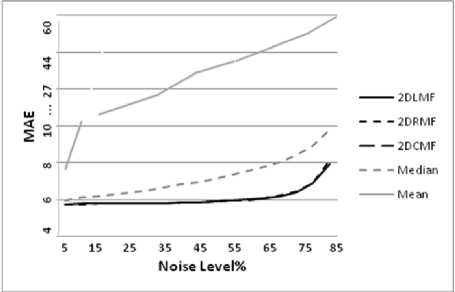
Figure 6-- MAE at various noise levels in sample image
V. CONCLUSION
In this paper, we have proposed an enhancement method for radiographic images. It can be a better filter for removing salt-and-pepper noise. Experimental results showed that our methods perform much better than median and mean filter methods. Even at a high noise level (85%) 2D-LMF is better than 2D-RMF and 2D-CMF. The accuracy of Median Filter is limited against Salt – Pepper noise. An improvement to Median Filter namely of 2D-LMF (Two Dimensional Left Median Filter) is suggested for digital radiographic images of welding. Various other noises, such as the random-valued impulse noise or Gaussian noise can be looked into to evaluate 2D-LMF.
AKNOWLEDGMENT
The authors would like to thank IIW for useful their radiographic images.
References A Novel Algorithm for De-Noising Radiographic Images
- http://www.wikipedia.org.
- AP. Rale, DC. Gharpure, and VR. Ravindran. Comparison of different ANN techniques for automatic defect detection in X-Ray images. International Conference of Emerging Trends in Electronic and Photonic Devices & Systems, Varanasi ,pp. 193-197, 2009.
- Fu, M., Sun, J., Zhong, S., and Zou, C. “An iterative filtering algorithm based on signaling game idea”. International Conference on Computer and Communication Technologies in Agriculture Engineering, 2010, pp. 17-20.
- A. Aboshosha, M. Hassan, M. Ashour, and M. El Mashade. “Image denoising based on spatial filters, an analytical study”. IEEE, 2010, pp. 245-250.
- S. Liu, L. Chen, X. Fan, Z. Qu, and X. Yang, X. “Combining Pseudo-median filter and median filter to improve performance”. IEEE, 2010, pp. 513-517.
- S. J. Ko, T. M. Forest. Image sequence enhancement based on adaptive symmetric order statistics. Circuits and Systems II: Analog and Digital Signal Processing. IEEE Transactions on, 1993,Vol. 40(8), pp. 504-509.
- J. Jiang; J. Shen. “An Effective Adaptive Median Filter Algorithm for Removing Salt & Pepper Noise in Images”. IEEE, 2010, pp. 1-4.
- G. Wang, T. W. Liao. “Automatic identification of different types of welding defects in radiographic images”. NDT & E International, 2002, Vol. 35(8), pp. 519-528.
- R.R. Da Silva,M.H.S. Siqueira, L.P. Caloba, I.C. Da Silva, A. De Carvalho, and J. Rebello. “Contribution To The Development Of A Radiographic Inspection Automated System”. Journal of Nondestructive Testing, 2002, Vol. 7(12) , pp. 1-8.
- M. Carrasco, D. Mery. “Segmentation of welding defects using a robust algorithm”. Materials Evaluation, 2004, Vol. 62(11) , pp. 1142-1147.
- G. Padua, R. Silva, M. Siqueira, J. Rebello, L. Caloba, L. and R. De Janeiro. Classification of welding defects in radiographs using traversal profiles to the weld seam. 16th World Conference on Nondestructive Testing, 2004.
- N. Nacereddine, M. Zelmat, S. Belaifa, and M. Tridi. “Weld defect detection in industrial radiography based digital image processing”. World Academy of Science, Engineering and Technology, PWASET, 2005, Vol. 2, pp. 145-148.
- S. Alghalandis, G. Alamdari. Welding defect pattern recognition in radiographic images of gas pipelines using adaptive feature extraction method and neural network classifier. 23rd World Gas Conference, Amesterdam, 2006.
- T. Nikiforova, N. Fedotov. “Methods of stochastic geometry in recognition of weld defects”. Pattern Recognition and Image Analysis, 2006, Vol. 16(1) , pp. 12-14.
- A. Bovik .Handbook of Image and Video Processing. 2ed ed. New York: Elsevier Academic Press, 2000.
- Q. Huynh-Thu, M. Ghanbari. “Scope of validity of PSNR in image/video quality assessment”. Electronics letters, 2008, Vol. 44(13), pp. 800-801.
- R. H. Chan, C.W. Ho, and M. Nikolova, M. “Salt-and-pepper noise removal by median-type noise detectors and detail-preserving regularization”. Image Processing, IEEE Transactions, 2005, Vol. 14(10) , pp. 1479-1485.
- M. Nikolova. “A variational approach to remove outliers and impulse noise”. Journal of Mathematical Imaging and Vision, 2004, Vol. 20(1) , pp. 99- 120.
