A Novel Approach for Diagnosis of Glaucoma through Optic Nerve Head (ONH) Analysis using Fractal Dimension Technique
 Analysis using Fractal Dimension Technique")
Author: Dharmanna L, Chandrappa S, T. C. Manjunath, Pavithra G
Journal: International Journal of Modern Education and Computer Science (IJMECS) @ijmecs
Article in issue: 1 vol.8, 2016.
Free access
According to the survey of World Health Organization (WHO), the number of people getting affected by glaucoma eye disease in worldwide will be 79.11 million by the year 2020. Glaucoma is a dangerous eye disease, which can lead to permanent vision loss if not provided proper treatment at the right time. Currently ophthalmologists detect the glaucoma disease based on estimation of cup to disk ratio, but this method suffers from accurate segmentation of regions like optic disk and optic cup. However, this introduces errors in the diagnosis. Therefore in this paper, Hausdrop Fractal Dimension (HFD) technique is adopted for identification of the glaucoma eye disease. Here, Optic disk perimeter parameter is used in HFD technique for classification of healthy or glaucomatous retinas. Average fractal dimension is calculated for a set of healthy optic disks and the fractal dimension is found to be 0.998, whereas for glaucomatous optic disks obtained average fractal dimension value 1.342.
Glaucoma, Optic Cup, Optic Disk, Fractal Dimension, Optic Nerve Head, Cup to Disk Ratio, Hausdrop Fractal Dimension
Short address: https://sciup.org/15014832
IDR: 15014832
Text of the scientific article A Novel Approach for Diagnosis of Glaucoma through Optic Nerve Head (ONH) Analysis using Fractal Dimension Technique
Published Online January 2016 in MECS DOI: 10.5815/ijmecs.2016.01.08
Glaucoma is the name given to a group of eye conditions in which the retinal optic nerve is damaged at the point where it leaves the eye. The main function of this retinal optic nerve is to carry visual information from the light sensitive layer present in the eye, the retina, to the brain, where it is recognized as an object. An eye requires a definite quantity of pressure to retinal eyeball to maintain its accurate shape, so that it can work correctly. In many people, the retinal damage is caused by elevated eye pressure. Many people may even have an eye pressure within the normal range, which is in between 10 mmHg to 20 mmHg. Damages may happen if there is a weakness in the retinal optic nerve. In maximum cases both reasons are included, but to a varying extent.
-
A. Causes
The main cause of glaucoma is the failure of human eye to maintain a proper balance between the amount of fluid produced and the amount of fluid drained out. Increase in eye fluid inside the eye causes damages to retina that leads to glaucoma.
What controls intraocular pressure (IOP) in the retina?
A layer of cells behind the iris produces a fluid called aqueous fluid. The aqueous fluid flows through a hole in the center of the iris i.e. pupil and leaves the eye through a small drainage canal. These are in the angle between the front of the eye and the iris and these return the fluid to the blood stream. Usually the fluid generated is balanced by the fluid draining out, but if there is blockage in the trabecular chamber or if too much aqueous fluid is produced then eye pressure, intraocular pressure (IOP), will increase (exceeds 20mmHg).
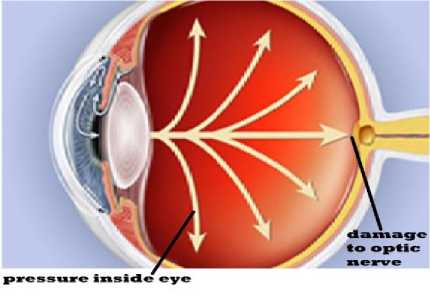
Fig.1. Optic Nerve Damage Due to High IOP
Why can increased eye pressure be serious?
If the Retinal Optic Nerve (RON) falls under very high pressure (IOP), it can be damaged as shown in Fig.1. Amount of damage to RON depends on how much pressure is present inside the eye, how long it has continued, blood supply and other weaknesses of the retinal optic nerve. An increased IOP will damage the retinal optic nerve very soon. An even lower level, i.e. less than 10 mmHg of IOP can also lead to damages in the retinal optic nerve, but more steadily. Hence, the person will slowly lose eye sight, if not treated at right time.
-
B. Types of Glaucoma
There are four main types of glaucoma:
-
i. Chronic Glaucoma: The most general glaucoma disease is chronic glaucoma in which the IOP can get to the drainage canals but they gradually turn out to be blocked over several years. The IOP increases very gradually and there is no eye pain for person to confirm there is a problem in the retina, but the vision field of an eye slowly becomes spoiled.
-
ii. Acute Glaucoma: Acute glaucoma is usually found in Western countries. This glaucoma occurs when there is an immediate jam to the flow of IOP to the retina. It is quite painful and will lead to permanent loss of eye sight if not treated at right time.
-
iii. Secondary and Developmental Glaucoma: These are two other main types of glaucoma. When the IOP is increased inside an eye it leads to another eye disease referred to as Secondary Glaucoma. Neovascular glaucoma is an example for secondary glaucoma. Developmental Glaucoma is another type of glaucoma which is associated with hereditary of familial diseases. Primary congenital glaucoma is an example for Developmental Glaucoma.
There are several clinical eye parameters used to detect the glaucoma. Among these main parameters are Intraocular Pressure, Vertical Cup to Disc Ratio, Neuro Rational Rim (NRR) area, Thickness of Retinal Nerve Fiber Layer and ISNT Rule. In this work, optic disk region is used to detect the glaucoma disease. This disk region is extracted using Fundus eye images. Fundus eye images are human eye images which are captured by Ophthalmoscopy or Fundus camera. These images are used to extract the cup area using available images processing techniques. Later fractal dimension is calculated for optic disk area. Finally this fractal dimension is used in glaucoma detection.
-
II. Literature Survey
The authors [1] adopted Causal Autoregressive Random (CAR) model to identify texture feature changes in Retinal Nerve Fiber Layer (RTNL) due to glaucoma attack. In this paper, authors utilized linear classifier to classify the healthy and damaged portion of RNF layer. The classification method accuracy is 96%.
This paper [2] describes computation of Cup to Disk Ratio (CDR) in order to identify the glaucoma. Before estimation of CDR, authors extracted portion of optic disk and optic cup using active contour segmentation method, then CDR is calculated by dividing cup diameter to disc diameter. In this work, only 25 healthy and unhealthy retinal images were adopted for the experiment. At the end, Authors concluded that increase in intra ocular pressure is the sign of the glaucoma.
This paper [3] reveals retinal image analysis. For analysis, authors developed the algorithm to identify the fovea, optic disk and blood vessels. Authors also focused on the diabetic retinopathy, age related macular degeneration and retinopathy prematurity. This paper also presents quantitative measurements of vascular topography, how these entities are based on optimization principals and how they have helped to describe the relationship between systemic cardiovascular disease and retinal vascular changes.
Authors discussed [4, 10 and 11] changes in IOP is a sign of glaucoma attack and also explained increased IOP causes damage to optic nerve axons at the back of eye retina. For glaucoma detection, CDR is the key clinical parameter. Hence, estimation of CDR is an important process to identify the glaucoma disease. So, in these papers automatic CDR computation method was developed to identify the glaucoma.
This paper [5] demonstrated a change in fovea as a sign of retinal disease. In normal eyes, radius of fovea is usually 200 microns. If radius of fovea shrinks, that indicates Macula disease. To identify the fovea region authors adopted two filters: first one is adoptive wavelet filter and second one is MDBUTMF. Both techniques were compared based on the PNR values. Authors were experimented these methods on DRIVE database and got good results.
The authors [6, 12] proposed a novel approach for segmentation of optic disk and cup based on super pixels classification. This approach is used for glaucoma disease identification. For OD extraction, cluster methods were adopted. Later, authors used these methods to classify every super pixel as optic disk or non-optic disk. For optic cup extraction, clustering techniques, global filter and threshold are used. After obtaining optic disk and optic cup, diameter of cup and disk are calculated. By using these diameters, CDR is estimated. At the end, This CDR is used to identify the glaucoma disease.
In this paper [7], authors presented a novel approach for automatic and landmark invariant quantification of the anterior chamber angle of the eye. Here, authors used swept source optical tomography (SS-OCT) images for angle closer glaucoma detection. Fractal dimension analysis technique is used to estimate the angle structured. To classify images, authors used the fractal dimension index. In this work, authors obtained fractal dimension 1.944 for open angle glaucoma and 1.894 for closed angle glaucoma. Hence, authors concluded that fractal dimension feature can be used to identify the angle closure glaucoma (ACG) disease.
Authors [8] developed a novel approach for extracting intra macular layers in Fourier domain optical coherence tomography (FD-OCT) images. For segmentation of intra macular layers, authors adopted a searching strategy and error removing technique. Searching strategy is based on locally weighted gradient extreme and error removing technique is based on statistical error estimation. Segmentation of cross sectional structures of optical coherence tomography images helps the ophthalmologist for early diagnosis of eye disease. Authors conducted experiments on four normal subjects and obtained the exact boundaries of seven physiological layers.
The paper [9] describes the automated glaucoma detection using color retinal fundus images. First, image preprocessing was performed on color retinal fundus image. Then different generic feature types are compressed. To compress the generic feature types, appearance based dimension reduction methods were used. Later, probabilistic two stage classification scheme was used to combine these feature types to extract the glaucoma risk index. At the end, this glaucoma risk index is used in disease diagnosis.
Dnyaneshwari D. Patil et al [13], presented an algorithm to calculate optic cup to disc ratio. For this purpose authors used DRIONS-DB high resolution fundus images. From these high resolutions RGB images ROI extraction was performed i.e. our optic disc detection. For extraction of optic cup and disc areas, authors used K-means clustering and later, measured the area of disc and cup then calculated ratio to diagnose glaucoma.
Malay Kishore Dutta et al [14], proposed an approach which was based on the segmentation of optic disk and the optic cup and also computed the cup-to-disc ratio. For segmentation of optic cup and optic disk a double threshold method was used.
Hafsah Ahmad et al [15], presents glaucoma detection through extraction of features from retinal fundus images. The features include Cup to Disc Ratio (CDR) and Ratio of Neuroretinal Rim in inferior, superior, temporal and nasal quadrants i.e. (ISNT quadrants) for verification of the ISNT rule. Authors were used the Gaussian filter and morphological operations to estimate these features.
W. Ruengkitpinyo et al [16], introduced a screening method for glaucoma detection using rim width indicator and cup-to-disc ratio. Rim width in each section of optic nerve was measured using bending vessel points and results were verified by ISNT rule for glaucoma classification. Authors also calculated cup-to-disc ratio and rim area for glaucoma screening.
S.Kavitha et al [17], developed an approach for the automatic localization and exact boundary detection of optic disc using the component analysis method and region of interest (ROI) based segmentation. Connected component analysis method was used to detect optic disk and later the active contour was used to plot the boundaries accurately.
From the above literature survey, we found that no author has presented method to identify glaucoma through analysis of optic nerve head. Fig. 2 (a) shows the glaucoma eye with enlarged optic disk. Therefore conventional methods like CDR estimation are not applicable to diagnose the disease. Hence, in this paper a novel approach is presented to detect glaucoma through analysis of boundaries of optic disk using Hausdrop fractal dimension method.
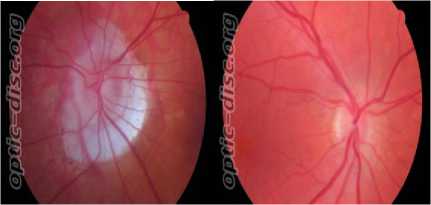
Fig.2. Left retina glaucoma affected and Right eye healthy Retina.
-
III. Methods
This section describes the database used in this work, fractal analysis, fractal dimension and hausdrop fractal dimension in the A, B, C and D sections respectively.
-
A. Database
-
B. Fractal Analysis
Fractals are of rough or irregular geometric shape objects that can be subdivided in to pieces. Each piece is a reduced copy of the whole object. These are natural or irregular objects that challenge usual measuring techniques, such as length and these are most often characterized by their fractal dimension. These are mathematical sets with a high degree of geometrical complexity that can model many natural phenomena. Almost all natural objects, like coastlines, trees, hills, sea waves, and clouds can be examined as fractals. One of the main characteristic of fractal is that its fractal dimension strictly exceeds topological dimension.
-
C. Fractal Dimension
The fractal dimension is a number,which usually includes decimal values and it denotes the degree of complexity of object or irregularity over multiple scales. This number computes how fractal differs from Euclidean objects such as point, line, plane, cube etc.
-
D. Hausdrop Dimension
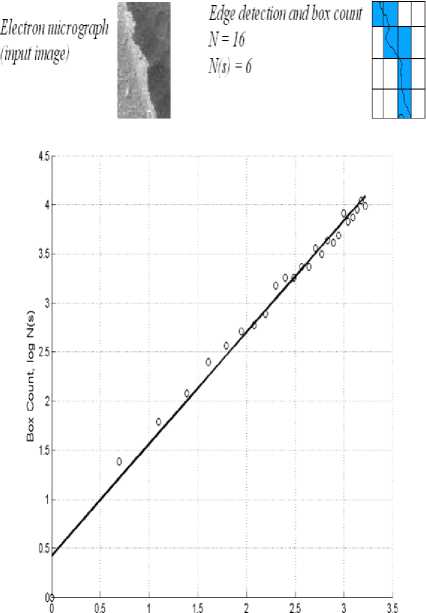
Hausdrop dimension is a mathematical concept introduced by the mathematician Felix Hausdorff in the year 1918. A quantitative analysis of irregular natural objects using perimeter parameter is carried out to demonstrate the degree of roughness of a natural object. Normally, it is called as the Hausdorff Dimension (HD). The technique showed in Fig. 3 gives the complexity of perimeter roughness or perimeter irregularity as a fractal dimension. This technique is accomplished by considering electron micrograph image as shown in Fig. 3. Here, electron micrograph image is input to the Matlab program as shown in Fig. 3. Then canny edge detection
technique is adopted to find the edge in the object. Later, a grid of N (i.e. N=16) squares are superimposed over the edge. Number of occupied squares that the edge passes through is calculated. Which is called N(s) (i.e. N(s) is 6). This is continued by increasing number of squares. At the end, Fractal dimension (H.D) is estimated by the slope of the log N over the log N(s) as depicted in Fig. 3 and equation (1):
log N log N ( 5 )
Number of blocks, log N
Fig.3. Estimation of Hausdorff Dimension
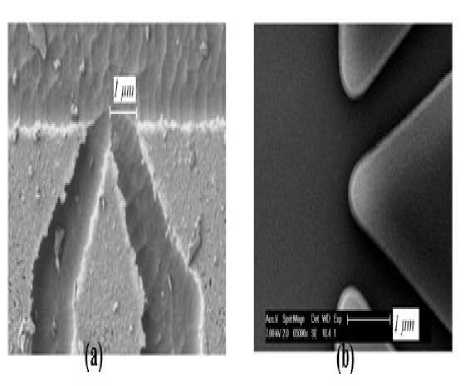
Fig.4 (a) Rough Image and (b) Smooth Image
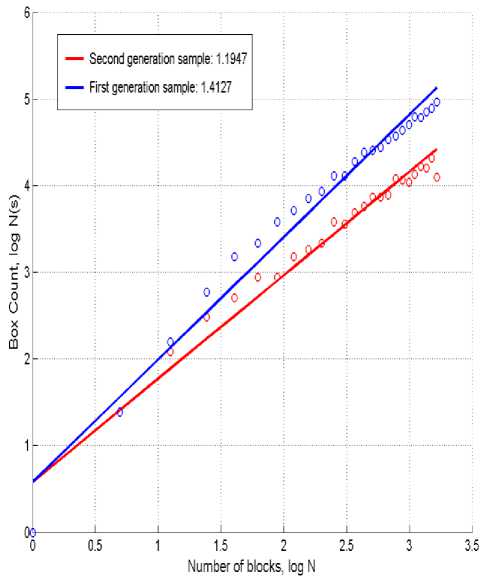
Fig.5. Graph for Hausdrop Fractal Dimension for the Fig. 4 Images.
To demonstrate this technique, two individual images are considered as shown in Fig. 4 (a) and (b). For image (a) shown in Fig. 4, Hausdrop fractal dimensions obtained is H.D1 =1.4127 and for image (b) shown in Fig. 4 is H.D2 =1.1947. This signifies that the image (b) shown in Fig. 4 has less rough than the image (a) shown in Fig. 4 by a factor of 0.8456. Fig. 5 Shows Hausdrop Dimension for image (a) and image (b) shown in Fig. 4
-
E. Region of Interest (ROI) Extraction
In this work, exact boundary of Optic Nerve Head (ONH) is extracted using MATLAB roipoly function. This function will identify a polygonal region of interest (ROI) surrounded by an object. It returns a binary image that can be used as a mask for masked filtering. BW = roipoly function generates an interactive polygon tool, associated with the image presented in the current object, called the target image. With the activation of polygon tool, the mouse pointer changes to cross hairs when mouse is moved over the image in the object. With help of mouse, user can specify the position of region of interest by selecting vertices of the polygon. This is done by clicking points in image with mouse. Once the user selects the vertices then roipoly generates the binary image of size same as the input image size. This binary image contains white pixels inside the polygon and black pixels everywhere else.
-
IV. Result and Analysis
Research was carried out for the efficient detection / identification of glaucoma in retinal images using image feature fractal dimension theory. In this work, Analysis and detection of glaucoma is illustrated on retinal images from publically available Optic disk website. Hausdrop fractal dimension method is used for the development of the algorithms to detect the glaucoma disease using the retinal images. Coding was done in Matlab®10. The images from the captured data set were given as the input to the programs, the code was run, simulations were performed and the results were noted. Lengthy discussions were made on the simulated results, compared and finally commented for their effectiveness and justification. The quantitative and qualitative results shown in this section depicts the effectiveness of the developed approach. Fig.6 describes the simulation result obtained for healthy retina. Fig. 6 (a) shows the healthy retina given as input to the software. Fig. 6 (b) shows the optic disk region marked by ophthalmologist. Fig. 6 (c) shows the region of optic disk obtained in binary form. Fig. 6 (d) shows the boundary of the optic disk obtained using matlab BM boundary function. Finally Fig. 6 (e) shows the fractal dimension estimated by computing slope. Slop is calculated by plotting graph, number of boxes versus box count. Fractal dimension obtained for this image is 0.9234.
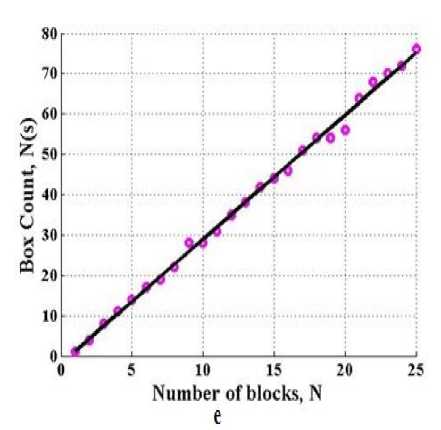
Fig.7. Simulation result of Glaucomatous retina. (a) Glaucomatous fundus Image, (b) Optic Disk marked by expert(Ophthalmologist), (c) Optic Disk region extracted, (d) perimeter of the Optic Disk and (e) Fractal Dimension Computed (FD=1.2334)
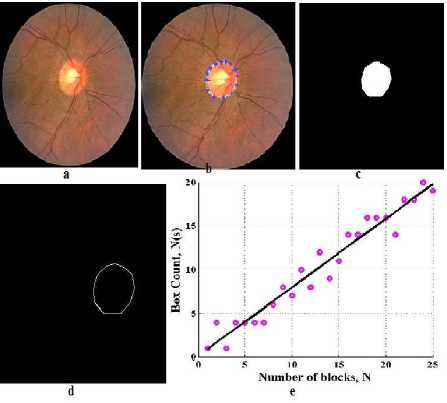
Fig.6. Simulation result of healthy retina. (a) Healthy fundus Image, (b) Optic Disk marked by expert(Ophthalmologist), (c) Optic Disk region extracted, (d) perimeter of the Optic Disk and (e) Fractal Dimension Computed(FD=0.9234)
Fig.7 describes the simulation result obtained for Glaucomatous retina. Fig. 7 (a) shows the Glaucomatous retina given as input to the software. Fig. 7 (b) shows the optic disk region marked by ophthalmologist. Fig. 7 (c) shows the region of optic disk obtained in binary form. Fig. 7 (d) boundary of the optic disk obtained using matlab BM boundary function. Finally Fig. 7 (e) shows the fractal dimension estimated by computing slope for plotting graph, number of boxes versus box count and Fractal dimension obtained is 1.2334.
The experiment was conducted by considering the healthy and glaucomatous optic disks from optic-disc.org. Totally 14 images were considered. Among these 7 were healthy optic disks and remaining 7 were glaucomatous optic disks. Table 1 and Table 2 illustrate fractal dimension values obtained for first seven images from the proposed approach for healthy and glaucomatous optic disks respectively.
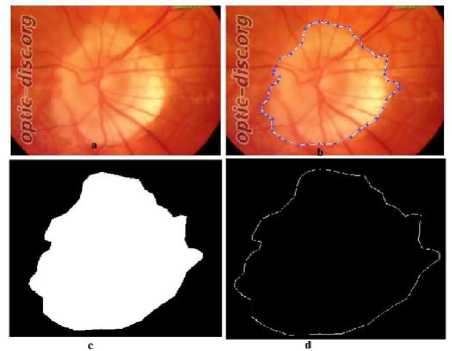
Table 1. Fractal Dimension Values Obtained For Healthy Optic Disks Marked By Three Ophthalmologists.
|
SL No |
Glaucoma optic Disk (Fractal Dimension) |
||||
|
Images |
Experts |
||||
|
A |
B |
C |
Avg |
||
|
1 |
G_1.jpg |
1.149 |
1.126 |
1.164 |
1.146 |
|
2 |
G_2.jpg |
1.193 |
1.213 |
1.218 |
1.208 |
|
3 |
G_3.jpg |
1.082 |
1.044 |
1.101 |
1.075 |
|
4 |
G_4.jpg |
1.131 |
1.126 |
1.115 |
1.124 |
|
5 |
G_5.jpg |
1.164 |
1.136 |
1.142 |
1.147 |
|
6 |
G_6.jpg |
1.164 |
1.202 |
1.913 |
1.183 |
|
7 |
G_7.jpg |
1.160 |
1.1104 |
1.1193 |
1.129 |
|
Total Average of Glaucoma retina |
1.316 |
||||
Table 2. Fractal Dimension Values Obtained For Glaucomatous Optic
|
SL No |
Healthy Optic Disk (Fractal Dimension) |
||||
|
Images |
Experts |
||||
|
A |
B |
C |
Avg |
||
|
1 |
H_1.jpg |
1.098 |
1.0871 |
1.123 |
1.102 |
|
2 |
H_2.jpg |
1.063 |
1.082 |
1.052 |
1.065 |
|
3 |
H_3.jpg |
0.946 |
0.987 |
0.864 |
0.932 |
|
4 |
H_4.jpg |
0.954 |
0.995 |
0.864 |
0.937 |
|
5 |
H_5.jpg |
0.954 |
0.995 |
0.864 |
0.937 |
|
6 |
H_6.jpg |
0.993 |
0.976 |
0.977 |
0.982 |
|
7 |
H_7.jpg |
1.008 |
1.018 |
0.990 |
1.005 |
|
Total Average of Healthy retina |
0.994 |
||||
-
V. Conclusion
Glaucoma is a second largest eye disease in the worldwide. Early detection of glaucoma plays the major role in prevision of vision loss. In this work, a novel approach has been developed for identification of glaucoma using Hausdrop fractal dimension. This method make uses optic disk perimeter as new clinical parameter for the diagnosis of the disease. The boundary of the optic nerve head is obtained through MATLAB roiply function. Later, Hausdrop fractal dimension is obtained to classify the healthy and glaucomatous eyes. It is higher for glaucoma affected optic nerve head perimeter and lesser for healthy optic disk perimeter parameter. Because, healthy optic disk perimeter parameter is more smoothen as compared to glaucoma affected. This obeys the theory of fractal dimension. In the future work, this method can be further enhanced for automated detection by introducing robust and generalized optic disk segmentation algorithm.
References A Novel Approach for Diagnosis of Glaucoma through Optic Nerve Head (ONH) Analysis using Fractal Dimension Technique
- Kolář, R., and P. Vacha. "Texture analysis of the retinal nerve fiber layer in fundus images via Markov random fields." World Congress on Medical Physics and Biomedical Engineering, September 7-12, 2009, Munich, Germany. Springer Berlin Heidelberg, 2009.
- Mishra, Madhusudan, Malaya Kumar Nath, and Samarendra Dandapat. "Glaucoma detection from color fundus images." International Journal of Computer & Communication Technology (IJCCT) 2.6 (2011): 7-10.
- Patton, Niall, et al. "Retinal image analysis: concepts, applications and potential." Progress in retinal and eye research 25.1 (2006): 99-127.
- Naz, Sobia, and Sheela N. Rao. "Glaucoma Detection in Color Fundus Images Using Cup to Disc Ratio." The International Journal of Engineering and Science (IJES) Vol 3: 51-58.
- Raj, Veena, and Vidya Devi. "Retinal Image Analysis Using Fovea Detection using Unsymmetrical Trimmed Median Filter (MDBUTMF)."
- Thorat, Sushma G. "Automated Glaucoma Screening using CDR from 2D Fundus Images." Editorial Committees.
- Ni, Soe Ni, PinaMarzilianol, and Hon-Tym Wong. "Angle closure glaucoma detection using fractal dimension index on SS-OCT images." Engineering in Medicine and Biology Society (EMBC), 2014 36th Annual International Conference of the IEEE. IEEE, 2014.
- Zhang, Xusheng, et al. "Automated segmentation of intramacular layers in Fourier domain optical coherence tomography structural images from normal subjects." Journal of biomedical optics 17.4 (2012): 0460111-0460117.
- Bock, Rüdiger, et al. "Glaucoma risk index: automated glaucoma detection from color fundus images." Medical image analysis 14.3 (2010): 471-481.
- Burana-Anusorn, Chalinee, et al. "Image Processing Techniques for Glaucoma Detection Using the Cup-to-Disc Ratio." Thammasat International Journal of Science and Technology 18.1 (2013): 22.
- Meier, Jörg, et al. "Effects of preprocessing eye fundus images on appearance based glaucoma classification." Computer Analysis of Images and Patterns. Springer Berlin Heidelberg, 2007.
- Byahatti, Archana Nandibewoor SB Kulkarni Sridevi, and Ravindra Hegadi. "Computer Based Diagnosis of Glaucoma using Digital Fundus Images."Proceedings of the World Congress on Engineering. Vol. 3.2013.
- Patil, Dnyaneshwari D., Ramesh Manza, and Gangadevi C. Bedke. "Diagnose Glaucoma by proposed Image processing Methods." International Journal of Computer Applications 106.8 (2014).
- Malay Kishore Dutta, Amit Kumar Mourya, Anushikha Singh, M.Parthasarathi, "Glaucoma Detection by Segmenting the Super Pixels from Fundus Colour Retinal Images", IEEE, International Conference on Medical Imaging, m-Health and Emerging Communication Systems (MedCom), 2014.
- Hafsah Ahmad, Abubakar Yamin, Aqsa Shakeel, "Detection of Glaucoma Using Retinal Fundus Images", IEEE, the 2013 Biomedical Engineering International Conference (BMEiCON-2013).
- Hafsah Ahmad, Abubakar Yamin, Aqsa Shakeel, "Detection of Glaucoma Using Retinal Fundus Images", IEEE, the 2013 Biomedical Engineering International Conference (BMEiCON-2013).
- S.Kavitha, S.Karthikeyan, Dr.K.Duraiswamy, "Neuroretinal rim Quantification in Fundus Images to Detect Glaucoma", IJCSNS International Journal of Computer Science and Network Security, VOL.10 No.6, June 2010.
