A Novel Approach in Determining Areas to Lockdown during a Pandemic: COVID-19 as a Case Study

Author: Md. Motaleb Hossen Manik
Journal: International Journal of Information Engineering and Electronic Business @ijieeb
Article in issue: 2 vol.15, 2023.
Free access
In December 2019, the Novel Coronavirus became a global epidemic. Because of COVID-19, all ongoing plans had been postponed. Lockdowns were imposed in areas where there was an excessive number of patients. Constantly locking down areas had a significant negative influence on the economy, particularly on developing and underdeveloped countries. But the majority of countries were locking down their areas without making any assumptions where some were successful and some were failures. In this situation, this paper presents a novel approach for determining which parts of a country should be immediately placed under lockdown during any pandemic situation while considering the lockdown history at the time of COVID-19. This work makes use of a self-established dataset containing data from several countries of the world and uses the successful presence of lockdown in that area as the target attribute for machine learning algorithms to determine the areas to keep under lockdown in the future. Here, the Random Forest algorithm has provided the highest accuracy of 92.387% indicating that this model can identify the areas with an impressive level of accuracy to retain under lockdown.
Pandemic, lockdown, coronavirus, machine learning, prediction
Short address: https://sciup.org/15018865
IDR: 15018865 | DOI: 10.5815/ijieeb.2023.02.04
Text of the scientific article A Novel Approach in Determining Areas to Lockdown during a Pandemic: COVID-19 as a Case Study
Published Online on April 8, 2023 by MECS Press
Coronavirus disease (COVID-19) is an infectious disease caused by a coronavirus that was discovered in 2019 [1]. It was originally detected in Wuhan, Hubei, China [2] in December 2019. On November 17, 2019, the first confirmed case was discovered in Hubei [2].
A coronavirus is a virus that causes severe acute respiratory syndrome (SARS) and is known as SARS-CoV [3]. The novel coronavirus strain is thought to have originated in bats or pangolins, according to many health specialists [3]. Fever, tiredness, cough, and shortness of breath are all common symptoms of this illness. Loss of smell and taste are two new symptoms that have recently been discovered. Until June 2022, about 553 million confirmed cases were found, with 528 million patients recovered and 6.3 million deaths [4]. To stop the spread of coronavirus, various protective measures were suggested. The essential precautions were to wash hands, keep a safe distance, use masks, stay at home, and avoid touching eyes, nose, and mouth. Different areas of the world were being kept under lockdown indefinitely to keep people at home and preserve social distance. Without a doubt, the world economy was ruined by this seizure [5]. However, most areas were being enclosed without undertaking any statistical analysis, which was putting more pressure on the population of that region. People were losing their jobs, and those who were not being paid off were unable to attend office [5]. According to the International Monetary Fund (IMF), the number of citizens out of work in the United States had increased from 3.7 percent to 10.4 percent [6], which was a cause for alarm. According to their infected, death, and recovered patients, some locked-down regions should not be taken under lockdown, and even Sweden fought the coronavirus without any lockdown [7]. Though some benefits of lockdown have been mentioned in [8], still lockdown was not an ultimate solution for many regions of the world.
Over 1,780,000 articles have been published on the COVID-19 issue during the pandemic. Forecasting, Diagnosis, Environmental Dependencies, Surveys, and Screening are the most common uses for machine learning-based models [9, 10, 11]. Almost every article has focused on how to set up a lockdown and how to fix this issue. As a result, there are few machine learning models on how and where to set lockdown during any pandemic. Hence, this paper deals with the major objective of providing a novel approach for deciding which regions of a country should be immediately kept under lockdown during any pandemic while taking into account the lockdown perspective during COVID-19.
The rest of the paper is organized as follows: Section II discusses the literature review. The materials and methods of this work are explained in Section III. The result analysis and discussions are presented in section IV. Finally, section V concludes the paper.
2. Literature Review
A. Cole et el. [12] have proposed two steps-based models for determining the impact of lockdown where the first step uses machine learning and the second step uses the Augmented Synthetic Control Model. Their full system reveals the impact of lockdown on air pollution and Health. They have indicated that the reduction of the concentration of NO2 could have saved 10,822 deaths in China. But their model does not provide any suggestion on whether to set a lockdown or not. E. Alvarez et el. [13] have suggested a SIR epidemiology model (Susceptible (S), Infectious (I), and Recovered (R)) that controls the fatalities by minimizing the cost of the lockdown. Still, the authors could not provide any solution on which areas should be taken under lockdown.
3. Materials and Methods
Another work on the lockdown’s impact in Wuhan has been carried out in [14]. The authors have analyzed the data collected from the local and international stage to demonstrate the positive impact as a result of the lockdown. The suggested model has measured a scenario of COVID-19 cases before and after setting the lockdown. Their findings have suggested that the outbreak of COVID-19 had almost diminished within 2 to 4 days after imposing a lockdown throughout China. But their model could not introduce any way to enforce lockdown for any specific region.
More specific work has been conducted in [15] to identify the effect of the lockdown during COVID-19 in Germany. The authors have utilized rich data collected from a German helpline service center. They have targeted determining the mental and health-related issues or contacts during the lockdown. Their findings have indicated that the helpline contacts raised by almost 20% in the first week of lockdown while decreasing after the third week. They have concluded that the help-seeking was due to loneliness, anxiety, and suicidal ideation rather than any financial problem. But in the end, their model could not suggest any solution to reduce the lockdown duration or determine any area to release the lockdown.
A similar kind of works have been proposed in [16-18] while targeting finding the mental health condition of young people, adult people, and students, respectively during the lockdown. Authors of [16] have carried out their study on 389 young people while throwing multiple questionaries towards them. They have concluded that most of them suffered from depression which is 55% higher than the pre-pandemic situation. On the other hand, authors of [17] have conducted their study on 100 participants while targeting six factors namely, family, sleeping problems, worrying about the future, anger, lack of emotional support, and fear of receiving bad news. The authors have resulted that the participants showed a level of stress and anxiety of 90%, 86%, 85%, 83%, 79%, and 72%, respectively for those six factors. The authors of [18] have focused on the mental health indicators and social network interactions of students during the pandemic. They have concluded that almost 39.2% of students became victims of the lockdown. Though these studies included the impact of lockdown on a variety of people, still could not provide any solution for determining the areas to keep under lockdown during any pandemic.
In this situation, an architecture is required to determine which areas should be placed under lockdown and which should not, considering any epidemic condition. To achieve so, this paper considers the lockdown history of the COVID-19 pandemic. Based on this consideration, the author proposes Machine learning-based approach to find out a solution in determining the areas to put under lockdown. Initially, a dataset was employed that included the name of the region, information on infected, death, and recovered patients, the area of the particular region, the population of the region, and lastly the successful existence of lockdowns in those places during the COVID-19 pandemic. Areas having a presence of successful lockdown have been labeled with a 1 and those without have been labeled with a 0. Finally, several Machine learning algorithms have been applied to them to determine whether or not to keep the lockdown.
This section provides a detailed overview of the proposed architecture in four subsections. Fig.1. shows the system model of this novel approach. Here, a dataset has been employed by collecting data from several countries and the successful presence of lockdown in those areas has been set as the target attribute for the machine learning algorithms. Then the machine learning algorithms are applied to the dataset to determine the areas which should be kept under lockdown to stop the spread of any pandemic.
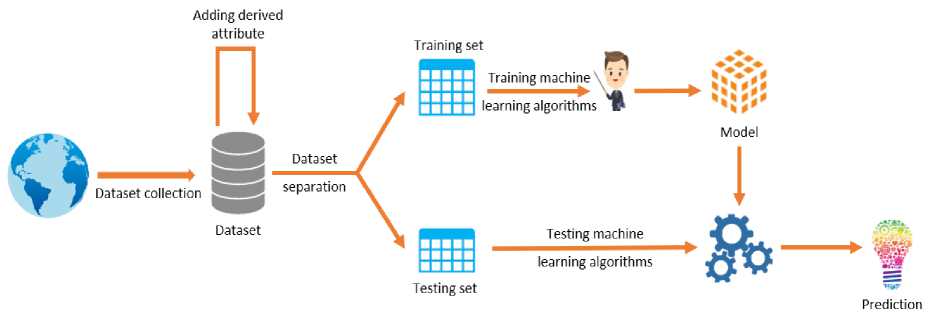
Fig. 1. System model of the proposed architecture
-
A. Data Collection
The dataset has been created manually by collecting data from [4] since the necessary dataset is novel in terms of the prediction task. The dataset has been created using statistics from several regions of the world. The produced dataset has seven features, including i) the name of the region, ii) the number of infected, iii) death, iv) recovered patients in that region, v) the population, and vi) the area of that region and vii) the target feature, which is the successful presence of lockdown on that region. The data in the dataset contains 10000 data entries till July 2022 assembled from 100 different countries. Table 1 shows the sample dataset with seven features. Moreover, the raw data has been checked multiple times to remove duplicate ones.
Table 1. Sample dataset
|
Region Name |
Infected |
Deaths |
Recovered |
Area |
Population |
Success/Failure |
|
Arizona |
79215 |
1632 |
9715 |
113990 |
7278717 |
success |
|
Colorado |
30705 |
16510 |
4502 |
104093 |
5758736 |
failure |
|
Delhi |
118645 |
3545 |
97693 |
1484 |
18980000 |
success |
-
B. Dataset Preparation
Since the numerical numbers used for the attributes are huge, processing them takes a long time. That is why they must be normalized and maintained at a value between 0 and 1. Here, min-max (min = 0 and max = 1) normalization has been applied to perform data normalization. Some derived attributes have been recalculated from the single-valued attributes because the dataset was manually collected by the author. For example, the Density , DtoInf , and RtoInf attributes were calculated from currently present attributes ( area, population, infected, death, and recovered patients ) from the dataset where they refer to the ratio of people to the area of a certain locality ( Density = Population/Area ), the ratio of death patients to infected patients ( DtoInf = Death/Infected ), and the ratio of recovered patients to infected patients ( RtoInf = Recovered/Infected ), respectively. Finally, the target attribute has been converted to 1 and 0 based on the success or failure of the lockdown, respectively. The success and failure have been assigned based on the investigation [19] of the success rate of lockdown in a specific area. The dataset contains an equal number of samples (5000 and 5000) for these two classes (success and failure) to remove biasedness. Table 2 represents the mid version of the dataset after inserting the derived attributes.
Table 2. Derived dataset
|
Region Name |
Infected |
Death |
Recovered |
Area |
Population |
Success/Failure |
DtoInf |
RtoInf |
Density |
|
Arizona |
79215 |
1632 |
9715 |
113990 |
7278717 |
1 |
0.0206 |
0.122 |
63.853 |
|
Colorado |
30705 |
16510 |
4502 |
104093 |
5758736 |
0 |
0.538 |
0.116 |
55.322 |
|
Delhi |
118645 |
3545 |
97693 |
1484 |
18980000 |
1 |
0.029 |
0.823 |
12798.38 |
-
C. Dataset Separation
The modeling of a prediction algorithm demands some predefined data. Most often, the majority of data from the dataset is used to train the model, while the rest is used to test the model. The dataset used in this proposed architecture has been initially divided into 70/30 percent measurements for training and testing, respectively. However, these percentages have been tuned numerous times with shuffled data each time, and the portion of the dataset that has been included previously has not been used again to achieve randomness.
-
D. Machine Learning Algorithms
One of the prominent disciplines of artificial intelligence (AI) is machine learning (ML), and it is due to its algorithms through which AI has progressed. Its applications are spread from prediction to classification in the fields of humanitarian aid to medical discipline. Prediction can be done through a variety of machine learning algorithms. The entire proposed architecture has been developed using five different machine learning algorithms. They are explained as follows.
-
1) Logistic Regression
One of the famous machine learning algorithms is Logistic Regression (LR) which is frequently used for classifying binary datasets with yes/no events. Considering an example of a dataset containing statistics about patients' COVID-19 infection status. Since there are just two possible outcomes in this scenario, whether a patient is infected or not, LR does well with this type of case. Contrary to linear regression, the outcome of LR is limited to a small number since it does not hold the behavior of continuous value as the outcome [20]. Hence, the following equation is used for LR tasks.
log(-y = p0+p (1)
Since the dataset of the proposed architecture contains the target feature as success (1) or failure (0) which can be referred to as a binary classification, one of the categories of LR namely, Binary Logistic Regression (BLR) has been used to predict the outcome.
-
2) Support Vector Machine
Support Vector Machine (SVM) is a well-known machine learning algorithm that can be used for both classification and regression. The basic idea in SVM is to build hyperplanes in the data space that can be used to split a dataset into the required classes. To split the dataset, two hyperplanes are constructed and the ultimate target is to optimize the distance between them. For higher-dimensional data, the kernel trick [21] is used to convert them into an acceptable format, making the classification task easier. One of the kernel trick equations is as follows:
K(x,z) =< 0(x),0(z) > (2)
where the data points are x,z € X, and a map is 0: X ^ ^ .
Since, in the proposed architecture’s dataset, there are one target attribute and three variables ( DtoInf , RtoInf, and Density ), based on these three variables, two classes of the target attribute have been predicted, namely whether lockdown should be applied or not.
-
3) K-Nearest Neighbor
K-Nearest Neighbor (KNN), one of the most prominent supervised machine learning algorithms, renders the use of the similarity-based classification technique. This method assigns the newly incoming data points to any class depending on how closely they reflect the existing data points by applying the following equation:
Dj(x.v. гЛ ■ (3)
This approach can be used for regression and classification tasks, simultaneously while the second one is typically used most. KNN is known as a non-parametric algorithm and a lazy learner algorithm since it makes no assumptions about the underlying data and does not immediately apply how much it has learned from the validation set to the newly arrived data points, respectively. In this proposed architecture, the KNN algorithm has worked admirably and finally achieved the highest accuracy for 26 neighbors.
-
4) Decision Tree
Another commonly used machine learning algorithm is the Decision Tree (DT), which is a tree-structured classifier. Morally, the internal nodes of the tree represent the dataset's used features, while the adjacent branches indicate the rules for deciding which path the algorithm should take to reach the target. The leaf nodes are the actual decisions that follow the decision branches from the root to the leaf. There are several methods for constructing a decision tree, but the basic idea is calculating entropy and information gain, or the Gini index. The path with higher information gain or a lower Gini index is chosen as a feature node. This proposed architecture has established a DT with 22 leaf nodes which are the target for the decision placement in lockdown settling.
-
5) Random Forest
Random Forest (RF), like the other mentioned algorithms, is a spectacular classification algorithm based on the ensemble learning method. A combination of decision trees can be used to define an RF. The theory behind RF is that a collection of advisors' decisions is better than a single decision. Here, multiple decision trees are used to draw a final decision. Initially, the dataset is divided into sub-datasets and each decision tree is given a sub-dataset to work with. Finally, the decisions for a particular data are submitted to a voting method. Among multiple voting mechanisms, average voting is the most commonly used voting mechanism, which averages the decisions made by different decision trees. In this proposed architecture, multiple trees have been generated to achieve a better result, and hence the maximum result has been achieved with 24 trees, and they are referred to as n_estimators. Like DT, RF calculates the importance of a feature by applying the following equation.
RF fi t =
I € all trees "orm fitj T
Here, each term can be defined as follows.
• RF fit = the importance of the feature from all trees
• norm fitj = the normalized feature importance for i in tree j
• T = total number of trees
4. Result Analysis and Discussions
-
A. Experimental Measurements
The experimental result has been carried out on the dataset that has been discussed earlier. From the dataset, 70% of the data has been used for the training purpose of the algorithms and the rest has been reserved for testing the model. The performance measurements of the proposed architecture have been reported based on precision, recall, f1-score, and accuracy on both the training and testing set.
-
B. Experimental Setup
In this research, five major machine learning algorithms have been applied, namely Logistic Regression (LR), Support Vector Machine (SVM) K-Nearest Neighbor (KNN), Decision Tree (DT), and Random Forest (RF). All the algorithms have been run on Kaggle online platform with Python language. The experiment has been conducted on a Desktop machine (CPU: Intel Core i5 @ 3.10 GHz and RAM: 12 GB) in Windows 11 OS environment.
-
C. Performance Evaluation
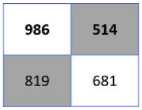
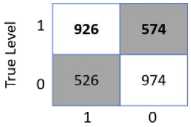
The performance of the proposed architecture has been evaluated from different angles. Fig.2. presents the confusion matrices of five machine learning algorithms with their highest accuracy for three different percentages of testing data (20%, 25%, or 30%) as of table 4. From the figure, it is observed that the Random Forest (RF) algorithm is outperforming the rest of the algorithms. Though LR is more accurately classifying the data of the first class but fails to classify the data of the second class thus showing a fall in accuracy to 55.56%. Hence, RF is the best performer to finalize the areas which should be kept under lockdown.
о
>
Predicted Level
(a) LR
> Си
|
892 |
60S |
|
696 |
804 |
Predicted Level
(b) SVM
Predicted Level
(c) KNN
|
1253 |
247 |
|
315 |
1185 |
1 0
Predicted Level
|
1407 |
93 |
|
135 |
1365 |
1 0
Predicted Level
(d) DT
(e) RF
Fig. 2. Confusion matrices of machine learning algorithms
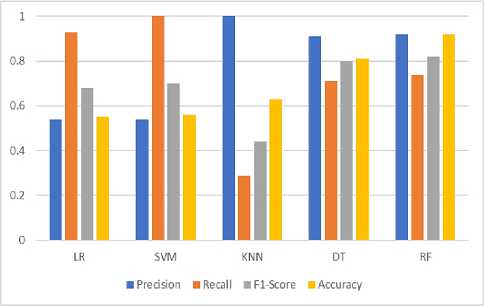
Fig. 3. Matric comparison of machine learning algorithms
Fig.3. represents the comparison of precision, recall, f1-score, and accuracy of the five algorithms where RF is topping the board again. Even though in some instances, other algorithms are producing impressive results, RF is still considered superior to them in terms of overall measurement.
Table 3 illustrates the accuracy values of the applied algorithms on both the training set and testing set. It is observed that most of the algorithms except SVM perform well enough on the training set. But RF shows better comparative results on the training set and testing set.
Table 3. Accuracy comparison on training/testing set
|
SL. |
Algorithm Testing Set Training Set Name Accuracy Accuracy |
|
1 |
LR 0.55 0.60 |
|
2 |
SVM 0.56 0.52 |
|
3 4 |
KNN 0.63 0.84 DT 0.81 0.99 |
|
5 |
RF 0.92 0.98 |
There is an impact of the size of the training and testing set on the accuracy of a machine learning algorithm. Table 4 represents the comparison of accuracy for the mentioned machine learning algorithms by varying the size of the training and testing set. From this table, it is observed that the maximum accuracy achieved for RF in the case of <70/30> indicating that the moderate training set can provide a better result. Other algorithms like LR, SVM, and KNN are showing their best result in different cases.
Table 4. Accuracy comparison by varying training/testing set size
|
Training/Testing Set Size |
Algorithm |
Accuracy (%) |
|
70/30 |
LR |
55.566 |
|
SVM |
56.522 |
|
|
KNN |
63.333 |
|
|
DT |
81.245 |
|
|
RF |
92.387 |
|
|
75/25 |
LR |
60.870 |
|
SVM |
56.522 |
|
|
KNN |
65.217 |
|
|
DT |
78.261 |
|
|
RF |
86.957 |
|
|
80/20 |
LR |
38.889 |
|
SVM |
55.556 |
|
|
KNN |
66.667 |
|
|
DT |
77.778 |
|
|
RF |
72.222 |
From the above scenarios, it has been observed that the RF algorithm outperforms other algorithms in every possible cases. For the case of <70/30>, RF has displayed a maximum accuracy of 92.387% with an n_estimator value of 24. By varying the value of n_estimator, the accuracy of RF can be varied also. Initially, the accuracy was increasing periodically, but as soon as the n_estimator’s value reached 24, the accuracy started to decrease and finally saturated at a level. Fig.4. illustrates the accuracy measurement of RF for different cases of n_estimator that ensures that a balanced n_estimator’s value can generate a better result.
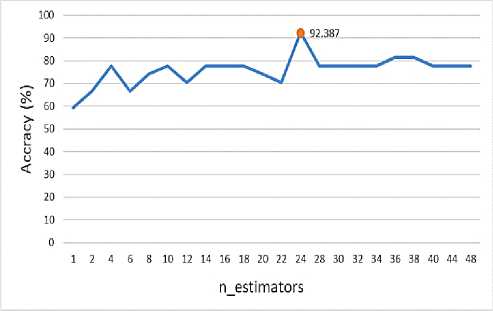
Fig. 4. Accuracy measurement of RF in different n_estimators’ value
This proposed architecture provides an impressive result for different aspects of performance evaluation. Finally, table 5 represents a comparative study of this proposed architecture with a recent existing framework developed in [22]. The proposed architecture provides more standard datasets, and usability than [22] and has a better comparative result than it in different aspects that declare the reliability of the proposed approach.
Table 5. A comparative study of proposed architecture with [22]
Aspects
[22] Proposed Architecture
|
Dataset |
Local |
Global |
|
ML Algorithms |
SVM, DT, RF |
LR, KNN, SVM, DT, RF |
|
Usability in Future |
Not available |
Available |
|
Training/Testing Set |
No |
Yes |
|
Comparison |
5. Conclusion
Since several countries updated their lockdown mechanisms during the coronavirus outbreak, some did so successfully and some did not. This proposed architecture determines precisely the regions to lock down in any pandemic event taking into account the history of lockdowns during COVID-19. In this paper, measurements from different angles have been shown while considering precision, recall, f1-score, and accuracy, varying the training and testing set size, etc. These measurements ensure the advancement of this work more than the previous ones and indicate the justification of this work. Since the Random Forest (RF) algorithm employs multiple voting mechanisms from several trees, it has produced more impressive results than the rest of the algorithms. Though the author has attempted to cover all the aspects of this issue through the proposed architecture, there are still certain areas where it can be refined in the future.
Statements and Declarations
Funding
This research is not funded by any organization.
Conflict of Interest
The author declares no conflict of interest.
References A Novel Approach in Determining Areas to Lockdown during a Pandemic: COVID-19 as a Case Study
- “Coronavirus.” https://www.who.int/health-topics/coronavirus#tab=tab_1 (accessed Jul. 01, 2022).
- “COVID-19 - Wikipedia.” https://en.wikipedia.org/wiki/COVID-19 (accessed Jul. 01, 2022).
- “Coronavirus (COVID-19) origin: Cause and how it spreads.” https://www.medicalnewstoday.com/articles/coronavirus-causes (accessed Jul. 01, 2022).
- “COVID Live - Coronavirus Statistics - Worldometer.” https://www.worldometers.info/coronavirus/ (accessed Jul. 01, 2022).
- “The great lockdown: was it worth it? CEPS Policy Insights No 2020-11 / May 2020 - CORE Reader.” https://core.ac.uk/reader/322823610 (accessed Jul. 01, 2022).
- “IMF and Covid-19.” https://www.imf.org/en/Topics/imf-and-covid19 (accessed Jul. 02, 2022).
- “Sweden Faces Coronavirus Without Lockdown - The New York Times.” https://www.nytimes.com/2020/04/28/world/europe/sweden-coronavirus-herd-immunity.html (accessed Jul. 01, 2022).
- D. Ding, B. del Pozo Cruz, M. A. Green, and A. E. Bauman, “Is the COVID-19 lockdown nudging people to be more active: a big data analysis,” Br J Sports Med, vol. 54, no. 20, pp. 1183–1184, Oct. 2020, doi: 10.1136/BJSPORTS-2020-102575.
- D. Liu et al., “A machine learning methodology for real-time forecasting of the 2019-2020 COVID-19 outbreak using Internet searches, news alerts, and estimates from mechanistic models,” ArXiv, Apr. 2020, doi: 10.48550/arxiv.2004.04019.
- N. Singh, P. · Sanjay, K. Sonbhadra, S. Agarwal, and S. K. Sonbhadra, “COVID-19 Epidemic Analysis using Machine Learning and Deep Learning Algorithms,” medRxiv, p. 2020.04.08.20057679, Jun. 2020, doi: 10.1101/2020.04.08.20057679.
- M. M. Rahman et al., “Machine Learning Approaches for Tackling Novel Coronavirus (COVID-19) Pandemic,” SN Computer Science 2021 2:5, vol. 2, no. 5, pp. 1–10, Jul. 2021, doi: 10.1007/S42979-021-00774-7.
- M. A. Cole, R. J. R. Elliott, and B. Liu, “The Impact of the Wuhan Covid-19 Lockdown on Air Pollution and Health: A Machine Learning and Augmented Synthetic Control Approach,” Environ Resour Econ (Dordr), vol. 76, no. 4, pp. 553–580, Aug. 2020, doi: 10.1007/S10640-020-00483-4/TABLES/7.
- “A Simple Planning Problem for COVID-19 Lockdown.” https://ideas.repec.org/p/nbr/nberwo/26981.html (accessed Jul. 01, 2022).
- H. Lau et al., “The positive impact of lockdown in Wuhan on containing the COVID-19 outbreak in China,” J Travel Med, vol. 27, no. 3, pp. 1–7, May 2020, doi: 10.1093/JTM/TAAA037.
- S. ; Armbruster and V. Klotzbücher, “Lost in lockdown? COVID-19, social distancing, and mental health in Germany,” 2020, Accessed: Oct. 22, 2022. [Online]. Available: https://www.econstor.eu/handle/10419/218885
- M. Owens, E. Townsend, E. Hall, T. Bhatia, R. Fitzgibbon, and F. Miller-Lakin, “Mental Health and Wellbeing in Young People in the UK during Lockdown (COVID-19),” International Journal of Environmental Research and Public Health 2022, Vol. 19, Page 1132, vol. 19, no. 3, p. 1132, Jan. 2022, doi: 10.3390/IJERPH19031132.
- S. Agha, “Mental well-being and association of the four factors coping structure model: A perspective of people living in lockdown during COVID-19,” Ethics Med Public Health, vol. 16, p. 100605, Mar. 2021, doi: 10.1016/J.JEMEP.2020.100605.
- T. Elmer, K. Mepham, and C. Stadtfeld, “Students under lockdown: Comparisons of students’ social networks and mental health before and during the COVID-19 crisis in Switzerland,” PLoS One, vol. 15, no. 7, p. e0236337, Jul. 2020, doi: 10.1371/JOURNAL.PONE.0236337.
- S. Kharroubi and F. Saleh, “Are Lockdown Measures Effective Against COVID-19?,” Front Public Health, vol. 8, p. 610, Oct. 2020, doi: 10.3389/FPUBH.2020.549692/BIBTEX.
- L. Zhao, Y. Chen, and D. W. Schaffner, “Comparison of Logistic Regression and Linear Regression in Modeling Percentage Data,” Appl Environ Microbiol, vol. 67, no. 5, pp. 2129–2135, May 2001, doi: 10.1128/AEM.67.5.2129-2135.2001/ASSET/43FD1C24-FD3C-4FD5-8667-38A7AFA5FEEC/ASSETS/GRAPHIC/AM0511815005.JPEG.
- A. Patle and D. S. Chouhan, “SVM kernel functions for classification,” 2013 International Conference on Advances in Technology and Engineering, ICATE 2013, 2013, doi: 10.1109/ICADTE.2013.6524743.
- M. H. Manik, “Noble Machine Learning Approaches for Lock Downing Area during Coronavirus (COVID-19) Pandemic Waves,” American Journal of Computer Science and Information Technology, vol. 9, no. 8, Aug. 2021, doi: 10.36648/2349-3917.21.9.107.
