A Novel Approach to Diagnose Diabetic Retinopathy

Author: Dharmanna Lamani, T C Manjunath, Mahesh M, Y S Nijagunaraya
Journal: International Journal of Image, Graphics and Signal Processing(IJIGSP) @ijigsp
Article in issue: 7 vol.7, 2015.
Free access
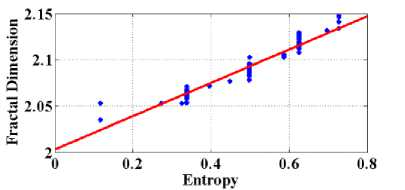
Early identification of diabetic retinopathy is highly beneficial for preventing the progression of disease. Appearance of blood vessels & retinal surface is a good ophthalmological sign of diabetic retinopathy in fundus images. In this paper, a novel method involving two approaches has been proposed for diagnosis of diabetic retinopathy. The first approach deals with estimation of fractal dimension of lesions by applying power spectral fractal dimension algorithms. For healthy retinas, fractal dimensions are found to be in the range of 2.00 to 2.069, whereas for retinas with diabetic retinopathy, fractal dimensions exceed upper limit. In the second approach, Gray Level Co-occurrence Matrix method is used to analyze the extracted regions from healthy and diabetes affected fundus retinal images. Texture features such as entropy & contrast are computed for healthy and unhealthy regions. These texture features are compared with fractal dimensions. The authors observed positive correlation between entropy and fractal dimensions, whereas negative correlation with contrast and fractal dimensions. Detailed implementations of the proposed work are presented.
Diabetic Retinopathy, Fractal Dimension, Entropy, Gray Level Co-occurrence Matrix
Short address: https://sciup.org/15013886
IDR: 15013886
Text of the scientific article A Novel Approach to Diagnose Diabetic Retinopathy
Published Online June 2015 in MECS DOI: 10.5815/ijigsp.2015.07.02
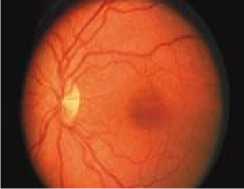
During image formation in human eye, reflected light from the object falls on retina through lens structure. The receptor and neural cells send these image signals in the form of electrical signals to brain for image perception. Such an elevated cellular activity in retinal tissue requires lot of oxygen supply. Because of this the retinal tissue is highly vascularized with many tiny blood vessels supplying nourishment. Hence, study of geometric description of vasularization of retina is of great importance to understand and treat many diseases related to eye. Diabetic retinopathy is a condition occurring in individuals associated with diabetes, which causes damage of retina progressively. The blood vessels that nourish retina is damaged due to prolonged and uncontrolled diabetes, finally leading to diabetic retinopathy. These impaired blood vessels leak blood and other fluids that cause swelling of retinal tissue and clouding of vision. Background or NonProliferative Diabetic Retinopathy (NPDR) and Proliferative Diabetic Retinopathy (PDR) are the two types of diabetic retinopathy. NPDR results in a variety of diseased conditions in eye which includes microaneurysms, retinal hemorrhages, hard exudates, macular edema and macular ischemia. PDR results in vitreous hemorrhage, traction retinal detachment and neovascular glaucoma. Such conditions usually affect both eyes causing blindness, if left untreated.
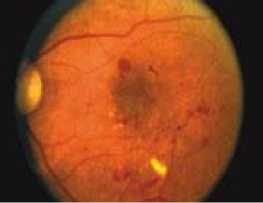
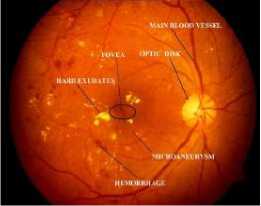
Microaneurysms are the small bulges in blood vessels of retina that often leak fluid. The tiny spots of blood due to leakage into the retina cause retinal haemorrhages. Also, deposition of cholesterol and other fats from blood leakage causes hard exudates. The early detection of such diseased conditions through analysis of retinal images may prevent blindness. Advancements in retinal imaging technologies have provided researchers and clinicians an upper hand in the diagnosis of retinal diseases. In the present work, fractal dimension has been employed as a useful parameter.
Fractal is an object having two properties: selfsimilarity and fractal dimension [14]. If the object is exactly similar to itself when scaled down or scaled up, then such a property of the object is called self-similarity. On the other hand fractal dimension is nothing but self-similar dimension, D, and is given by the expression
D = log(N r ) ̸ log(1/r)
where Nr is the number of self-similar objects when the object is scaled down by ratio r .
Fractal dimension (FD) has its significance in various applications including image processing. It is an ideal tool to measure the roughness/ texture of a digital image [17].
-
A. Literature review
To characterise the irregular patterns of blood vessels in diabetic affected retina, Box Counting method was used to estimate the fractal dimension [19]. It was concluded by Nazneen Akhter et.al, that, as the complexity of structure of a diabetic retina increases, fractal dimension also increases. But, a baseline or a threshold value of the fractal dimension was not declared so that a retina could be classified as diabetic or not. This lacuna was taken into account for the present research work. Higuchi’s Fractal Dimension was measured in circumferential direction (FDC) with respect to Optic Disk (OD), in three concentric regions between OD boundary and 1.5 OD diameters from its margin.This estimation was used as a stroke prediction marker [7]. Other method used to estimate fractal dimension include sandbox method which shows its inefficiency in case of inhomogeneity retinal structure [20].The geometric parameters of diabetic retina like central retinal arteriolar and venular equivalents (CRAE, CRVE), fractal dimension, length-diameter ratio, branching angle and curvature tortuosity were assessed by Myra Poon et.al [5]. These parameters were compared with healthy retinal images without vitamin D deficiency. The authors concluded that diabetic retinopathy is associated with high central retinal venular equivalents in diabetic persons.
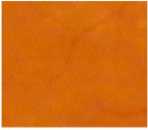
(a)
(b)
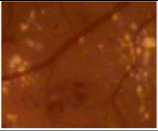
(c)
Fig.1. (a) Healthy retina, (b) retina showing signs of diabetic retinopathy, and (c) Retina with component labeling
The colfilt filter was used by Chandrashekar M patil [8] to extract features from retinal images like blood vessels, exudates and microaneurysms. Then area of each feature was determined to classify the severity of disease. Geometric features and correlations were used to detect and distinguish among various features of retinal fundus images by Ravishankar et.al [10]. The success rate for optic disc localisation was 97.1%. To detect exudates, a sensitivity of 95.7% and specificity of 94.2% was achieved by the authors. Manoj Kumar et.al [12] modified Clarke’s original Triangular Prism Surface Area Method to estimate fractal dimensions of gray scale images. The effects of noise on the values of fractal dimensions of digital images were discussed by T. Pant [13]. Gaussian noise, salt and pepper noise and speckle noise were applied to the digital images to generate noisy images. The fractal dimensions of these noisy images were compared with those of original images. Hard exudates in retinal image were detected using K-means clustering method and probabilistic neural network was used to train data for feature extraction by R. Radha et.al [15]. Hence, the present work emphasizes on estimation of power spectral fractal dimension, entropy and contrast to compare Diabetic Retinopathy (DR) and healthy retina.
The present research work is organized as following sections. Section1 presents introduction to diabetic retinopathy, image features, fractal dimension and past work done by various authors. Section 2 describes the methodology of work, mathematical equations and pseudo code. Section 3 presents a detailed discussion of results and comparison with clinical methods. Finally, section 4 presents conclusion of the work.
-
II. Methods
This section describes the power spectral fractal dimension, computation of H Value, Gray level scale comatrix method, related pseudo codes etc. as follows.
-
A. Power spectral fractal dimension
D f =
3D T + 2 -р
where DF is power spectral fractal dimension, DT is the topological dimension (in this case DT =2) and β is the spectral parameter which is defined by the following equation.
в = 2H + DT where H is the Hurst index or exponent. The estimation of Hurst index is explained below.
-
B. Estimation of Hurst exponent
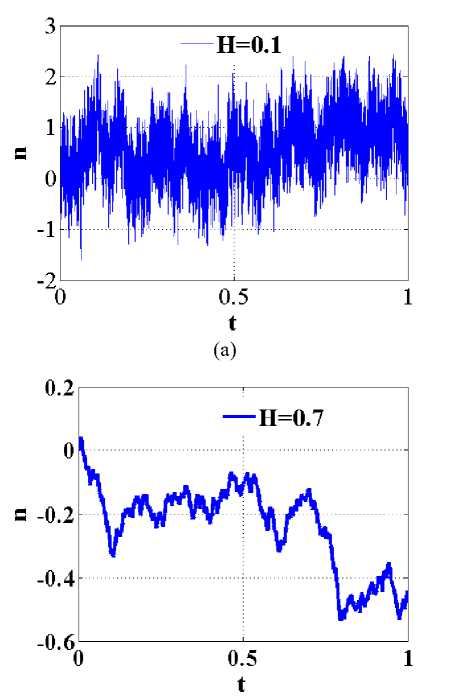
The fractal dimension provides information of the irregularity of surface. According to equation of D F , the fractal dimension is directly related to Hurst index for a self similar data set. A lower Hurst index value has a higher FD & more irregular or rougher surface. On the other hand, a larger Hurst index has a lower FD & a smoother or more regular surface. This is shown in Fig.2. The figure 2 also describes generates one dimensional fractional Brownian motion 'W' on t in [0, 1] using 'n' grid points. Where n denotes number of grid points and t denotes the time.
(b)
Estimation of Hurst index through rescaled range method is explained in the following section.
-
C. Computation of rescaled range algorithm
Estimation of H index using rescaled range algorithm has been defined by many authors [18]. The equation is given below.
E [ Rn] ] = ' S (n)
As shown in fig.3, the rescaled range was estimated for the whole data set (in step1 RS mean0 = RS 0 ). In next step, rescaled range was computed for two halves of the data set, which is RS 0 & RS 1. Then average of these two values is determined (i.e.RS mean1 ) . Similar process continues by subdividing each of the last section in half & computing the rescaled range for each of next section. In every section rescaled range values are averaged. In the present work the algorithm stops at four data points for further subdivisions.
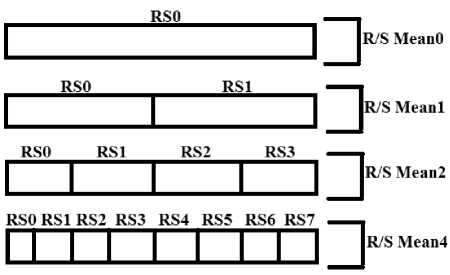
Fig.3. Description of rescaled Range algorithm
Hurst exponent estimation using the rescaled range method vector was generated, where x i = log 2 (n) is the region size of each section used to calculate R. and y i is the log 2 (RS mean of i th section) as shown in Table 1.
Table1. Example of computing H values
|
SL. No |
Region Size |
RSmean |
X i =log 2 (n) |
Y i =log 2 (RSmean) |
|
1 |
1024 |
110 |
10 |
6.7814 |
|
2 |
512 |
60 |
9 |
5.9069 |
|
3 |
256 |
35 |
8 |
5.1293 |
|
4 |
128 |
23 |
7 |
4.5236 |
|
5 |
64 |
15 |
6 |
3.9069 |
|
6 |
32 |
7 |
5 |
2.8074 |
|
7 |
16 |
5 |
4 |
2.3219 |
|
8 |
8 |
4 |
3 |
2.00 |
|
9 |
4 |
2 |
2 |
1.00 |
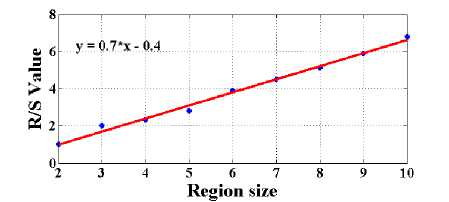
Fig.4. Generalized graph of Hurst estimation using rescaled range method
-
D. Pseudo code
Calculate H- value using rescale range algorithm from discrete time sequence X i of length N.
Set k=2, m=0:
Loop m+k-1 ≤ N
1n
Ave = — Ух;v i = 1,2.... N
N = i
Generate average – adjusted series
Y t = Xt - Ave for all t = 1, 2, 3
Generate the cumulative deviate series Z
t
Zt = У Yt For all t = 1, 2, 3.....
tt
i
Find minimum and maximum values
Determine the range R
R ( m ) = Zmax - Zmin
Add starting one to starting index m = m+1 Generate the SD
S ( m ) = ^ Z ( Xi - Ave )
End loop
Plot algorithm graph for log R(n) versus log S(m)
For all m = 1, 2, 3.....m
Compute the slope of line and Report slope as H value
-
E. GLCM Method
Gray level co-occurrence matrix method is a popular second order statistical method of obtaining texture features from retinal images. Haralick defined fourteen texture features with respect to GLCM method. In this paper two features such as entropy and contrast are selected for analysis of ROI of diabetic retinopathy and healthy retina.
-
F. Entropy
Entropy is used to estimate the loss of information in images. It is also used to measure the randomness of pixel intensities in the image. Entropy is defined by the following equation.
Entropy = ZZ- P ( x ,y ) logP ( x ,y )
-
G. Contrast
Contrast is used to distinguish between the darkest and brightest regions of the image. The contrast is defined by the following equation.
Contrast = ZZ ( x - y ) 2 p ( x,y )
-
H. Pseudo code of GLCM method
Step 2: Im2 ← rgb2gray(im1)
Step 3: Im3 ← Im2(:, :, 2)
Step 4: Im4 ← imcrop(Im3)
Step 5: Im5 ← imresize(Im4,[64 64] )
Step 6: Im6 ← imcomatrix(Im5)
Step 7: Glcmprops ← graycoprops(Im6)
Step 8: Write (Glcmprops)
Step 9: Record entropy and contrast and continue from step1
-
III. Result and discussion
simulation results of healthy and diabetic retinopathy are shown in Fig 5.
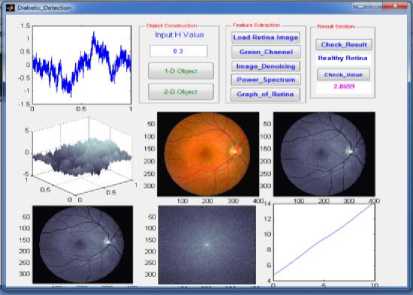
(a)
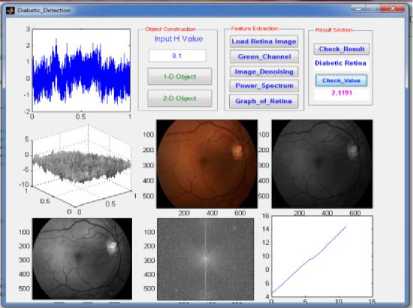
(b)
Fig.5. (a) simulation result of healthy retina and (b) Diabetic retinopathy
Table2. Statistical values of healthy retina, medium loss retinopathy, and severe loss retinopathy
|
features |
Healthy retina FD value (Grade-1) |
Medium Loss (Retina) FD Values (Grade-2) |
Severe Loss (Retina) FD Values (Grade-2) |
|
|
1 |
Min |
2.035 |
2.079 |
2.112 |
|
2 |
Max |
2.078 |
2.108 |
2.147 |
|
3 |
Average |
2.062 |
2.092 |
2.126 |
|
4 |
Median |
2.062 |
2.090 |
2.127 |
|
5 |
Mode |
2.053 |
2.082 |
2.117 |
|
6 |
SD |
0.00677 |
0.008082 |
0.0103 |
|
7 |
Range |
0.0433 |
0.0292 |
0.0354 |
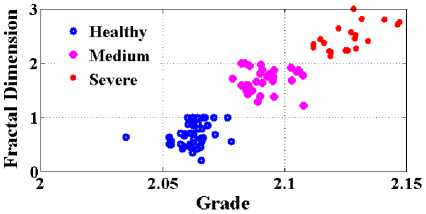
(a)
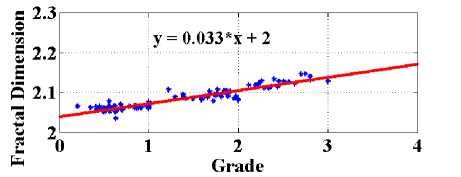
(b)
Fig.6. (a) Graph plotted FD V/S Grading and (b) shows linearity between FD and clinical method
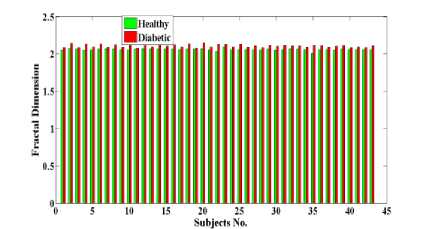
Fig.7. Fractal dimension bar chart plotted for healthy and diabetic retinopathy images
contrast, entropy and fractal dimension values for diabetic retinopathy and non diabetic retinopathy.
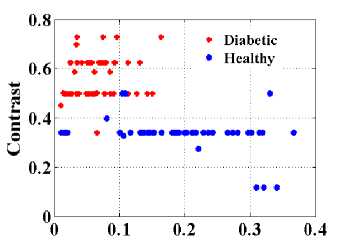
Entropy
Fig.8. Graph plotted Entropy versus Contrast
s 2.15,------------.------------.------------,-------------,------------,------------ ,--------
.2 • Healthy ; ,. *
g • Diabetic ,I
5J * ’
£ 2.05 •.............;...........• *.........:................i................i................;-
«i
Table3. Region of interest analyzed for analyzed for healthy and diabetic retinopathy
8.1 0.2 0.3 0.4 0.5 0.6 0.7 0.8
Entropy
(a)
(b)
Samples
Entropy Contrast
0.6253
0.0684
0.3373
0.1488
Fig.9. Graphs plotted (a) Entropy v/s FD and (b) graph shows linearity between entropy and F
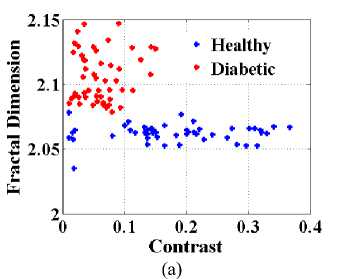
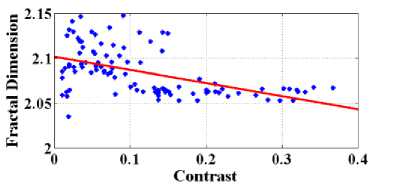
Fig.10. Graphs plotted (a) Contrast v/s FD and (b) graph shows linearity between entropy and FD
(b)
Table 4. Statistical result for healthy retina
|
SL.No |
Attributes |
Healthy Retina |
||
|
Contrast |
Entropy |
FD |
||
|
1 |
Min |
0.0104 |
0.3373 |
2.035 |
|
2 |
Max |
0.1634 |
0.7281 |
2.078 |
|
3 |
Mean |
0.06369 |
0.5622 |
2.062 |
|
4 |
Median |
0.0569 |
0.4989 |
2.062 |
|
5 |
Mode |
0.0104 |
0.498 |
2.053 |
|
6 |
SD |
0.03757 |
0.08311 |
0.00677 |
|
7 |
Range |
0.153 |
0.3908 |
0.0433 |
Table 5. Statistical result for diabetic retinopathy
|
SL.No |
Attributes |
Diabetes Retinopathy |
||
|
Contrast |
Entropy |
FD |
||
|
1 |
Min |
0.0106 |
0.1161 |
2.079 |
|
2 |
Max |
0.3671 |
0.498 |
2.147 |
|
3 |
Mean |
0.1791 |
0.3337 |
2.106 |
|
4 |
Median |
0.1726 |
0.3373 |
2.103 |
|
5 |
Mode |
0.1374 |
0.3373 |
2.082 |
|
6 |
SD |
0.09038 |
0.06485 |
0.01919 |
|
7 |
Range |
0.3565 |
0.3819 |
0.0686 |
-
[1] A.C.B. Kunicki, A.J. Oliveira, M.B.M. Mendonça,C.T.F. Barbosa and R.A. Nogueira, “Can the fractal dimension be applied for the early diagnosis of non-proliferative diabetic retinopathy?”, Brazilian Journal of Medical and Biological Research (2009) 42: 930-934.
-
[2] Shueh wen lim, ning cheung, jie j. Wang, kim c. Donaghue, gerald liew, f.m. amirul islam, alicia j. Jenkins, tien y. Wong, “Retinal Vascular Fractal Dimension and Risk of Early Diabetic Retinopathy”, Diabetes Care, Volume 32, Number 11, November 2009.
-
[3] Nazneen Akhter, Yogesh Rajput, Sumegh Tharewal, K. V. Kale, Ramesh Manza, “Fractals For Complexity Analysis Of Diabetic Retinopathy In Retinal Vasculature Images”, International Journal of Research in Engineering and Technology Volume: 03 Issue: 03 | Mar-2014.
-
[4] Dharmanna Lamani, Dr. T. C. Manjunath, Dr. U P Kulkarni, “Automated Detection of Neovascular Glaucoma through Fractal Dimension Method”, International Journal of Computer Science and Information Technologies, Vol. 5 (4), 2014.
-
[5] Myra Poon, Maria E. Craig, Harleen Kaur, Janine Cusumano, Muhammad Bayu Sasongko, Tien YinWong and Kim C. Donaghue, “Vitamin D Deficiency Is Not Associated with Changes in Retinal Geometric Parameters in Young People with Type 1 Diabetes”, Hindawi Publishing Corporation Journal of Diabetes Research Volume 2013, Article ID 280691.
-
[6] Gerald Liew, Jie Jin Wang, Paul Mitchell, Tien Y. Wong, “Retinal Vascular Imaging: A New Tool in Microvascular Disease Research”, Circ Cardiovasc Imaging September 2008.
-
[7] Behzad Aliahmad, Dinesh Kant Kumar, Hao Hao, Premith Unnikrishnan, Mohd Zulfaezal Che Azemin, Ryo Kawasaki, PaulMitchell, “Zone Specific Fractal Dimension of Retinal Images as Predictor of Stroke Incidence”, Hindawi Publishing Corporation, The
Scientific World Journal, Volume 2014, Article ID 467462.
-
[8] Dr.Chandrashekar. M. Patil, “An Approach for the Detection of Vascular Abnormalities in Diabetic Retinopathy”, International Journal of Data Mining Techniques and Applications Vol: 02, December 2013, Pages: 246-250.
-
[9] Albert Daxer, “Characterisation of Neovascularisation process in diabetic retinopathy by means of fractal geometry: diagnostic implications”, Graefe’s Archieve for Clinical and Experimental Opthomology, Springer-Verlag, 1993.
-
[10] Ravishankar S, Jain A, Mittal A, “Automated feature extraction for early detection of diabetic retinopathy in fundus images ”, IEEE Computer Society Conference on Computer Vision and Pattern Recognition, 2009.
-
[11] Gábor Márk Somfai, Erika Tátrai, Lenke Laurik, Boglárka E Varga, Vera Ölvedy, William E Smiddy, Robert Tchitnga, Anikó Somogyi and Delia Cabrera DeBuc, “BMC Bioinformatics 2014, 15:295”,
-
[12] Manoj Kumar Rathore, Mayank Kumar, Surendra yadav, Awanish Mishra, “Estimation of Fractal Dimension of Digital Images”, International Journal of Engineering and Technical Research (IJETR) ISSN: 2321-0869, Volume-2, Issue-9, September 2014.
-
[13] T. Pant, “Effect of Noise in Estimation of Fractal Dimension of Digital Images”, International Journal of Signal Processing, Image Processing and Pattern Recognition Vol.6, No.5 (2013), pp.101-116.
-
[14] P. Pentland, “Fractal-based description of natural scenes”, IEEE Trans. Pattern Anal. Mach. Intell., PAMI-6, (1984), pp. 661-674.
-
[15] R.Radha and Bijee Lakshman, “Retinal Image Analysis Using Morphological Process and Clustering Technique”, Signal & Image Processing: An International Journal (SIPIJ) Vol.4, No.6, December 2013.
-
[16] Selvathi D, N.B.Prakash, Neethi Balagopal, “Automated Detection of Diabetic Retinopathy for Early Diagnosis using Feature Extraction and Support Vector Machine ”, International Journal of Emerging Technology and Advanced Engineering, ISSN 2250-2459, Volume 2, Issue 11, November 2012.
-
[17] P. Shanmugavadivu, V. Sivakumar, “Fractal Dimension based Textural Analysis Digital Images”, Procedia Engineering 38 (2012) 2981 – 2986.
-
[18] Malhar Kale, Ferry Butar Butar, “Fractal Analysisof Time Series and Distribution Properties of Hurst Exponet”, Journal of Mathematical Science and Mathematics Education, Vol. 5, Issue 1, PP. 9-19.
-
[19] Misson G P, Landini G, Murray P I, Fractals and Ophthalmology, Lancet 339:872.
References A Novel Approach to Diagnose Diabetic Retinopathy
- A.C.B. Kunicki, A.J. Oliveira, M.B.M. Mendonça,C.T.F. Barbosa and R.A. Nogueira, "Can the fractal dimension be applied for the early diagnosis of non-proliferative diabetic retinopathy?", Brazilian Journal of Medical and Biological Research (2009) 42: 930-934.
- Shueh wen lim, ning cheung, jie j. Wang, kim c. Donaghue, gerald liew, f.m. amirul islam, alicia j. Jenkins, tien y. Wong, "Retinal Vascular Fractal Dimension and Risk of Early Diabetic Retinopathy", Diabetes Care, Volume 32, Number 11, November 2009.
- Nazneen Akhter, Yogesh Rajput, Sumegh Tharewal, K. V. Kale, Ramesh Manza, "Fractals For Complexity Analysis Of Diabetic Retinopathy In Retinal Vasculature Images", International Journal of Research in Engineering and Technology Volume: 03 Issue: 03 | Mar-2014.
- Dharmanna Lamani, Dr. T. C. Manjunath, Dr. U P Kulkarni, "Automated Detection of Neovascular Glaucoma through Fractal Dimension Method", International Journal of Computer Science and Information Technologies, Vol. 5 (4), 2014.
- Myra Poon, Maria E. Craig, Harleen Kaur, Janine Cusumano, Muhammad Bayu Sasongko, Tien YinWong and Kim C. Donaghue, "Vitamin D Deficiency Is Not Associated with Changes in Retinal Geometric Parameters in Young People with Type 1 Diabetes", Hindawi Publishing Corporation Journal of Diabetes Research Volume 2013, Article ID 280691.
- Gerald Liew, Jie Jin Wang, Paul Mitchell, Tien Y. Wong, "Retinal Vascular Imaging: A New Tool in Microvascular Disease Research", Circ Cardiovasc Imaging September 2008.
- Behzad Aliahmad, Dinesh Kant Kumar, Hao Hao, Premith Unnikrishnan, Mohd Zulfaezal Che Azemin, Ryo Kawasaki, PaulMitchell, "Zone Specific Fractal Dimension of Retinal Images as Predictor of Stroke Incidence", Hindawi Publishing Corporation, The Scientific World Journal, Volume 2014, Article ID 467462.
- Dr.Chandrashekar. M. Patil, "An Approach for the Detection of Vascular Abnormalities in Diabetic Retinopathy", International Journal of Data Mining Techniques and Applications Vol: 02, December 2013, Pages: 246-250.
- Albert Daxer, "Characterisation of Neovascularisation process in diabetic retinopathy by means of fractal geometry: diagnostic implications", Graefe's Archieve for Clinical and Experimental Opthomology, Springer-Verlag, 1993.
- Ravishankar S, Jain A, Mittal A, "Automated feature extraction for early detection of diabetic retinopathy in fundus images", IEEE Computer Society Conference on Computer Vision and Pattern Recognition, 2009.
- Gábor Márk Somfai, Erika Tátrai, Lenke Laurik, Boglárka E Varga, Vera Ölvedy, William E Smiddy, Robert Tchitnga, Anikó Somogyi and Delia Cabrera DeBuc, "BMC Bioinformatics 2014, 15:295",
- Manoj Kumar Rathore, Mayank Kumar, Surendra yadav, Awanish Mishra, "Estimation of Fractal Dimension of Digital Images", International Journal of Engineering and Technical Research (IJETR) ISSN: 2321-0869, Volume-2, Issue-9, September 2014.
- T. Pant, "Effect of Noise in Estimation of Fractal Dimension of Digital Images", International Journal of Signal Processing, Image Processing and Pattern Recognition Vol.6, No.5 (2013), pp.101-116.
- P. Pentland, "Fractal-based description of natural scenes", IEEE Trans. Pattern Anal. Mach. Intell., PAMI-6, (1984), pp. 661-674.
- R.Radha and Bijee Lakshman, "Retinal Image Analysis Using Morphological Process and Clustering Technique", Signal & Image Processing: An International Journal (SIPIJ) Vol.4, No.6, December 2013.
- Selvathi D, N.B.Prakash, Neethi Balagopal, "Automated Detection of Diabetic Retinopathy for Early Diagnosis using Feature Extraction and Support Vector Machine ", International Journal of Emerging Technology and Advanced Engineering, ISSN 2250-2459, Volume 2, Issue 11, November 2012.
- P. Shanmugavadivu, V. Sivakumar, "Fractal Dimension based Textural Analysis Digital Images", Procedia Engineering 38 (2012) 2981 – 2986.
- Malhar Kale, Ferry Butar Butar, "Fractal Analysisof Time Series and Distribution Properties of Hurst Exponet", Journal of Mathematical Science and Mathematics Education, Vol. 5, Issue 1, PP. 9-19.
- Misson G P, Landini G, Murray P I, Fractals and Ophthalmology, Lancet 339:872.
