A novel approach to predict high blood pressure using ABF function

Author: Satyanarayana Nimmala, Ramadevi Y., Ramalingaswamy Cheruku
Journal: International Journal of Modern Education and Computer Science @ijmecs
Article in issue: 7 vol.10, 2018.
Free access
High Blood Pressure (HBP) is a state in the biological system of human beings developed due to physical and psychological changes. Nowadays, it is a most prevalent problem in human beings irrespective of age, place, and profession. The HBP victims are increasing rapidly across the globe. HBP is undiagnosed in the majority of the patients because most of the affected people are not aware of it. To overcome this problem, this paper proposes a new approach that uses ABF (Arterial Blood Flow)-function to predict a person is prone to HBP. In this approach, the impact factor for each attribute is calculated based on the attribute value. Both attribute value and corresponding impact factor are used by ABF function to predict a person is prone to HBP. We experimented proposed approach on real-time data set, which consists of 1100 patient records in the age group between 18 and 65. Our approach outperforms regarding predictive accuracy over j48, Naive Bayes and Rule-based classifiers.
Short address: https://sciup.org/15016781
IDR: 15016781 | DOI: 10.5815/ijmecs.2018.07.07
Text of the scientific article A novel approach to predict high blood pressure using ABF function
Published Online July 2018 in MECS DOI: 10.5815/ijmecs.2018.07.07
Blood Pressure may vary with the change in age, obesity, cholesterol levels [1]. So, this paper considers these three parameters for experimental analysis. The first concern is age, the impact of age may be one of the reasons for high Blood Pressure (BP), especially people of age between 40 and above. As the person is aging, 1) the performance of the cardiovascular system may decrease. 2) Arteries become thinner and harden, 3) the capacity of the body to process sodium in the diet decreases. The second concern is obesity, which is represented using BMI (Body Mass Index) [1]. If BMI value is in between 20 and 25, then the person is not obese. If its value is in between 25 and 29.9 then the person considered as overweight. If its value is more than 30 than the person is considered as obese. Obese means more blood has to be pumped to provide nutrients and oxygen to body tissues newly formed because of overweight. A third concern is blood cholesterol if total blood cholesterol level is high, and then the excess oily fat will stick to the walls of the arteries [2]. If the same state is continued for a longer period, it can create a fatty buildup against the walls of arteries. The fatty substance finally hardens, forming a type of hardened plaque that damages the arteries or they become firm and narrowed [20].
This paper proposes a novel approach that works in two steps. In the first step, for each attribute impact factors are set. The impact factor is a real value which represents the degree of influence of an attribute in elevating blood pressure. Impact factor for each attribute of the selected record is set based on the attribute value and its relationship with class labeled attribute using Pearson correlation coefficient. PCC is calculated using the equation 1.
N ∑ XY - ∑ X ∑ Y
J [ N ∑ X 2 - ( ∑ X )2][ N ∑ Y 2 - ( ∑ Y )2]
In the second step, the proposed algorithm calculates the value of class label attribute using impact factor and corresponding attribute value. The class label attribute value is then used to predict whether a person is prone to HBP. Our proposed approach calculates and tabulates impact factors in the training phase of the classifier based on the input data set.
-
II. Background
This Section provides a brief view of blood pressure and different parameters which are affecting the blood pressure.
-
A. Blood pressure
When the heart beats, it pushes the blood against arteries with some force that creates some pressure inside the blood vessels called as systolic blood pressure [4]. The pressure inside the blood vessels when the heart rest between beats is called diastolic blood pressure. Blood pressure is affected by two factors such as Cardiac Output (CO) and Total Peripheral Resistance (TPR) [14]. It can be represented using (2).
BP = CO X TPR (2)
Here CO is affected by increased venous return or stroke volume or heart rate or sympathetic activity or combinations of these. TPR is influenced by the resistance that acts because of fat inside the blood vessels or damaged blood vessels [18].
-
B. Age, Obesity, and Total Blood Cholesterol
In these days [9] increase in blood pressure is an inevitable consequence of aging people. Many attributes of human body get affected as we grow old. Age may be the reason for raising blood pressure but not applicable to all human beings. Even if it is true, then every person grows older will suffer from high blood pressure, indeed not true. There are other biological attributes like obesity and high blood cholesterol along with age may reason to raise blood pressure.
-
C. Impact of Age on Blood Pressure
Aging is inevitable although a person has a healthy diet and exercise regularly. It affects the heart performance in pumping blood. Heart beats are regulated by the natural pacemaker system in the heart. If the age of a person increases then pathways of the heart’s pacemaker system deposits fat, which will affect the heart performance while pumping the blood [3]. As we grow older Heart muscle cells will be degenerated and becomes thin, Blood vessels performance decreases. Both may be the reason for hypertension at old age. When it comes to arteries they tend to narrow and harden with aging; the heart has to push the blood against harden arteries which may raise the blood pressure. As we age, kidney functionality decreases and the ability of the body to process sodium in the diet decreases [5].
-
D. Impact of Obesity on Blood Pressure
Overweight and obesity are not the same, although they are on the same path, represent different points. Body Mass Index (BMI) [1] is used to measure whether a person is obese or not. BMI is a measure of weight which is proportionate to height, and it is expressed in kg/m2. If
BMI value is in between 18.5 to 24.9, then it is treated as normal. If BMI value in between 25 and 30 then it is considered as overweight [13]. A person is treated as obese if the BMI is above 30. In obese people, there is an increase in fatty tissue [11]. The increased fatty tissue in the body requires nutrients and oxygen to live. So, the heart has to pump more blood for the livelihood of increased fatty tissue, which may raise the blood pressure [12].
-
E. Impact of Cholesterol on Blood pressure
Cholesterol is a waxy, fat-like substance which is found in all cells of the body. Cholesterol is carried in small packages called lipoproteins. These small packages have fat inside and proteins outside. Two kinds of lipoproteins carry cholesterol throughout the body. One is LDL (Low-Density Lipoprotein) cholesterol it is also called as bad cholesterol.
If LDL level is high, then it builds up cholesterol in arteries. Higher LDL level in blood, the greater chance of getting the cardiovascular disease is more. The second one is HDL (High-Density Lipoprotein) cholesterol; it is called good cholesterol [15]. It carries cholesterol from all parts of the body back to the liver. The liver removes the cholesterol from the body. If HDL cholesterol level is high, then there are fewer chances of getting cardiovascular disease. High cholesterol in the blood can create fatty buildup against the walls of the arteries. It is the main reason for narrowing of the arteries [16].
-
III. Literature Survey
In the literature, most of the research7 is carried on how BP is influenced by age, obesity and high blood cholesterol. There is no literature found on the combined effect of age, obesity and blood cholesterol in Predicting high blood pressure. In this paper, we focus on their combined effect on HBP. In literature8, HBP is proportional to age, obesity and high blood cholesterol but it is not a quantitative measurement. Our proposed experimental results show that the quantitative proportionality of age, obesity, and blood cholesterol in elevating the blood pressure. The rest of the chapter explains the existing algorithms used for classification.
-
A. J48 Algorithm
J48 is a Decision tree based WEKA implemented c4.5 classification algorithm. A Decision tree based classifier classifies the input instances by passing it through the tree starting at the top and moving down till to the leaf node. Leaf node value represents the predicted output value for a given input instance. Initially, information gain is calculated for each attribute of input instance. The attribute with highest information gain is selected as splitting attribute. Recursive approach is used to divide the remaining instance at each node. Information Gain (IG) of an attribute A is calculated at the selected node using (3).
( | S |
InformationGain(S, A) = Entropy(S) - ^ I ; Entropy(S) I veValueS( A) \ I S I J
Where S is the set of instances at that node and |S| is its cardinality, and Sv is the subset of S for which attribute A has value v. The entropy of the set S is calculated using (4).
numclasses
Entropy ( S ) = ^ - P i log 2 P i (4)
i = 1
Where p i is the probability of instances in S which belong to the ith class, and n is a number of classes.
-
B. Naive Bayes Classifier
It is a simple probabilistic classifier based on Bayes Theorem. The Naive Bayes algorithm builds classification model by learning the conditional probabilities of each input attribute. The same model is used to predict the class membership of input instance. It is done by applying Bayes rule on the conditional probability as given in (5).
P ( A I B ) =
P ( B | A ) P ( A ) P ( B )
Here, P(x|y) is defined as the probability of observing x, given that y occurs. P(x|y) is called posterior probability P(y|x), P(x) and P(y) are called prior probabilities.
-
C. Linear Regression algorithm
The Linear Regression algorithm of WEKA calculates standard least squares to find a linear relationship in the training data. Standard linear regression is applied to the input attributes to get the predicted the output, which is calculated as (6).
w 0 + w ! a ! (1) +.......... + wkak (1) = ^ wa (1) (6)
i = 0
Where aj are input attributes, and wj are the weights associated with them.
-
D. Performance Parameters
Table 1. Performance measures of classifier
|
Accuracy, or Recognition rate |
TP +TN (P+N) |
|
Error rate, Misclassification rate |
FP +FN (P +N) |
|
Sensitivity, True positive rate, TP, Recall |
TP P |
|
Specificity, True negative rate |
TN N |
|
Precision |
TP TP +FP |
|
F, F1, F-score, the Harmonic mean of precision and Recall |
2×precision×recall precision+recall |
The metrics used to measure the performance of a classifier are represented as shown in equations Table 1.
Here, we considered record with class label YES as a positive record, and class label NO as a Negative record. P is a total number of positive records. N is a total number of negative records. TP refers to the positive records which are correctly labeled by the classifier. TN is the negative records which correctly labeled by the classifier. FP is the negative records which improperly labeled as positive. FN is the positive records which incorrectly labeled as negative.
-
IV. Proposed Approach
In our proposed approach, we obtained the degree of influence of age, obesity and total blood cholesterol in elevating blood pressure using equation 1. It is a combined approach in which age, obesity, and blood cholesterol are used to predict whether a person is prone to HBP. Earlier research [9] carried on how BP influenced by age, obesity and high blood cholesterol. As they are considered individually in the prediction, performance of existing classifiers decreased in prediction. To address this problem, we proposed a new combined approach that uses ABF function as presented in Algorithm 1, which shows high performance in prediction as compared with existing algorithms.
-
A. Proposed Classifier
In proposed approach, we express Blood pressure as defendant variable(y) on age(x1), obesity(x2) and total blood cholesterol(x3).
n y= £ ( c i x i ) (7)
i= 1
Where c1, c2, and c3 are impact factors which represent the impact of each attribute in elevating blood pressure and n is a number of attributes. The output variable y is used to predict whether a person is prone to HBP or not. Our proposed approach uses ABF-function; it reads the values of age, obesity and total blood cholesterol for each input record. Then it uses equation (7) to calculate the y value. The y value compared with Test value which is initialized as 200 during the training phase of the classifier. The thresh hold value 200 is set using training dataset. If calculated y value for a test record is greater than Test value, the record is predicted as YES otherwise NO. Here our data set contains 1100 records collected from 1100 people of age group between 18 and 65. These records collected from Doctor C, a Diagnostic medical Center, Hyderabad, India. Each record consisting of age, obesity, cholesterol level, systolic and diastolic blood pressure values. We trained the model using 65% of records. In training phase impact factors, have been calculated and shown in Table 2, 3 and 4. The impact factor is a real value which represents the degree of influence of an attribute in elevating blood pressure. Then 35% of records are used to test the model.
Algorithm 1: Proposed ABF
Input: S: Set of Training Records
T: Set of Testing Records
Test_value=200
Output: Assign class label for each Test record
Begin
for each test record tj € T do initialize Xi = r,.age
X2 = tj. obesity
X3 = t3.total_blood_cholesterol
Initialize impact factors (a.b.c') based on Tables 1, 2 and 3 for each tj
Calculate у = (a x xi) 4- (b XX2) + (cx хз)
if у > Test .value then
L classJabel for tj = 1
else
|_ classJabel for tj = 0
_ return classJabel
End
Table 2. Age and its Impact factors
|
Age value |
c1 (Impact factor for age x1) |
|
<=30 |
1 |
|
>30 and <=50 |
4 |
|
>50 |
6 |
Table 3. Obesity and its Impact Factors
|
Obesity Value |
c2 (Impact factor for obesity x2) |
|
<=26 |
-8 |
|
>26 and <=30 |
0.5 |
|
>30 |
1 |
Table 4. Total Blood Cholesterol and its Impact factors
|
Cholesterol value |
c3 (Impact factor for Cholesterol x3) |
|
<=150 |
-1 |
|
>150 and <=200 |
0.5 |
|
>200 |
1 |
-
B. Proposed Architecture
Blood pressure increased if there is an increase in Blood volume or heart rate or stroke volume or blood viscosity or total peripheral resistance. We have represented different factors that are affecting Blood pressure. In figure 1 yellow rectangle represents proposed approach. In this approach, increase in obesity level, blood cholesterol and age may lead to increase in total peripheral resistance or increase in blood viscosity. It may result in raising blood pressure.
-
V. Experimental Evaluation
This section compares the performance of proposed classifier with the existing classifiers6. We used real-time data set collected from Doctor C, a Diagnostic Medical Center, Hyderabad, India for experimental analysis. All experiments are conducted using WEKA (Waikato Environment for knowledge analysis) tool.
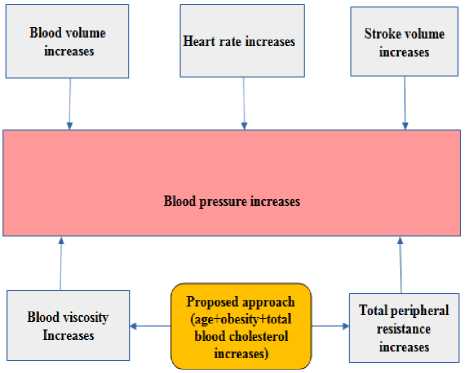
Fig.1. Block diagram of a Proposed approach
We used parameters like accuracy, precision, TP rate and FP rate to compare the performance of classifiers. Data set consists of 1100 records; each record contains four attributes as shown in Table 4. In our Experiments, 65% of records (715) are used to train the model, and 35% of records (385) is used to test the model.
-
A. Classification using J48 Classifier
In this classifier, we used Attributes such as Age, Obesity, Cholesterol, BP-patient. Total Number of records are 1100. Among this 65% of records (715) are used to train the model, and 35% of records (385) are used to test the model. Test data consist of 151 records of class label YES, 234 records of class label NO. Out of 385 test records, 349 records are correctly classified, and 36 records are incorrectly classified. Classifier accuracy is 90.6494%. Table 6 shows the performance measures which are obtained using J48 classifier.
-
B. Classification using Naive Bayes Classifier
In this classifier, we used Attributes such as Age, Obesity, Cholesterol, BP-patient. Total Number of records is 1100. Among this 65% of records (715) are used to train the model, and 35% of records (385) is used to test the model. In test data 151 records are class label YES, 234 are of class label NO. Out of 385 test records, 274 records are Correctly Classified, and 111 records are incorrectly classified. Classifier accuracy is 71.1688%. Table 7 shows the performance measures which are obtained using naïve Bayes classifier.
-
C. Classification using Regression
In this classifier, we used Attributes such as Age, Obesity, Cholesterol, BP-patient. Total Number of records is 1100. Among this 65% of records (715) are used to train the model, and 35% of records (385) is used to test the model. In test data 151 records are class label YES, 234 are of class label NO. Out of 385 test records, 266 records classified correctly, and 119 records incorrectly classified. Classifier accuracy is 69.0909%. Table 8 shows the performance measures which are obtained using simple logistic classifier.
-
D. Classification using the Proposed approach
In this classifier, we used Attributes such as Age, Obesity, Cholesterol, BP-patient. Total Number of input records are 1100. Among this 65% of records (715) are used to train the model, and 35% of records (385) is used to test the model. In test data 151 records are class label Out of 385 test records, 352 records are correctly classified, 33 records are incorrectly classified. Classifier accuracy is 91.4286 %. Table 8 shows the performance measures which are obtained using proposed approach. Table 10 represents Accuracy and error comparison of different classifiers.
Table 5. Attributes Information
|
Attribute Number |
Attribute |
Minimum |
Maximum |
Mean |
Standard Deviation |
Attribute Type |
|
1 |
Age |
18 |
65 |
37.896 |
11.641 |
Numeric |
|
2 |
Obesity |
15.5 |
37 |
24.193 |
4.031 |
Numeric |
|
3 |
Cholesterol |
102 |
258 |
167.375 |
31.824 |
Numeric |
Table 6. Class wise accuracy details using J48
|
Class |
TP Rate |
FP Rate |
Precision |
Recall |
F-Measure |
|
YES |
0.821 |
0.038 |
0.932 |
0.821 |
0.873 |
|
NO |
0.962 |
0.179 |
0.893 |
0.962 |
0.926 |
Table 7. Class wise accuracy details using Naïve Bayes
|
Class |
TP Rate |
FP Rate |
Precision |
Recall |
F-Measure |
||||
|
YES |
0.570 |
0.197 |
0.652 |
0.570 |
0.608 |
||||
|
NO |
0.803 |
0.430 |
0.743 |
0.803 |
0.772 |
||||
|
Table 8. Class wise accuracy details using simple regression. |
|||||||||
|
Class |
TP Rate |
FP Rate |
Precision |
Recall |
F-Measure |
||||
|
YES |
0.503 |
0.188 |
0.633 |
0.503 |
0.561 |
||||
|
NO |
0.812 |
0.497 |
0.717 |
0.812 |
0.762 |
||||
|
Table 9. Class wise accuracy details using proposed approach |
|||||||||
|
Class |
TP Rate |
FP Rate |
Precision |
Recall |
F-Measure |
||||
|
YES |
0.828 |
0.030 |
0.947 |
0.828 |
0.883 |
||||
|
NO |
0.970 |
0.172 |
0.897 |
0.970 |
0.932 |
||||
|
Table 10. Accuracy and Error Comparison of different classifiers |
|||||||||
|
Algorithm |
Accuracy |
Mean, absolute error Root |
Mean squared error |
Relative, absolute error |
|||||
|
J48 |
90.6494 % |
0.1317 |
0.2757 |
27.5563 % |
|||||
|
Naive Bayes |
71.1688 % |
0.3727 |
0.4545 |
77.9833 % |
|||||
|
Simple logistic regression |
69.0909 % |
0.393 |
0.4555 |
82.2395 % |
|||||
|
Proposed Approach |
91.4286 % |
0.1252 |
0.2674 |
26.2229 % |
|||||
|
E. Performance Comparison This section provides the detailed analysis of accuracy and error rates which are obtained during the experimentation. The accuracy of the proposed classifier is 91.4286% which is greater than the performance of classifiers like j48, naive Bayes and simple logistic regression. The proposed classifier improved the performance while predicting positive records as |
compared to the classifiers like j48, naïve Bayes and regression-based classifiers as shown in Table 8. VI. Conclusion and Future Work This paper proposed a novel approach to classify test records of patients to predict whether a person is prone to high blood pressure. Proposed approach works in two |
||||||||
stages. In the first stage, it takes impact factors of each attribute from the sample data set. In the second stage, it calculates the class label attribute value (y). Based on the ’y’ value, it predicts whether a person is prone to high blood pressure. The conclusions made after getting experimental results are: If Cholesterol is >200 and obesity is >25 irrespective of age, person may become victim of HBP. If obesity is >30 and age is also >30 irrespective of cholesterol level there is increase in systolic blood pressure. If age>30 and obesity>25 and cholesterol is >150 possibility of person to become HBP is more. Increase in cholesterol level raising the diastolic blood pressure. In the performance evaluation, we used metrics like Accuracy, TP Rate, FP Rate, F-measure, Precision, Recall, Mean absolute error, Root mean squared error and Relative absolute error. The proposed approach has shown91.4286% accuracy, reduced time complexity and reduced error rates as compared to j48, Naive Bayes and, linear regression classifiers. As part of future research work, we would like to consider few more attributes like anxiety, stress levels of a person to enhance the performance of proposed Approach.
Acknowledgments
We thank Doctor C, Medical Diagnosis Center, Hyderabad, India for their support in providing Data Set. We also thank Dr. Seetharam, Cardiologist, Yashoda Hospitals, Hyderabad, India on improving this manuscript.
References A novel approach to predict high blood pressure using ABF function
- World Health Organizationhttp:// www. who. Int /gho /ncd/risk _factors/blood_pressure_prevalence_text/ en /
- American Heart Association : http://www. heart. org /idc / groups / heartpublic / @ wcm / @hcm / documents / downloadable/ucm_461840.pdf
- M. Peltokangas, A. Vehkaoja, J. Verho, Age Dependence Of Arterial Pulse Wave Parameters Extracted From Dynamic Blood Pressure and Blood Volume Pulse Waves, IEEE journal of biomedical and health informatics 21 (2017) 142–149.
- C. D. McNaughton, N. J. Brown, R. L. Rothman, D.Liu, et. al., Systolic Blood Pressure and Biochemical Assessment of Adherence, Hypertension 70 (2017) 307–314.
- S. C. Millasseau, R. P. Kelly, J. M. Ritter, and P. J.Chowienczyk, The vascular impact of aging and vasoactive drugs: Comparison of two digital volume pulse measurements, Amer. J. Hypertension, 16 2013) 467–472.
- N.Satyanarayana, CH. Ramalingswamy, and Y. Ramadevi, Survey of Classification Techniques in Data Mining, International Journal of Innovative Science, Engineering & Technology 1 (2014) 268–278.
- J. K. K. Vishram, A. Borglykke, Anne H. Andreasen, J. Jeppesen, and H. Ibsen, Impact of Age on the Importance of Systolic and Diastolic Blood Pressures for Stroke Risk, Hypertension 60 (2012) 1117–1123.
- R. Anchala, N. K. Kannuri, and H. Pant, Hypertension in India: a systematic review and meta-analysis of prevalence, awareness, and control of hypertension, Journal of Hypertension 32 (2014) 1170–1177.
- R. Gupta, S. Guptha, VP. Gupta, and H. Prakash, Prevalence and determinants of hypertension in the urban population of Jaipur in western India, J Hypertens 13 (1995)1193–1200.
- R. Gupta, PC. Deedwania, V. Achari, A. Bhansali, and K. Gupta Normotension, Prehypertension, and hypertension in urban middle - class subjects in India: prevalence, awareness, treatment, and control, Am J Hypertens 26, (2013)83–94.
- L. Mertens. Ilse , and F. Van Gaal, Overweight, Obesity, And Blood Pressure: The Effects of Modest Weight Reduction, Obesity research 8 (2000) 270–278.
- S. Julius, M. Valentini, and P. Palatini, Overweight and hypertension: a 2-way street, Hypertension 35(2000) 807 –813.
- N. Re. Richard, Obesity - Related Hypertension, The Ochsner Journal 9 (2009) 133–136.
- F. Mohamad, R. Hilmi, and D. Mohamad Forouzanfar, Oscillometric Blood Pressure Estimation: Past, Present, and Future, IEEE reviews in biomedical engineering 8(2015) 44-61.
- A. M. Bhende, S. B. Zade, and S. R. Sitre, I nfluence of family hypertension on blood pressure, serum cholesterol, high density lipoprotein cholesterol in general population, International Journal of Pharma and BioSciences 3 (2012) 176–180.
- K. Meenakshi, S. and A. Kanitkar, Ultrasonographic assessment of abdominal fat and its correlation with blood pressure, International Journal of Biomedical and Advance Research 6 (2015) 259–263.
- V. Gupta, J. P. Lo Gerfo , PP. Raingsey , The prevalence and associated factors for prehypertension and hypertension in Combodia, Heart Asia 5 (2013) 253–58.
- Q. Liu, B. P. Yan, Yu. C M, and Zhang. Y T, Attenuation of Systolic Blood Pressure and Pulse Transit Time Hysteresis during Exercise and Recovery in Cardiovascular Patients, IEEE Transactions on Biomedical Engineering 61 (2014) 346–352.
- K. Takazawa, N. Tanaka, M. Fujita, O.Matsuoka, T. Saiki, M. Aikawa, S. Tamura, and C. Ibukiyama, Assessment of vasoactive agents and vascular aging by the second derivative of photoplethysmogram waveform, Hypertension 32 (1998) 365–370.
- H. Kanai, Y. Matsuzawa, K. Kotani, Y. Keno, T.Kobatake, and Y. Nagai, Close correlation of intra abdominal fat accumulation to hypertension in obese women, Hypertension 16 (1990) 484–490.
