A Novel Approach to T2-Weighted MRI Filtering: The Classic-Curvature and the Signal Resilient to Interpolation Filter Masks

Автор: Carlo Ciulla, Farouk Yahaya, Edmund Adomako, Ustijana Rechkoska Shikoska, Grace Agyapong, Dimitar Veljanovski, Filip A. Risteski
Журнал: International Journal of Information Engineering and Electronic Business(IJIEEB) @ijieeb
Статья в выпуске: 1 vol.8, 2016 года.
Бесплатный доступ
This paper presents a novel and unreported approach developed to filter T2-weighetd Magnetic Resonance Imaging (MRI). The MRI data is fitted with a parametric bivariate cubic Lagrange polynomial, which is used as the model function to build the continuum into the discrete samples of the two-dimensional MRI images. On the basis of the aforementioned model function, the Classic-Curvature (CC) and the Signal Resilient to Interpolation (SRI) images are calculated and they are used as filter masks to convolve the two-dimensional MRI images of the pathological human brain. The pathologies are human brain tumors. The result of the convolution provides with filtered T2-weighted MRI images. It is found that filtering with the CC and the SRI provides with reliable and faithful reproduction of the human brain tumors. The validity of filtering the T2-weighted MRI for the quest of supplemental information about the tumors is also found positive
Magnetic Resonance Imaging, Human Brain Tumor, Classic-Curvature, CC, Signal Resilient to Interpolation, SRI, Filter Mask, Convolution
Короткий адрес: https://sciup.org/15013386
IDR: 15013386
Текст научной статьи A Novel Approach to T2-Weighted MRI Filtering: The Classic-Curvature and the Signal Resilient to Interpolation Filter Masks
Published Online January 2016 in MECS
Filtering the Magnetic Resonance Imaging (MRI) of the human brain is a common practice and is adopted in both research and/or diagnostic settings [1]. The noise in MRI is Rician [2] and its removal can cause loss of spatial resolution [3]. The field inhomogeneity is also a cause of noise in MRI, especially at high and ultra-high magnetic fields [4, 5]. In this paper, filtering is used at the aim to highlight specific features of the human brain MRI images, while suppressing other features and/or anatomical structures of the human brain. As a consequence of the aim, filtering is here shown to be capable to aid the quest for supplemental information which is useful to the study of human brain tumors. The focus of this research is on filtering two-dimensional T2-weighted MRI images. The procedure here described in order to filter the MRI uses the intensity-curvature measurement approaches called Classic-Curvature (CC) [6] and Signal Resilient to Interpolation (SRI) [6].
The two filtered T2-weighted MRI images are analyzed together with the T2-weighted MRI with the intent to seek for supplemental information in diagnostic settings as far as regards the tumor pathology. The next section will report the mathematical methodology. In section III, both reliability and validity of the method will be explored. Section IV will address the significance of the results and will present an example of effectiveness of the methodology with another MRI modality. Section V will summarize the main findings this research.
-
II. Methodology
The procedure starts from fitting a model function to the discrete sample of data which the T2-weighted images comprises of (the pixels), so to provide continuity inside the pixel and to allow pixel re-sampling. While the Classic-Curvature is defined as the sum of all of the second order partial derivatives of the Hessian of the model function [7], the Signal Resilient to Interpolation is calculated on the basis of the equation of two intensitycurvature terms [7].
The model function used in this research is a parametric bivariate cubic Lagrange polynomial, which is chosen to pursue the scope of this research after careful review and selection from a wide array of polynomials [7]. The parameter of the model function provides the math procedure with the freedom to fine tune the calculation, the appearance and the filtering properties of the intensity-curvature measurement approaches. It is thus relevant to acknowledge that the methodology employed in this paper is clearly dependent on the model function chosen to fit the T2-weighted MRI data. Because of the continuity provided to the discrete signal of the two-dimensional T2-weighted MRI images, is possible to calculate two new images: (i) the Classic-Curvature and (ii) the Signal Resilient to Interpolation. The new images are used in this piece of research likewise two filter masks, and so to convolve the T2-weighted MRI.
-
A. The Model Function
The mathematical formula of the model function appears in [6] and is here reported in (1).
9^ (х,у) = /(0,0) + ос 2 -а •
[(х + у)3 + (1) (х + у)2 + (1) (х + у) + 1] + а3 • а[(х + у)2 + (х + у) + 1] (1)
The value of f (0, 0) is the pixel intensity of the MRI for which the values of the CC and SRI pixel intensity are computed. The aforementioned computation is done for all of the pixel intensity values of the MRI image, thus the CC and the SRI are also images. The constants α 2 , α 3 are convolutions (summations) of pixel intensity values and ‘a’ is the parameter of the model function. The value of ‘a’ used herein is 7.54, is arbitrary, and for the purpose of this paper has been carefully chosen among other values.
-
B. The Classic-Curvature
The Classic-Curvature of the model function as previously mentioned is calculated by summing up the four second order partial derivatives of (1) respect to the independent variables x and y and the covariates x, y and y, x [6], and is defined in (2).
С С (х,у) = 4 • {«2 • а [6(х + у) + 1] + 2 « •а} (2)
The meaning of the Classic-Curvature of an MRI image is the second order derivative of the image. Fig. 1 shows an example of Classic-Curvature image (see (b)) calculated on the basis of the T2-weighted MRI shown in (a).
-
C. The Signal Resilient to Interpolation
This section reports on the mathematical formulation of the Signal Resilient to Interpolation (SRI). To explain the meaning of the SRI, is necessary to define another intensity-curvature measurement approach which is called Intensity-Curvature Functional (ICF) [7].
The ICF is the ratio of the following two terms: (i) the integral of the product between the pixel intensity f(0, 0) and the Classic-Curvature calculated at the pixel coordinate (x, y) = (0, 0); and (ii) the integral of the product between the model function calculated at the intra-pixel coordinate (x, y) and the Classic-Curvature calculated at the intra-pixel coordinate (x, y). Equating the two aforementioned terms and solving the equation in f(0, 0) provides with the Signal Resilient to Interpolation. When applied to the model function (1), the mathematical procedure described in this paragraph calculates the SRI as shown in (3).
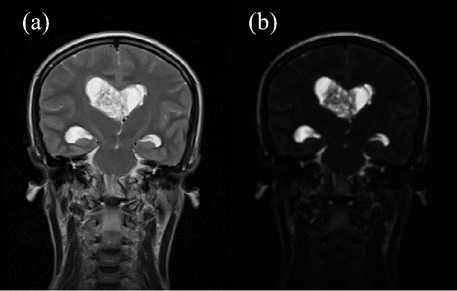
Fig.1. The image in (a) shows the T2-weighted MRI (a) and the image in (b) is the Classic-Curvature of the image shown in (a). The ClassicCurvature image was calculated with (2), having (1) as model function fitted to the image in (a). The advantage of the Classic-Curvature shown in Fig. 1b is to illuminate the tumor structure which is visible in Fig. 1a and is highlighted in Fig. 1b placing the emphasis on the intraventricular tumor structure details. Noteworthy, Fig. 1b has not been contrast-brightness enhanced.
/(0,0) = { 6 к4 (а2а)2 + к3 [4 (а2 а)2 + 8 а3 «2 а2] + к2 [ 2 (а2 а)2 + 14 а3 «2 а2 + 2(а3 а)2 ] + ki [©) (а2 ^ + (т) “з «2 а2 + 4 («з а)2 ] +
[(а2 а) 2 + 3 «3 «2 а 2 +2 (а3 а) 2 ] ху} /
{ [ а 2 а + 2 а 3 а ] ху - { а 2 а •
[6 (ух2/2 + ху2/2) + ху] + 2 «3 а ху } }
-
к4 = (Й) ух5 + (|) х4у2 + (!) х3у3 + (|)х2у4 + © ху 5)
кз = (© ух 4 + ® х 3 у 2 + © х 2 у 3 + © ху 4 ) (5)
-
к2 = (© ух3 + (!) х2у2 + (!) ху3)
к1 = ((0 ух2 + (0 ху2)
The CC and the SRI do not perform the same function. Indeed, the CC is the second order derivative of the image, the SRI, on the other hand, is calculated using (3). For instance, as shown in Fig. 1b, the CC illuminates the intra-ventricular tumor structure, placing the emphasis on the fibers of tumor structure; and the SRI shown in Fig. 2, highlights the intra-ventricular tumor structure, however with different gray levels respect to the T2-weighted MRI shown in Fig. 1a. The tumor of the brain is highly and clearly visible in the SRI image (see Fig. 2), and this may aid the diagnosis of the tumor. Moreover, both of the CC and the SRI are needed as filter masks to convolve the two-dimensional MRI images of the pathological human brain.
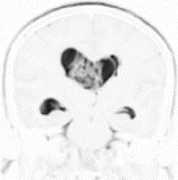
Fig.2. The Signal Resilient to Interpolation (SRI) of the T2-weighted MRI shown in Fig. 1a. The SRI is calculated using (3).
-
D. Filtering the T2-weighted MRI
The Classic-Curvature and the Signal Resilient to Interpolation are used as filter masks to convolve the T2-weighted MRI so to obtain the filtered MRI. As shown in Fig. 3a and Fig. 3b two novel images (the filtered T2-weighted MRIs) are calculated from the MRI shown in Fig. 1a. The advantage of filtering the T2-weighted MRI using the Classic-Curvature and the Signal Resilient to Interpolation as filter masks is shown in Fig. 3. Indeed the gray scale obtained in Fig. 3 provides with different yet useful information about the structure of the intraventricular tumor mass (compare Fig. 1a with Figs. 3a and 3b to see a finer level of details in the filtered images). Thus, the supplementary information shown in Fig. 3 consists of the increased visibility of the intraventricular tumor, and such information can be useful both in research and diagnostic settings.
-
E. The Contrast-Brightness Enhancement
In relationship to Figs. 5, 6 and 7 is necessary to discuss the use of the contrast-brightness enhancement. Specifically, the questions to answer are: (i) why the enhancement is done, and (ii) whether the enhancement introduces bias in the interpretation of the filtered images.
Generally, it is here provided a valid justification (or criticism) to the two aforementioned questions. In order to improve the visibility of an image or particular areas of the image deemed relevant, in signal processing, a straightforward and common technique is the use of the contrast-brightness enhancement. Contrast and brightness simply increases the potency of the image data, and may or may not introduce bias when improving the visibility of an image. For instance, bias is only introduced when the wrong adjustment levels are applied, in which case it impairs visibility of areas of an image under study. It is important to know that contrast and brightness generally do not introduce bias when the right adjustments are applied. The right adjustments are so to enhance the visibility of the image. The aforementioned is the strategy adopted in the use of the contrast-brightness enhancement of the images in Figs. 5, 6 and 7. It is important to stress that the same adjustment was kept across the images so to enforce consistency in the interpretation of the results.
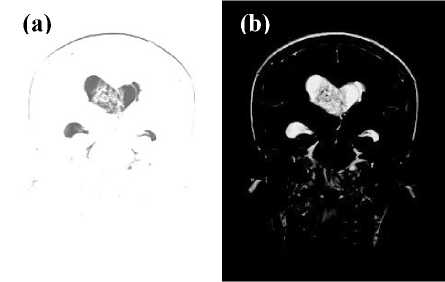
Fig.3. The image in (a) shows the result of the convolution (filtering) of the T2-weighted MRI (Fig. 1a) with the Classic-Curvature image (filter mask) shown in Fig. 1b. The image in (b) shows the result of the convolution (filtering) of the T2-weighted MRI (Fig. 1a) with the Signal Resilient to Interpolation image (filter mask) shown in Fig. 2. It is worth noting the supplemental information about the intra-ventricular tumor available through (a) and (b), to the one available through the T2-weighted MRI of Fig. 1a.
-
F. Filter Masks
Data of eleven subjects displaying various typologies of human brain tumors are presented in this paper. Each of the T2-weighted MRI is relevant to a different subject and has been processed with the methodology reported in section II of the manuscript. Thus, for each of the T2-weighted MRI, the filter masks were calculated with (2) and (3).
The next section of the manuscript presents pictures which show the effect of filtering the T2-weighted MRI with the two filter masks: (i) the Classic-Curvature and (ii) the Signal Resilient to Interpolation. Filtering is warranted by the mathematical procedure which is outlined in this section of the manuscript and which requires two properties.
One property is the second order differentiability of the model function (the existence of non-null and continuous second order partial derivatives of the function).
The other property is the existence of the non-null Classic-Curvature calculated at the pixel coordinate (x, y) = (0, 0).
Additional remarks are due in order to comment Fig. 4, where the filter masks of ten subjects are reported. The figure shows the Classic-Curvature and the Signal Resilient to Interpolation images calculated for each subject’s T2-weighted MRI (which is shown in Figs. 1, 5, 6 and 7). The intent of Fig. 4 is to display the filter masks as they are calculated through the formulae (2) (Classic-
Curvature) and (3) (Signal Resilient to Interpolation) without the use of any contrast-brightness enhancement.
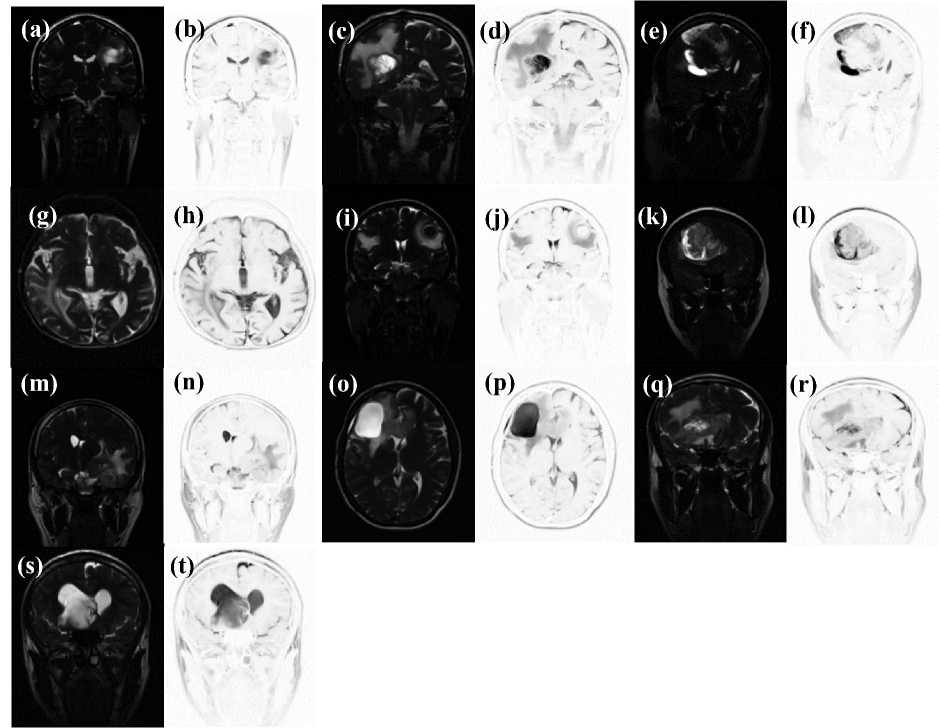
Fig.4. The Classic-Curvature and the Signal Resilient to Interpolation filter masks for ten subjects (the other subject’s images are reported in the methodology section). The Classic-Curvature images are in (a), (c), (e), (g), (i), (k), (m), (o), (q) and in (s). The Signal Resilient to Interpolation images are in (b), (d), (f), (h), (j), (l), (n), (p), (r) and in (t). The images are not contrast-brightness enhanced.
-
III. Results
In order to evaluate the results is important to stress on the following two definitions. The reliability of filtering is defined as the property of the filter mask to reproduce the original image features in the filtered image (through the convolution with the T2-weighted MRI). Moreover, the validity of filtering is defined as the property of the filtered images to reveal details of the human brain not observable in the T2-weighted MRI.
-
A. Evaluation of the Reliability and Validity of Filtering
This section evaluates the results presented in Fig. 5. In (a), (d), (g), (j), (m), (p), (s), (v), (y) and (z.2) is shown the T2-weighted MRI.
-
1) Reliability
We seek here for the capability of filtering, to reproduce the original image features in the filtered images. As far as regards filtering the T2-weighted MRI with the CC filter mask, the aforementioned capability is shown in the following images: (b), (e), (h), (k), (n), (t), (w), (z) and (z.3). The pathology is faithfully reproduced in the filtered images with different gray levels and the details of the tumor structure are clearly highlighted. For what pertains to filtering T2-weighted MRI with the SRI filter mask, the aforementioned capability is shown in the following images: (c) (see inside the ellipse), (f), (i), (l), (o), (r), (u), (x), (z.1), (z.4). The tumor is clearly distinguishable versus the surrounding anatomical structures. The cystic part of the tumor is neatly observable, delineated and demarcated in the filtered domain.
-
2) Validity
We seek here for the capability of the filtered images to show details of the human brain not observable in the T2-weighted MRI. In relationship to filtering the T2-weighted MRI with the CC filter mask, the aforementioned capability is shown in the following images: (e), (h), (k) (see inside the ellipses), (n) (see arrow), (q) (see inside the circle). The following images are relevant to filtering the T2-weighted MRI with the SRI filter mask, and they accomplish the aforementioned capability: (f) (see inside the ellipse), (z.1) (see inside the ellipse).
-
B. Expanded Study on the Validity of the Filter Mask
This section of the paper presents an overview and an expanded study on the two subjects which results are presented in Figs. 3 and 5. The aim of the study is to validate the Classic-Curvature and the Signal Resilient to Interpolation as filter masks. Fig. 6 shows the T2-weighted MRI slices of the case reported in Fig. 3 (see slices in the left most column of the figures). Slices 12, 13 and 15 through 18 (slice 14 was studied in Fig. 3) are shown together with: (i) the Classic-Curvature image (see second column from the left most column); (ii) the Signal Resilient to Interpolation (see third column from the left most column); (iii) the result of the convolution between the T2-weighted MRI and the Classic-Curvature image (see fourth column from the left most column); and (iv) the result of the convolution between the T2-weighted MRI and the Signal Resilient to Interpolation images (see right most column).
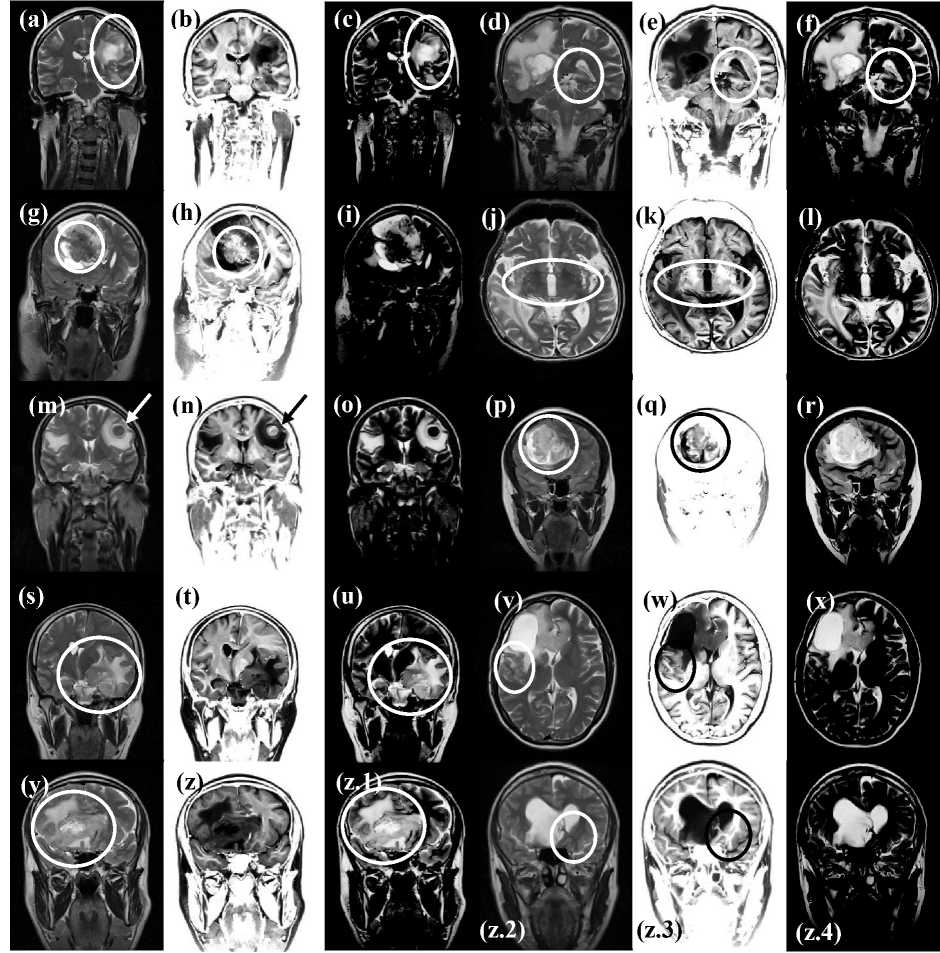
Fig.5. The subjects are imaged with T2-weighted MRI. The pathologies are: (a) brain metastases, (d) glioblastoma multiforme, (g) oligodendroglioma (see the region enclosed in the ellipse in (h), which is able to provide details not visible in (g)), (j) brain metastases, (m) brain metastases from pulmonary cancer, (p) anaplastic oligodendroglioma (see the region enclosed in the ellipse in (q) where the filtered domain yields additional (supplemental) information to the original domain from which is calculated), (s) meningioma, (v) cystic glioblastoma, (y) glioblastoma (see the finer details shown in (z.1) versus the T2-weighted MRI shown in (y)), (z.2) tumor with intra-ventricular extension). The images in (b), (e), (h), (k), (n), (q), (t), (w), (z) and in (z.3) show the result of the convolution between the T2-weighted MRI and the Classic-Curvature filter mask. The images in (c), (f), (i), (l), (o), (r), (u), (x), (z.1) and in (z.4) show the result of the convolution between the T2-weighted MRI and the Signal Resilient to Interpolation filter mask.
The Classic-Curvature images and the Signal Resilient to Interpolation images were not contrast-brightness enhanced, whereas to increase the potency, the filtered images resulting from the convolutions (fourth column from the left most, and the right most column) were contrast-brightness enhanced. The structures of the intraventricular tumor begin to be visible in the filtered images in slice 12 and continue to be visible through slice 18. Remarkably, the tumor structures are also visible in the filter masks: CC and SRI. Most notably, in the SRI filter masks.
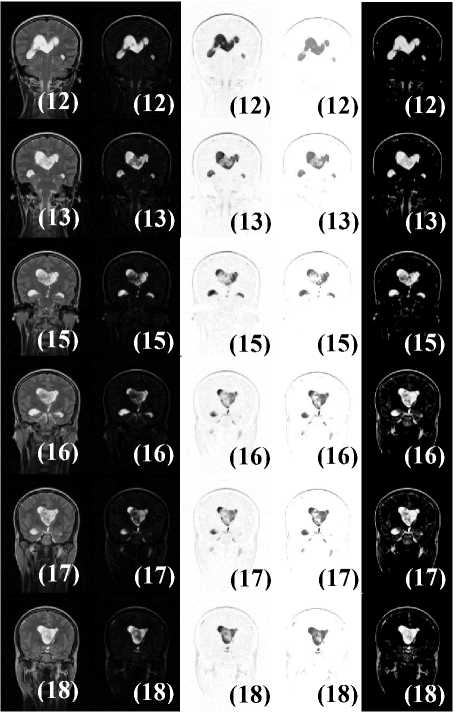
Fig.6. Slices 12, 13 and 15 through 18 of the case presented in Fig. 3; slice 14 was studied in Fig. 3. From left to right in each row: (i) the T2-weighted MRI, (ii) the Classic-Curvature image (filter mask), (iii) the Signal Resilient to Interpolation image (filter mask), (iv) the image obtained as a result of filtering the T2-weighted MRI with the ClassicCurvature, and (v) the image obtained as a result of filtering the T2-weighted MRI with the Signal Resilient to Interpolation.
However, when looking at slices 15 through 18 in Fig. 6, and comparing the filtered images (fourth column from the left most and right most column) versus the filter masks (second and third columns from the left most), what can be observed is higher definition of the tumor structures in the filtered images. In other words, the tumor structures appear blurred in the filter masks, whereas in the filtered images they appear well defined (see slice 15 in Fig. 6 for instance).
As far as regards the information provided through Fig. 6, it can be asserted that filtering with the ClassicCurvature and the Signal Resilient to Interpolation
Images is valid. Fig. 7 consists of an expanded study of the case reported in Fig. 5p and shows slices where the tumor appears. To assure potency, the filtered images resulting from the convolutions were contrast-brightness enhanced. The immediate observation that can be made on the basis of the images in Fig. 7 is that convolving the T2-weighted MRI with the Classic-Curvature image increases the visibility of the features of the tumor structures (see slice 18 and slices 20 through 26). The aforementioned observation adds up to the validity of the Classic-Curvature image as filter mask because the aim to perform feature extraction from the T2-weighted MRI is accomplished. As far as regards the Classic-Curvature images in Fig. 7 (see the image located in the middle of each triplet of images), they appear dark and they highlight only those tumor structures seen with the brightest gray levels in the T2-weighted images.
-
IV. Discussion
In our research, the word filtering assumes another meaning which is the quest for complementary and/or additional (more generally supplemental) information to the information provided by the images collected through the MRI scanner. Thus, what is accomplished in this piece of research is to post-process the MRI image (the T2-weighted in the specifics of this paper) with mathematical procedures aimed to perform feature extraction.
-
A. Reliability and Validity of the Filter Masks
To discuss the works herein presented is admissible to stress on the significance of the reliability and the validity of the filtering procedures. The reliability of the CC and the SRI filter masks signifies creating a novel imaging domain (the filtered MRI) where are reproduced the human brain and also features, characteristics and details of the tumor mass. Validity signifies capability of the filtered images to add supplemental information to that one already available in the T2-weighted MRI images. Indeed, the following figures presented in Fig. 5: (b), (e), (h), (k), (n), (t), (w), (z), and (z.3) show that the domain of the CC based filtered images has the following characteristics. (i) Well demarcated distinction between gray and white matter of the human brain, (ii) faithful reproduction of the human brain structures, (iii) well delineated reproduction of the structure of the tumor mass (although with different however effective gray scale), and (iv) clear separation between the tumor and the surrounding brain parenchyma. As far as regards the reliability of the SRI based filtered images, Fig. 5 shows the following examples: (c), (f), (i), (l), (o), (r), (u), (x), (z.1), and (z.4). The CC and the SRI images reported in [6] (which are filter masks in this work) have completely different appearance which is consequential to the usage of different model functions [6], and the different value of the parameter of the model function (1). As far as regards the validity of the CC and SRI filter masks, there are eight clear examples of feature extraction reported in previous sections of this manuscript. One example is shown in Fig. 3 where both of the filtered images add information about the intra-ventricular brain tumor shown in the T2-weighted MRI image of Fig. 1b. The other examples are reported in Fig. 5 in (e), (h), (k), (n) (q), (f) and (z.1). Remarkably, in Fig. 5q (see inside the circle) is possible to discern several details of the tumor structure, which are not observable in Fig. 5p.
-
B. Filtering the T2-weighted MRI
Additional discussion is needed in order to clarify to the reader: (i) what is accomplished through filtering T2- weighted MRI data, and (ii) why not to filter other MRI modalities. As far as regards the first question is concerned, the following is due to be recalled. MRI filtering is a well-regarded topic in the literature and is usually aimed to remove the low frequency components from the MRI images where the noise resides and also the noise determined through the field inhomogeneity which is seen in the MRI images especially at high and ultra-high magnetic fields [4, 5].
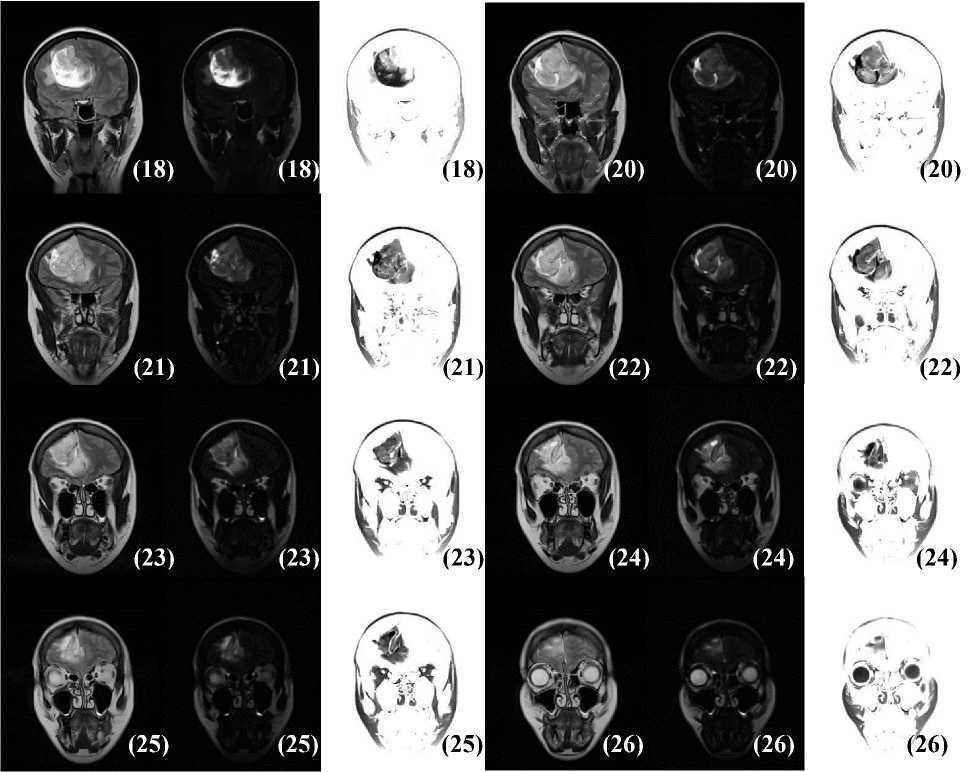
Fig.7. Slices from 18 through 26 of the case presented in Fig. 5p, with the exception of slice 19 (which was presented in Fig. 5p). From left to right, each triplet of images shows in each row: (i) the T2-weighted MRI, (ii) the Classic-Curvature image, and (iii) the image obtained filtering the T2-weighted MRI with the Classic-Curvature image. The convolution between the T2-weighted MRI and the Classic-Curvature image yields to a filtered image with increased level of details and this signifies validity for the Classic-Curvature image used as filter mask.
As far as regards the second question is concerned, it is due to explain as to why this research has chosen the T2-weighted MRI modality in order to test the filter masks, and not other MRI modalities like T1-weighted MRI, or contrast enhanced T1-weighted MRI, or Fluid Attenuated Inversion Recovery (FLAIR) MRI or other MRI modalities. To filter MRI modalities other than the T2-weighted is possible. In fact, Fig. 8 shows the results obtained when filtering the FLAIR MRI modality using the Classic-Curvature and the Intensity-Curvature Functional images [7] as filter masks. In Fig. 8 the
Classic-Curvature (CC) was calculated using a bivariate cubic polynomial [6] and the Intensity-Curvature Functional (ICF) was calculated using the bivariate linear model function [6].
The CC and the ICF Functional were used as filter masks to convolve the image shown in Fig. 8a, and so to obtain the filtered FLAIR shown in Fig. 8c and 8e respectively. Thus, Fig. 8 confirms that is possible to employ the methodology reported in this paper also for MRI imaging modalities other than the T2-weighted and also using different model functions. Moreover, the research presented in this paper is based solely on human brain tumors, however the novel approach reported can be applied to tumors affecting other structures of the human body. The approach is not always successful at revealing supplementary information from the human brain images and this fact is a shortcoming.
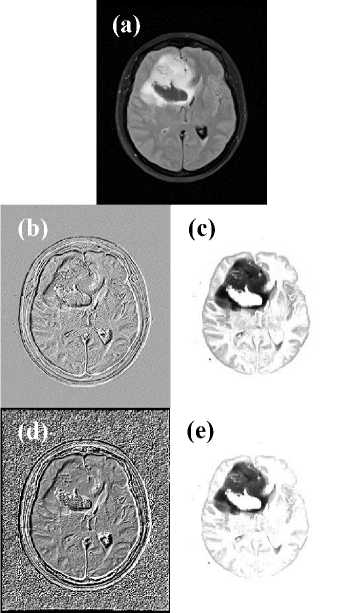
Fig.8. A Fluid Attenuated Inversion Recovery (FLAIR) MRI of a subject displaying the brain cancer diagnosed as anaplastic oligodendroglioma is shown in (a). The Classic-Curvature of the image shown in (a) is shown in (b), and the Intensity-Curvature Functional of the image shown in (a) is presented in (d). The filtered images are shown in (c) and in (e) and they were obtained convolving the image in (a) with the images in (b) and in (d) respectively.
-
C. Diffusion Tensor Imaging, T2-weighted MRI and the Human Brain Water
Diffusion Tensor Imaging (DTI) measures the diffusion of the water molecules inside the white matter fiber tracks [8, 9]. However, because the partial volume effect [10] and the assumption of Gaussian diffusion, DTI also suffers of limitations. DTI offers efficiency when used together with fMRI [9]. The measurement of the water diffusion which is offered by DTI is quantified through the estimation of the diffusion tensor. The Diffusion tensor comprises of six parameters (six independent scalar elements), and from the parameters it is possible to calculate three eigenvectors indicating the diffusion direction and three eigenvalues which are also known to represent the Anisotropic Diffusion Coefficients (ADCs) [11, 12]. Comparison between DTI and T2-weighted imaging, within the context of the study of stroke patients, has shown that DTI offers degree of variability of the ACDs in regions where the T2-weigthed images show imaging homogeneity [13].
An application of DTI reports that there exists difference between the diffusivity of the white matter and the diffusivity of the gray matter [14]. Probabilistic atlases of the human brain were developed [15-18] and they provide great mapping of the tissues and therefore provide with the possibility to localize water in the human brain. Additionally, DTI has revealed that the water diffusion in the white matter of the human brain is anisotropic and the magnitude of the anisotropy and the direction along which the water diffuses can be quantified so to provide the users of DTI information about the architecture of the white matter in the human brain [19]. Moreover, DTI offers the possibility to infer quantitatively the conductivity of the human brain tissues through the water diffusion tensor. The aforementioned task was accomplished in two steps: one is the estimate of the statistical moments of the tissue structure from the diffusion tensor; and the other one is the estimation of the conductivity from the moments [20].
The aforementioned findings suggest the capability of DTI to be more efficient than T2-weighted MRI in unveiling the water diffusion in human brain stroke regions and suggest also the possibility to use the filtering procedure here presented to filter DTI-MRI.
-
V. Conclusion
This paper proposes a novel approach to filter T2-weighted MRI images of human brain tumors. Filtering is aimed to search for supplemental information related to tumors detected with T2-weighted MRI. The methodology proposes two filter masks: (i) the ClassicCurvature image [21] and (ii) the Signal Resilient to Interpolation image. To calculate the filter masks a model function is fitted to the T2-weighted MRI data. From the model function, a mathematical procedure is developed so to obtain the filter masks. Results indicate that postprocessing the T2-weighted MRI data with the filter masks is reliable because of the reproduction of both of the tumor and the surrounding human brain structures. And, post-processing the T2-weighted MRI data is also valid because is capable to provide with highlights on some features of interest of the tumor.
Acknowledgment
The MRI scanning procedures were conducted in compliance with the ethical standards set by the General Hospital 8-mi Septemvri, Skopje – Macedonia, which is the institution where the patients were diagnosed.
Список литературы A Novel Approach to T2-Weighted MRI Filtering: The Classic-Curvature and the Signal Resilient to Interpolation Filter Masks
- G. Gerig, O. Kubler, R. Kikinis, and F.A. Jolesz, "Nonlinear anisotropic filtering of MRI data", IEEE Transactions on Medical Imaging, vol. 11, no. 2, pp. 221-232, 1992.
- S. Rice, "S. Mathematical analysis of random noise", Bell System Technical Journal, vol. 23, no. 3, pp. 282-332, 1944.
- D. Gensanne, G. Josse, J.M. Lagarde, and D. Vincensini, D. "A post-processing method for multiexponential spin-spin relaxation analysis of MRI signals" Physics in Medicine and Biology, vol. 50, no. 16, pp. 3755-3772, 2005.
- E. Fischi Gomez, "Inhomogeneity correction in high field magnetic resonance images: human brain imaging at 7 Tesla", M.S. thesis, Universitat Politècnica de Catalunya, Barcelona, Spain, 2008.
- U. Vovk, F. Pernuš, and B. Likar, "A review of methods for correction of intensity inhomogeneity in MRI", IEEE Transactions on Medical Imaging, vol. 26, no. 3, pp. 405-421, 2007.
- C. Ciulla, D. Veljanovski, U. Rechkoska Shikoska, and F.A. Risteski, "Intensity-curvature measurement approaches for the diagnosis of magnetic resonance imaging brain tumors", Journal of Advanced Research, vol. 6, pp. 1045-1069, 2015.
- C. Ciulla, "Improved signal and image interpolation in biomedical applications: the case of magnetic resonance imaging (MRI)", Medical Information Science Reference, IGI Global Publisher, Hershey, PA, USA, 2009.
- M. Catani, R.J. Howard, S. Pajevic, and D.K. Jones, "Virtual in vivo interactive dissection of white matter fasciculi in the human brain", NeuroImage, vol. 17, pp. 77–94, 2002.
- M. Soret, S.L. Bacharach, and I. Buvat, "Partial-volume effect in PET tumor imaging", Journal of Nuclear Medicine, vol. 48, pp. 932-945, 2007.
- Y. Assaf, and O. Pasternak, "Diffusion tensor imaging (DTI)-based white matter mapping in brain research: A review", J. Mol. Neurosci., vol. 34, pp. 51-61, 2008.
- C. Pierpaoli, P. Jezzard, P.J. Basser, A. Barnett, and G. Di Chiro, "Diffusion tensor MR imaging of the human brain", Radiology, vol. 201, no. 3, pp. 637-648, 1996.
- S. Pajevic, and C. Pierpaoli, "Color schemes to represent the orientation of anisotropic tissues from diffusion tensor data: Application to white matter fiber tract mapping in the human brain", Magnetic Resonance in Medicine, vol. 42, pp. 526-540, 1999.
- D. Chien, K.K. Kwong, D.R. Gress, F.S. Buonanno, R.B. Buxton, and B.R. Rosen, "MR diffusion imaging of cerebral infarction in humans". AJNR, vol. 13, pp. 1097-1102, 1992.
- C.A. Clark, M. Hedehus, and M.E. Moseley, "In vivo mapping of the fast and slow diffusion tensors in human brain", Magnetic Resonance in Medicine, vol. 47, no. 4, pp. 623-628, 2002.
- P.M. Thompson, and A.W. Toga, "Detection, visualization and animation of abnormal anatomic structure with a deformable probabilistic brain atlas based on random vector field transformations" Medical Image Analysis, vol. 1, no. 4, pp. 271-294, 1997.
- J.L. Lancaster, L.H. Rainey, J.L. Summerlin, C.S. Freitas, P.T. Fox, A.C. Evans, A.W. Toga, and J.C. Mazziotta. "Automated labeling of the human brain: A preliminary report on the development and evaluation of a forward-transform method", Human Brain Mapping, vol. 5, no. 4, pp. 238-242, 1997.
- J.L. Lancaster, M.G. Woldorff, L.M. Parsons, M. Liotti, C.S. Freitas, L. Rainey, P.V. Kochunov, D. Nickerson, S.A. Mikiten, and P.T. Fox, "Automated Talairach atlas labels for functional brain mapping", Human Brain Mapping, vol. 10, no. 3, pp. 120-131, 2000.
- J. Mazziotta, A. Toga, A. Evans, P.T. Fox, J. Lancaster, K. Zilles, R. Woods, et al., "A probabilistic atlas and reference system for the human brain: International consortium for brain mapping (ICBM)", Philosophical Transactions of the Royal Society of London, Series B: Biological Sciences, vol. 356, no. 1412, pp. 1293-1322, 2001.
- B. Stieltjes, W.E. Kaufmann, P.C.M. van Zijl, K. Fredericksen, G. D. Pearlson, M. Solaiyappan, and S. Mori, "Diffusion tensor imaging and axonal tracking in the human brainstem", NeuroImage vol. 14, pp. 723-735, 2001.
- D.S. Tuch, V.J. Wedeen, A.M. Dale, J.S. George, and J.W. Belliveau, "Conductivity tensor mapping of the human brain using diffusion tensor MRI", PNAS, vol. 98, no. 20, pp. 11697–11701, 2001.
- G. Agyapong, "Calculation of the classic-curvature and the intensity-curvature term before interpolation of a bivariate polynomial", International Journal of Information Engineering and Electronic Business, vol. 7, no. 6, pp. 37-45, 2015.
