A Novel CatML Stacking Classifier Based Intelligent System for Predicting Postgraduate Admission Chances: A Study on Bangladesh

Author: Abu Kowshir Bitto, Md. Hasan Imam Bijoy, Aka Das, Jannatul Ferdousi, Afsana Begum, Imran Mahmud
Journal: International Journal of Modern Education and Computer Science @ijmecs
Article in issue: 4 vol.17, 2025.
Free access
This paper introduces an intelligent tool with a novel CatML stacking classifier designed to enhance predictive analytics for postgraduate university admission chances. The proposed classifier uses the CatBoost algorithm as a core component of the stacking ensemble method, which integrates CatBoost and Multi-Layer Perceptron (MLP) learners to improve predictive performance. The dataset comprises 13 questionnaire-based surveys, including academic records, standardized test scores (i.e., GRE, IELTS/TOEFL), publication status, extracurricular activities, recommendation letters, and personal statements from Bangladeshi students who applied to various U.S. postgraduate programs. Experimental results demonstrate that the CatML stacking classifier outperforms conventional models, achieving superior accuracy (88.14%) and robustness in predicting admission outcomes. The enhanced performance is attributed to the model’s ability to capture complex, non-linear relationships within the data, facilitated by the CatBoost algorithm's handling of categorical features and prevention of overfitting. Finally, this model deploys in a web system developed with HTML, CSS, JavaScript and Flask. This research underscores the efficacy of advanced ensemble techniques in educational data mining and provides a valuable intelligent tool for students aiming to navigate the complexities of U.S. postgraduate admissions. The CatML stacking classifier offers significant improvements in predictive analytics, thereby assisting students in making informed application decisions.
Predictive Analytics, Postgraduate Admissions, Admission Probability, Intelligent Prediction Tool
Short address: https://sciup.org/15019906
IDR: 15019906 | DOI: 10.5815/ijmecs.2025.04.06
Text of the scientific article A Novel CatML Stacking Classifier Based Intelligent System for Predicting Postgraduate Admission Chances: A Study on Bangladesh
In an increasingly interconnected world, pursuing higher education beyond national borders has become prevalent [1]. The allure of studying abroad is multifaceted, encompassing the desire to explore new destinations [2], understand diverse cultures [3], and attain a global perspective [4]. This inclination is not merely about geographical mobility [5]; it's an endeavor towards personal and academic enrichment [6]. The transformative journey of studying abroad extends beyond academic learning, as it offers students the invaluable opportunity to develop intercultural communication skills, improve career prospects, and foster a global mindset [7]. Immersing in different educational and cultural setting, students learn new languages, appreciate diverse customs, and grow in independence, thereby enhancing their adaptability [8], problem-solving skills, and personal growth.
The United States is a prominent destination for international students, attributed to its renowned universities and diverse educational programs [9]. However, gaining admission into these institutions entails navigating complex requirements. These prerequisites, varying across universities and programs, typically include the provision of personal information, academic transcripts, standardized test scores (e.g., SAT, ACT, GRE, GMAT), proficiency in English (TOEFL, IELTS), essays, recommendations, and valid passports [10]. Additionally, details on extracurricular activities [11], proof of financial means, resumes, and potential interviews are crucial. Applicants must also confirm financial eligibility [12] and, upon admission, secure a student visa while adhering to stringent timelines and specific requirements of their chosen programs.
Within this context, evaluating academic performance emerges as a pivotal process. It serves as a dual-purpose tool, enabling students to assess their capabilities and areas for improvement while also allowing educators and institutions to gauge the efficacy of their pedagogical strategies [13]. This evaluation, encompassing assessments and feedback, is integral in measuring knowledge, skills, and aptitudes [14]. Regularly monitoring student progress is essential, providing educators with insights into student achievements and identifying areas necessitating additional support.
In recent times, machine learning has revolutionized the landscape of higher education admissions. Machine learning models, analyzing data from structured application forms, including undergraduate GPAs and standardized test scores, are increasingly employed to predict admission outcomes [15]. These models adeptly combine various application components, offering insights into the decision-making process for accepting or rejecting applications. Their capabilities extend to aligning admission offers with student enrollment probabilities, predicting university admission rates, and enhancing student success in higher education. These models are also increasingly used for assessing educational data and supporting graduate admissions, providing a more nuanced and data-driven approach to evaluating prospective students [16]. Furthermore, applying predictive analytics models, particularly in disciplines like engineering and computing, has shown considerable promise in streamlining the admission and enrollment processes [17].
The journey towards higher study admission involves several key decisions and steps. It begins with gathering information about various programs and universities. There are two main paths: one for those who meet admission requirements and one for those who don't. If you meet the criteria, you assess your eligibility for higher study admission. If not, you explore alternatives. Eligible applicants then thoroughly check program and university requirements to ensure their goals align with their chosen options. Figure 1 illustrates this decision process, highlighting how informed choices, eligibility assessments, and exploration guide individuals towards advanced education opportunities.
This paper focus into the application of machine learning and predictive analytics in higher education admissions [18, 19, 20, 21], exploring their role in evaluating the likelihood of entry into U.S. universities for international students. It underscores these technological tools’ transformational impact on the admissions landscape, reshaping how educational institutions assess, select, and support their future student bodies. It is not easy to study abroad with appropriate guidelines. In this, an application has been described to check the user’s probability of admission to the USA for higher study.
We commenced by providing an all-inclusive literature review and contribution to knowledge in Section. 2. We provide the methodology in section 3, which involves data collection, the developed machine leaning model, and the implementation flowchart. It is followed by the provision of detailed results and discussion. In Section 4, provide the performance results, comparison of results and developed system. The concluding part of the work is described in section 5.
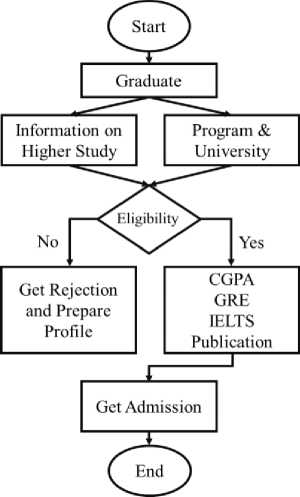
Fig. 1. Step by step process of enrolling post graduate program in abroad.
2. Literature Review
The global competition in higher education has intensified, making the prediction of admission probabilities a critical area of study for both applicants and institutions. This literature review examines existing research and methodologies related to predictive analytics for university admissions, with a particular focus on machine learning techniques and their applications.
2.1. Predictive Validity of Admission Assessments
2.2. Decision-Making Models in Higher Education
2.3. Predictive Analytics in Student Performance and Retention
2.4. Emerging Trends in AI and Machine Learning
3. Methodology
Liberatore et al. [25] delve into using the Analytic Hierarchy Process (AHP) for group decision-making in higher education, particularly in evaluating academic papers and strategic planning and the suggested approach is illustrated using a case study that considers the evaluation of academic research papers at Villanova University. Rigol et al [26] use a decision tree algorithm where several conditions for particular factors (GPA, Class Rank), SAT I, SAT II, Senior year course, Course Load, Curriculum Quality, Program Rigor, recommendations, essay, personal quality/ characters, etc.) Academic quality rating is provided to each student, then sorted and chosen the best out of them and shown different examples to evaluate students. William Ho et al. [27] conducted a literature review on Multiple Criteria Decision-Making (MCDM) techniques in higher education, touching upon resource allocation, performance measurement, and more, providing insights into current trends and gaps.
Gil et al. [28] employ data mining techniques to forecast academic success in Portuguese higher education institutions. They highlight the role of socio-demographic factors, previous academic performance, and age in predicting educational outcomes. Manuela Ekowo et al. [29] discuss using predictive analytics in higher education for student retention and resource management while addressing ethical concerns and potential data misuse. Ömer Faruk Akmeşe et al. [30] utilise machine learning techniques, notably the Random Forest algorithm, to predict academic achievement in distance education, suggesting its utility in educational planning. Deepti Aggarwal et al. [31] focus on the impact of non-academic parameters in predicting student performance, finding that their inclusion enhances the accuracy of ensemble learning models.
Kuleto et al. [32] investigate the integration of AI and ML in higher education, surveying data of 103 students from Serbia, Information Technology School ITS- Belgrade to gauge their understanding and attitudes towards these technologies. Yan et al. [33] developed a machine learning ensemble model for student recommendations in academic competitions, demonstrating its efficacy and providing practical insights for student selection. Davidovitch et al. [34] critique traditional admission policies in Israel, advocating for a more holistic approach that addresses transparency and equity issues in student selection. Stowell et al. [35] discuss the complexities in higher education assessment and decision-making, emphasising the importance of fairness and equity in evaluating student performance.
This research initiative, which aimed to forecast admission prospects for graduate school in the United States, namely for master’s programs, took a thorough and creative approach to address the problems with conventional approaches.
Data Collection
13 Questionnaires based Survey
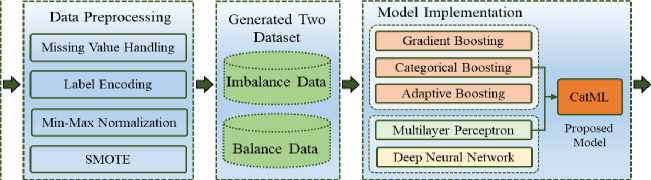
Fig. 2. The working procedure diagram of this work.
A thorough survey with well-chosen questions is used to start the process. We then use strategic strategies to pick features and deal with missing values to improve the quality and dependability of our dataset. The data is further optimized for modelling by adding a level encoder for text values and feature scaling. After train-test split, we then use a two-pronged approach both machine learning and deep learning models. Then again, we use SMOTE (Synthetic Minority Over-sampling Technique) and ‘GridSearchCV’ into our workflow to address class imbalance and ensure a more representative dataset. Then applying machine learning, deep learning, and ensemble learning approaches after SMOTE. Lastly, our approach is guided by a thorough assessment of performance measures, which enables us to precisely determine the efficacy of our predictive models. To make our research findings more widely accessible, we have created an interactive website where users may enter their information and receive customized admissions probability forecasts. Figure 2 provides a graphic depiction of the connected and sequential processes in our novel methodology, summarizing the complete process.
-
3.1. Data and Data Preprocessing
Our questionnaire uses a systematic method of sampling with each question posed to gather specific information that shall be helpful to predict admission possibilities for higher studies in the USA, i.e., master courses. The questionnaire contains diverse segments such as background education, examination scores, selected subjects, job experience, publications of research papers, self-appraised level of effort, university rankings, and past employment designations. Before designing the survey, we undertook a stringent review of existing literature in this field [34, 38] and devised our questions about both existing literature as well as in-house research expertise. We obtained informed consent from all participants before data collection, ensuring compliance with ethical standards for privacy and confidentiality. This stringent approach ensures that our data set encompasses a broad array of factors influencing admission outcomes, enhancing the validity and generalizability of our prediction models. Knowing that having good quality, relevant data is crucial in performing good data analysis, we placed additional emphasis on survey design and data quality. Data were collected from Bangladeshi master's students who are presently in the United States. The survey was conducted through the "Next Stop USA" Facebook group, targeting members who were already past the admission process. 200 data points were collected. The data set has both categorical data (such as gender, undergraduate university, study department, and prior work experience) and numerical data (such as CGPA, GRE scores, IELTS/TOEFL scores, research experience, effort levels as perceived by oneself, universities applied for, and admission outcome). In terms of data quality, we applied a multi-stage cleaning and validation process. We first screened the responses for completeness and consistency and removed any records with heavy missing values or conflicting information. Second, we normalized categorical values (e.g., institution names and subject matter) and normalized numeric variables as necessary to make them consistent. Third, we conducted an outlier analysis to catch and resolve any data points that could disproportionately affect the outcomes. This rigorous cleaning process ensures usability and reliability of the final dataset. The survey that we designed is presented in Table 1, and Figure 3 illustrates the correlations among all the most important variables that were considered in the research. The primary goal of this research is to compare the performance of various classification algorithms for predicting admission outcomes and to identify the most important factors for future Bangladeshi students who are interested in studying in the USA.
Table 1. Survey questionnaires.
|
No. |
Questions |
|
1 |
Your Name? |
|
2 |
Your Gender? |
|
3 |
Undergraduate university where you pursuing bachelor's degree? |
|
4 |
What was your undergraduate CGPA? |
|
5 |
What was your score in GRE? |
|
6 |
What was your score in IELTS/TOEFL? |
|
7 |
Which subject you got the opportunity to study? |
|
8 |
Work experience before admitted? |
|
9 |
Before admittance, how many publications in Journal/Conference did you have? |
|
10 |
Level of self-effort for admission? |
|
11 |
University ranking that you applied? |
|
12 |
Got chance or not? |
|
13 |
If you’re interested, you may add your work position if you have before your admission? |
Table 2 shows the statistical analysis of the dataset that reveals several important characteristics [36]. The gender distribution in the dataset is slightly skewed towards males, with a mean of 0.69. This suggests a moderate level of variability in gender. For undergraduate university, the average value of 22.48 indicates a broad range of institutions. The high variance and standard deviation (12.50) reflect significant variability among the universities attended by respondents. The undergraduate CGPA distribution spans from 0 to 80, indicating a wide range of academic performance. The substantial standard deviation (21.26) highlights the diversity in CGPA scores. GRE scores have an average of 25.04, with a standard deviation of 10.17, suggesting moderate variability in the scores. IELTS/TOEFL scores range from 0 to 33, with an average of 16.78. The standard deviation (8.04) indicates a moderate level of variability in these scores. The “Subject Got Chance” features exhibit diversity, with an average value of 9.54 and considerable variability. Work experience is relatively low on average (0.62), with moderate variability among respondents. Research involvement has an average count of 2.45, indicating some level of research experience. The moderate standard deviation suggests variability. The self-effort level (“Effort”) has an average value of 1.85, with moderate variability. University ranking diversity is evident, with an average ranking of 3.31 and a notable standard deviation (2.81). The dataset shows a slightly positive skew for admission chances (mean of 0.74), with moderate variability. Work positions before admission exhibit a consistent average of 12.02, with limited variability. The dataset encompasses diverse features with varying levels of variability, providing valuable insights into the distribution and characteristics of each feature.
Table 2. Statistics analysis of attributes.
|
Attributes |
Count |
Mean |
Min |
25% |
50% |
75% |
Max |
Variance |
Standard Deviation |
|
Gender |
200.0 |
0.690 |
0.0 |
0.00 |
1.0 |
1.00 |
1.0 |
0.214975 |
0.463654 |
|
Undergraduate University |
200.0 |
22.480 |
0.0 |
8.00 |
22.0 |
37.25 |
40.0 |
156.3413 |
12.50365 |
|
Undergraduate CGPA |
200.0 |
45.610 |
0.0 |
29.75 |
45.5 |
64.00 |
80.0 |
452.1385 |
21.26355 |
|
GRE |
200.0 |
25.040 |
0.0 |
19.00 |
25.0 |
32.00 |
47.0 |
103.4556 |
10.17131 |
|
IELTS/TOEFL |
200.0 |
16.775 |
0.0 |
9.75 |
17.0 |
23.25 |
33.0 |
64.57726 |
8.035998 |
|
Subject got chance |
200.0 |
9.535 |
0.0 |
3.75 |
7.0 |
13.00 |
26.0 |
54.89324 |
7.408997 |
|
Work experience |
200.0 |
0.615 |
0.0 |
0.00 |
1.0 |
1.00 |
1.0 |
0.237965 |
0.487816 |
|
Research |
200.0 |
2.455 |
0.0 |
1.00 |
2.0 |
4.00 |
11.0 |
5.203995 |
2.281227 |
|
Effort |
200.0 |
1.845 |
0.0 |
0.00 |
2.0 |
3.00 |
4.0 |
2.603995 |
1.613690 |
|
Ranking |
200.0 |
3.315 |
0.0 |
1.00 |
3.0 |
5.00 |
9.0 |
7.915352 |
2.813423 |
|
Work position before admission |
200.0 |
12.020 |
0.0 |
12.00 |
12.0 |
12.00 |
19.0 |
5.386533 |
2.320890 |
|
Chance |
200.0 |
0.735 |
0.0 |
0.00 |
1.0 |
1.00 |
1.0 |
0.195754 |
0.442441 |
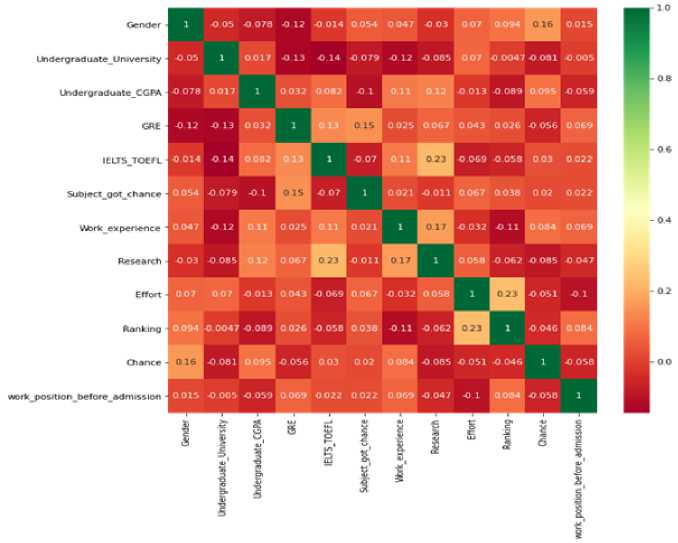
Fig. 3. Corelation matrix.
-
3.2. Min-Max Scaling for Numerical Uniformity
-
3.3. Label Encoding for Categorical Representation
-
3.4. SMOTE
To ensure uniformity and comparability across numerical features, we applied Min-Max Scaling [37]. This transformative technique rescaled the numerical data, placing all variables within a standardized range while preserving their relative proportions. This step is pivotal to mitigate the impact of varying scales, thereby enhancing the performance of subsequent machine learning algorithms. The standard formula of min-max scaling is:
X-Xmin
Хмах -Xmin
Recognizing the need for numerical representation of categorical variables, we employed Label Encoding on our text data [38]. This conversion facilitated the seamless integration of categorical features into our predictive models. Subsequently, to maintain consistency in the dataset, we extended the Min-Max Scaling technique to these newly transformed numerical representations.
In recognition of the paramount significance of a balanced dataset for robust model training, we strategically incorporated the Synthetic Minority Over-sampling Technique (SMOTE) [39] into our preprocessing framework. The inherent challenge of imbalanced datasets, where certain classes may be underrepresented, can significantly impact the performance and fairness of machine learning models. SMOTE addresses this imbalance by intelligently synthesizing minority class samples, thereby rectifying the skewed class distribution and enhancing the model's ability to discern patterns across all classes.
SMOTE operates by intelligently synthesizing minority class samples, rectifying the skewed class distribution, and bolstering the model's ability to discern patterns across all classes. The SMOTE equation for binary classification is given by
у
^new
= Xi + X (xzi-Xi)
Where, xi is represents an instance from the minority class, xzi is represents one of its k nearest neighbours and α is a random number between 0 and 1.
-
3.5. GridSearchCV
-
3.6. Model Description
-
3.6.1. Gradient Boosting
GridSearchCV is a method for systematically tuning hyperparameters in machine learning models by exhaustively searching through a predefined grid of hyperparameter values. It performs cross-validated evaluations for each combination, ensuring a comprehensive exploration of the hyperparameter space and providing insights into model sensitivity. This automated approach optimizes a specified performance metric, such as accuracy or F1 score, avoiding overfitting to specific data subsets. GridSearchCV is versatile, applicable to various algorithms, and implemented conveniently in libraries like scikit-learn, offering an efficient and standardized way to enhance model performance. Figure 4 shows GridSearchCV [35] technique for our research.
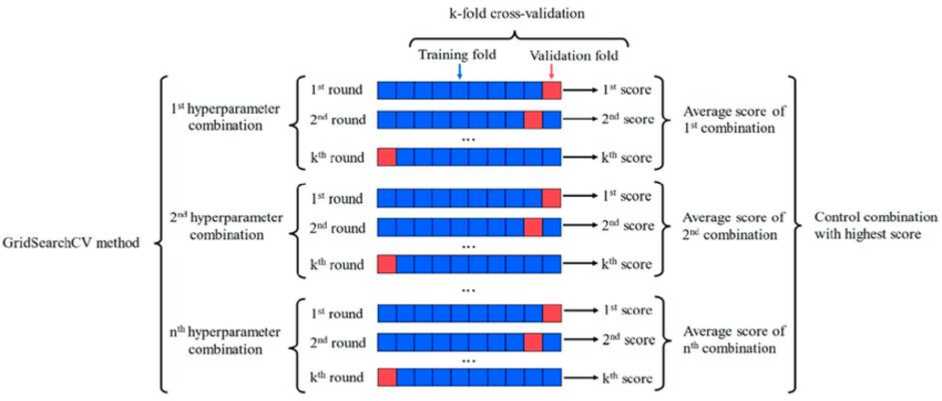
Fig. 4. The architecture of ‘GridSearchCV’ technique for this study.
Accurately predicting admission chances for higher studies, our approach involves the implementation of a diverse set of algorithms. For our classification task, we have strategically applied a combination of machine learning, deep learning, and ensemble techniques.
Gradient Boosting stands out as a robust boosting algorithm that amalgamates multiple weak learners to form a potent ensemble. In this iterative process, each new model is intricately trained to minimize the loss function, such as mean squared error or cross-entropy, of the preceding model by leveraging gradient descent. At every iteration, the algorithm calculates the gradient of the loss function concerning the predictions made by the existing ensemble. Subsequently, a new weak model is trained to minimize this gradient, and its predictions are integrated into the ensemble. This cyclic process continues until a predefined stopping criterion is satisfied, yielding a strong learner with enhanced predictive capabilities. The algorithm’s equation is:
F(x)= F0(x)+ 2% Vmhm(x) (3)
Here, F(x) is the final prediction for a given input x; F_0(x) is the initial prediction, typically a constant value; M is the total number of weak learners; γ_m is the learning rate for the mth weak learner; and h_m(x) is the prediction of the mth weak learner for a given input x.
-
3.6.2. Categorical Boosting
-
3.6.3. Adaptive Boosting
-
3.6.4. Multi-Layer Perceptron
Categorial Boosting (CatBoost) is a high-performance gradient boosting algorithm that effectively handles categorical data without requiring one-hot encoding. It utilizes ordered boosting, random permutations, and gradientbased optimization to achieve superior performance on large and complex datasets. The algorithm’s equation is:
Minimize : E^ =1} L(yb F Xx)) +/2(F) (4)
Here, L(y i , F(x i )) represents the loss function for the ith data point; Q(F) represents a regularization term that penalizes the complexity of the model; and F(x) represents the prediction function.
Adaptive Boosting (AdaBoost), is a robust machine learning algorithm that combines multiple weak learners to create a strong classifier. It iteratively trains weak learners, focusing on misclassified examples from previous iterations, by assigning higher weights to these challenging cases. This process ensures that subsequent learners pay more attention to these examples, improving overall performance. The algorithm’s equation is:
Final Prediction = F(at* h^))
Multi-Layer Perceptron (MLP) are neural networks with interconnected nodes organized into input, hidden, and output layers. Information flows from input to output through hidden layers. Each neuron performs a weighted sum of its inputs and applies an activation function to produce an output. Backpropagation adjusts weights and biases to minimize the error between predicted and actual outputs. The architecture of MLP is shown in Figure 5.
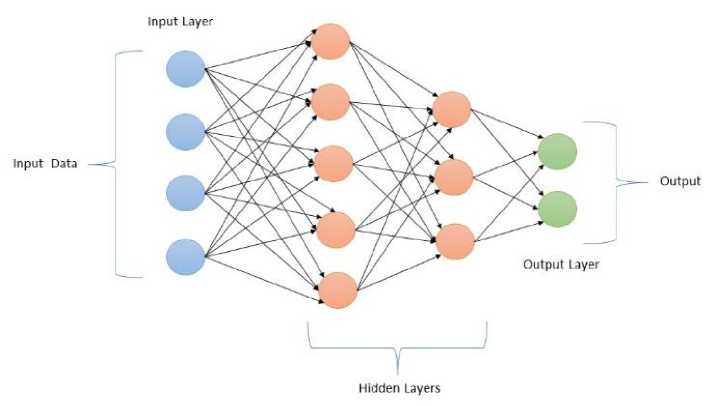
Fig. 5. The architecture of Multi-Layer Perceptron.
-
3.6.5. Deep Neural Networks
-
3.6.6. Proposed: Categorial Boosting-Multi-Layer Perceptron (CatML)
Deep neural networks (DNNs) are a type of artificial neural network (ANN) that consists of multiple layers of interconnected nodes or neurons. DNNs are able to learn complex patterns in data by passing information through multiple layers, each applying a weighted sum of inputs and an activation function. The weights and biases of these connections are adjusted during training using a process called backpropagation, minimizing the error between predicted and actual outputs. The architecture of DNN is shown in Figure 6.
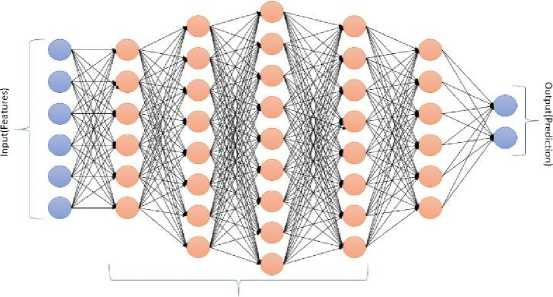
Hidden layers
Fig. 6. The architecture of Deep Neural Network.
Our new ensemble model combines the strengths of two distinct machine learning algorithms: Categorial Boosting (CatBoost) and Multi-Layer Perceptron (MLP). This synergistic approach aims to enhance predictive accuracy and robustness for Bangladeshi master’s student admission in the United States. Each individual model contributes its unique expertise: CatBoost excels in categorical feature handling, while MLP brings deep learning capabilities to discern subtle relationships. By harnessing the collective intelligence of these algorithms, the ensemble model provides a more comprehensive and accurate understanding of the factors influencing admission outcomes. The architecture of CatMl is shown in Figure 7.
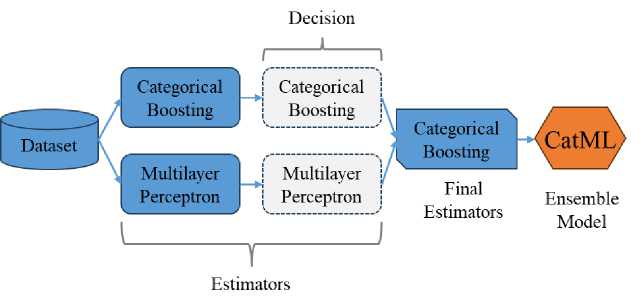
Fig. 7. The architecture of the proposed ensemble model.
-
3.7. Performance Measuring
-
3.8. Accuracy
-
3.9. Precision
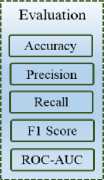
The calculated models are evaluated and compared based on their prediction errors. In our study, we assess accuracy, precision, recall, and the F1 score to measure the performance of the new ensemble model with others model we applied.
In machine learning classification algorithms, accuracy measures the proportion of correctly predicted data points. The model with the highest accuracy is considered the best predictor. Accuracy is also referred to as the error rate. It is calculated by dividing the number of correct predictions by the total number of predictions. The equation of Accuracy is:
. True Positive+True Negative
=
All Instance
Precision, also known as positive predictive value, measures the proportion of identified positive cases that are correct. In other words, it calculates the accuracy of positive predictions. It represents the fraction of relevant instances among the retrieved instances and is calculated from the confusion matrix. The equation of Precision is:
=
True Positive
True Positive+False Positive
-
3.10. Recall
-
3.11. F1 Score
Recall, commonly used in conjunction with precision, refers to the ratio of correctly identified positive instances by the classifier. It represents the ability of the model to accurately identify true positives. The equation of Recall is:
True Positive
True Positive+False Negative
The F1 score, also known as the F measure or F-score, is the harmonic mean of precision and recall. It assigns more weight to lower values, making it favorable for classifiers that exhibit similar recall and precision. The equation of F1 Score is:
1 S С О Г е = --------------
Precision+Recall
4. Results and Discussion
Admission to the United States is contingent on several criteria. We conducted a poll on the Facebook group “Next Stop USA” using questionaries that we prepared after reading many research papers. The data we collected there are 200 rows in all, with 12 columns, including prediction columns after pre-processing. We conducted all the experiments on a configuration of AMD Ryzen 5 3400G 4-core, 3.7 GHz Processor. The operating system is Windows 11 Home, with 16 GB RAM and 2 GB integrated GPU with processor.
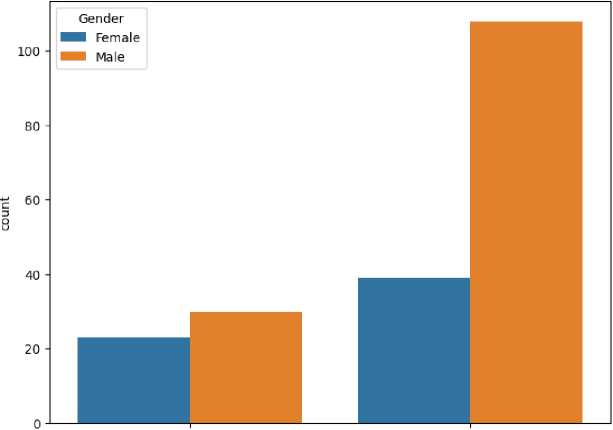
From Figure 8, we observe the impact of gender on the distribution of chance values. It shows the distribution of chances categorized by gender. It is evident that females have fewer instances of a chance value of 0 and more instances of a chance value of 1 compared to males. This differentiation may imply gender-related variations in the factors contributing to success. The data we collect reflects based on this. From our data, most of the participants was male compared to female.
Distribution of Chance by Gender
о i
Chance
Fig. 8. Distribution of Chance by Gender.
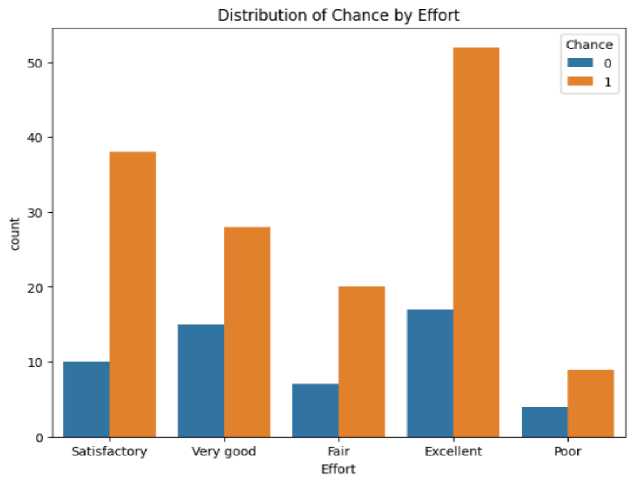
Fig. 9. Distribution of Chance by Gender.
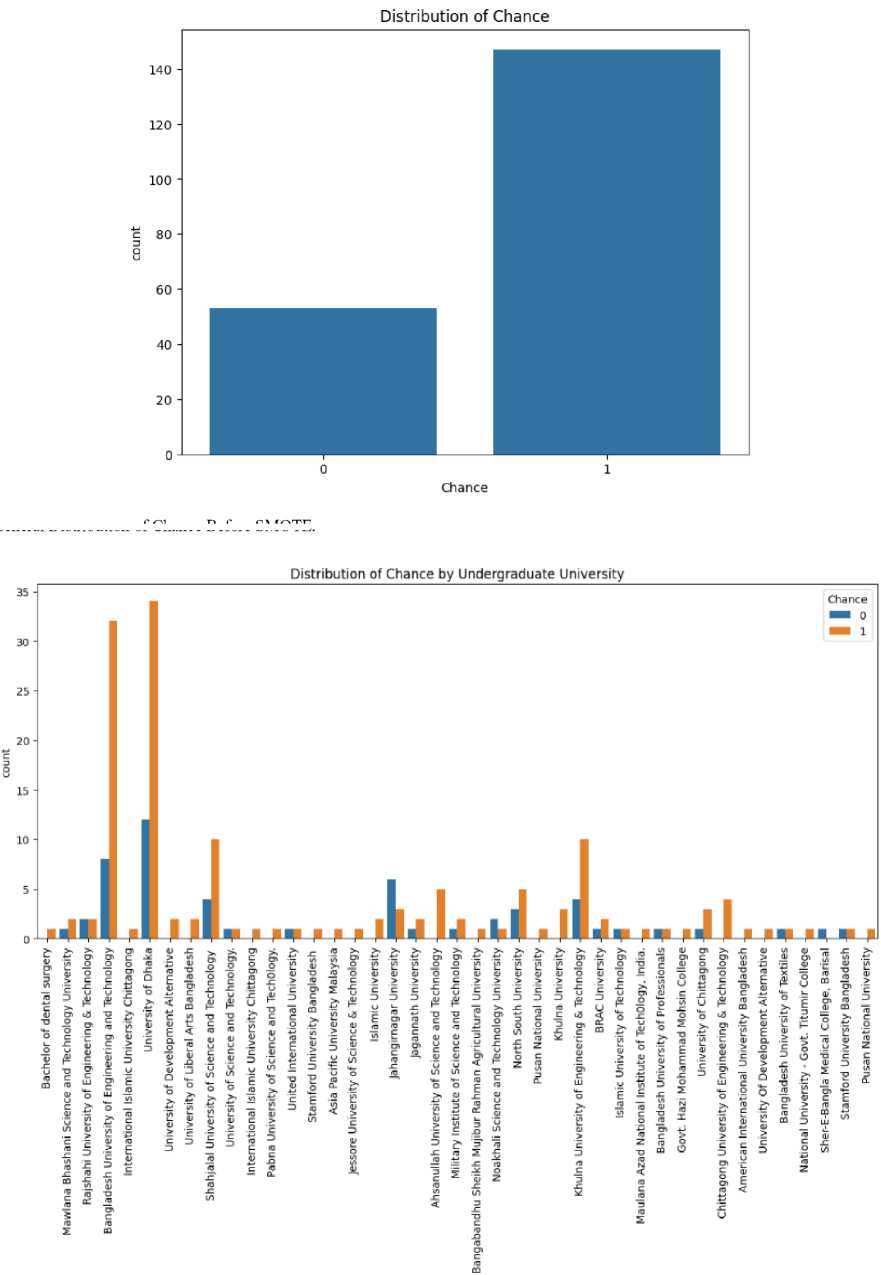
Figure 9 shows self-reported effort levels with success rates, illustrating a pronounced trend where higher selfrated effort aligns with increased success (Chance = 1). Particularly, those who rated their effort as “excellent” show nearly universal success, while a “poor” effort rating corresponds mostly with failure (Not Chance = 0). In Figure 10 displays an imbalanced distribution of chance where chance is chance is higher than rejected.
Underg ra d uate_Un ivers ity
Fig. 10. General Distribution of Chance Before SMOTE.
Fig. 11. University wise chance of postgraduation program in USA from Bangladesh.
Table 3. Performance of applied model before class balance.
|
Model Name |
Accuracy |
Precision |
Recall |
F1-score |
|||
|
No Chance |
Chance |
No Chance |
Chance |
No Chance |
Chance |
||
|
Gradient Boosting Classifier |
74.00% |
0.65 |
0.75 |
0.80 |
0.90 |
0.84 |
0.82 |
|
AdaBoost classifier |
68.00% |
0.50 |
0.70 |
0.70 |
0.70 |
0.70 |
0.70 |
|
Categorical Boosting Classifier |
81.00% |
0.70 |
0.75 |
0.99 |
1.00 |
0.80 |
0.86 |
|
Multi-Layer Perceptron (MLP) |
83.00% |
0.72 |
0.75 |
0.88 |
0.90 |
0.84 |
0.83 |
|
Deep Neural Network |
79.00% |
0.68 |
0.72 |
0.68 |
0.77 |
0.72 |
0.74 |
|
CatML |
84.00% |
0.73 |
0.78 |
0.90 |
0.93 |
0.82 |
0.85 |
-
4.1. Performance before Class Balance
-
4.1.1. Gradient Boosting Classifier
-
4.1.2. Adaptive Boosting Classifier
-
4.1.3. Categorical Boosting Classifier
-
4.1.4. Multilayer Perceptron
-
4.1.5. Deep Neural Network
-
4.1.6. CatML Classifier (Proposed)
We can view from Table 2 that the accuracies of the models range between 68% (AdaBoost) and 84% (CatML). The overall highest accuracy comes from the model proposed, CatML (84%), followed by MLP (83%) and CatBoost (81%), with more predictive power. However, their performance regarding false positives and false negatives varies, particularly for the classes. There is a consistent pattern: recall and precision values for the "No Chance" class (negative class) are usually lower than for the "Chance" class (positive class). This points towards a potential class imbalance, in which models would bias their predictions towards the majority class—presumably the "Chance" class. The F1-score, a fusion of precision and recall into a single value, also exhibits this trend. It is consistently higher for the positive class across all models, indicating that models perform better at identifying candidates with a possibility of admission. However, CatML exhibits balanced performance, with high scores in both classes (F1-scores of 0.82 for "No Chance" and 0.85 for "Chance"), and hence being more robust in distinguishing admission outcomes.
The Gradient Boosting Classifier achieves an accuracy of 74%, suggesting a reasonably effective performance. For the "No Chance" class, it yields a precision of 0.65 and a recall of 0.80, indicating moderate capability in identifying true negatives. For the "Chance" class, the precision and recall are 0.75 and 0.90 respectively, showing the model performs better in predicting positive outcomes. The F1-scores are 0.84 (No Chance) and 0.82 (Chance), highlighting a relatively balanced performance.
AdaBoost records the lowest accuracy among the models at 68%. The model struggles with the "No Chance" class, where both precision and recall are 0.50 and 0.70, indicating limited detection of true negatives. For the "Chance" class, it maintains the same precision and recall of 0.70, suggesting some consistency. The F1-scores are 0.70 for both classes, reflecting a modest but balanced performance.
The CatBoost model shows an improved accuracy of 81%, performing particularly well in predicting the "Chance" class, with a precision of 0.75 and a recall of 1.00, leading to a strong F1-score of 0.86. However, for the "No Chance" class, although precision is 0.70, the recall is extremely high at 0.99, which is unusually high for both classes and should be verified. This suggests excellent sensitivity but potential overfitting.
MLP delivers a high accuracy of 83%. It maintains a balance in class prediction, with the "No Chance" class showing precision of 0.72 and recall of 0.88, and the "Chance" class having precision of 0.75 and recall of 0.90. The F1-scores are 0.84 (No Chance) and 0.83 (Chance), suggesting consistent and robust performance.
The DNN achieves an accuracy of 79%, showing better results than previously noted. For the "No Chance" class, precision is 0.68 and recall is 0.68, indicating balanced though not outstanding performance. For the "Chance" class, precision is 0.72 and recall is 0.77. The F1-scores are 0.72 and 0.74 respectively.
The model presented in CatML has the highest accuracy rate of 84%, which confirms its efficiency for this classification problem. For the "No Chance" class, the precision and recall are both 0.73 and 0.90, respectively, yielding an F1-score of 0.82. For the "Chance" class, it provides precision as 0.78, recall as 0.93, and F1-score as 0.85, proving robust predictive potential.
As we get less accuracy, so we apply data balance technique. The models show varying degrees of effectiveness, with none excelling uniformly across all metrics. The general trend suggests a better prediction rate for the positive class across models, potentially due to an imbalance in the dataset that favors positive instances. The ROC curve’s modest AUC for the combined model underscores the need for improved model tuning and possibly the introduction of techniques like SMOTE to balance the dataset, which could help enhance the models' ability to predict negative outcomes more accurately. This overall analysis suggests the imperative to refine the models further to achieve a balanced predictive capability for both classes.
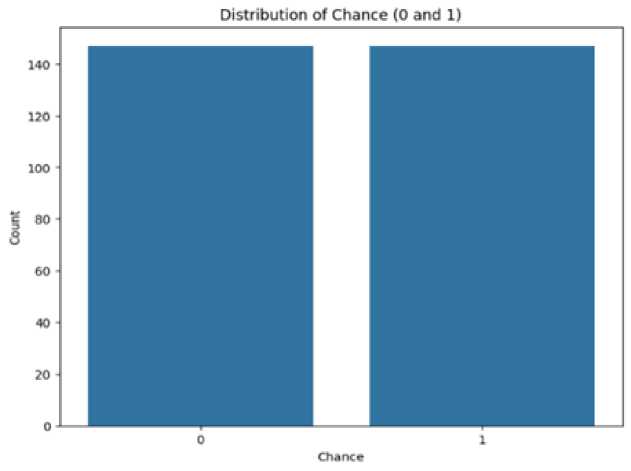
Fig. 12. General Distribution of Chance After SMOTE.
Figure 12 shows that presents a balanced distribution post-application of the SMOTE technique. SMOTE, being a synthetic minority oversampling technique, has evidently equalized the number of instances for both outcomes, showcasing its utility in addressing data imbalance. This adjustment is crucial for training machine learning models, as it helps in avoiding bias towards the majority class and improves the generalization of the model to new, unseen data. After applying SMOTE we apply GridSearchCV so that each data can be fine-tuned for optimal performance. Grid search involves systematically working through multiple combinations of parameter tunes, cross-validating as it goes to determine which parameters lead to the best model performance. This method is particularly beneficial after applying SMOTE, as it ensures that the models are not only trained on a balanced dataset but are also optimized to handle the intricacies of the newly synthesized data points. Consequently, this enhances the predictive accuracy and reliability of the models, making them more robust against overfitting and better suited for generalizing to diverse datasets. The rigorous tuning process, therefore, solidifies the models' capability to perform well in real-world scenarios, where the distribution of classes can be highly variable.
-
4.2. Performance After Class Balance
-
4.2.1. Gradient Boosting Classifier
-
4.2.2. Adaptive Boosting Classifier
-
4.2.3. Categorical Boosting Classifier
The Table 4 provides a comprehensive overview of the performance metrics of our used classifiers after smote used in the study. Gradient Boosting Classifier, Catboost Classifier, and Multi-Layer Perceptron Classifier all share an impressive accuracy of 83.05%. They exhibit high precision, recall, and F1-scores, particularly for No chance (Negative). But CatML (CatBoostClassifier, MLPClassifier) achieves the highest accuracy at 88.14%. It shows outstanding performance across precision, recall, and F1-scores for both classes, making it the most robust model in this study.
From Table 4, we can see that The Gradient Boosting Classifier achieves an impressive accuracy of 83%. It demonstrates strong precision of 0.88 for No chance and 0.78 for Chance, indicating its effectiveness in accurately identifying both negative and positive cases. The recall rates of 0.82 for No chance and 0.84 for Chance also suggest that the model effectively captures most actual cases in both categories. The F1-scores of 0.85 for No chance and 0.81 for Chance reflect a balanced performance, emphasizing the model's capability in managing both false positives and false negatives effectively. The ROC curve for this model, depicted in Figure 13 (a) with an AUC of 0.89, underscores a significant improvement in discriminative ability, highlighting its robustness and reliability in complex classification scenarios.
From Table 4, the Adaboost algorithm demonstrates an overall accuracy of 75%. It achieves a precision of 0.83 for No chance and 0.67 for Chance, indicating a relatively strong ability to predict negative outcomes while being slightly less precise for positive outcomes. The recall rates are 0.71 for No chance and 0.80 for Chance, showing that the model is somewhat more effective at identifying a larger proportion of actual positive cases compared to negative ones. The F1-scores of 0.76 for No chance and 0.73 for Chance suggest a balanced performance between precision and recall for both classes, albeit slightly better for the negative class. The ROC curve associated with this model, depicted in Figure 13 (b), has an AUC of 0.89, which indicates a good level of discriminative ability. This AUC value highlights the model capability to differentiate between the classes effectively, confirming its utility in scenarios that require distinct classification of negative and positive outcomes.
Table 4. Performance of applied model after class balance.
|
Model Name |
Accuracy |
Precision |
Recall |
F1-score |
|||
|
No Chance |
Chance |
No Chance |
Chance |
No Chance |
Chance |
||
|
Gradient Boosting Classifier |
83.05% |
0.88 |
0.78 |
0.82 |
0.84 |
0.85 |
0.81 |
|
AdaBoost Cassifier |
74.58% |
0.83 |
0.67 |
0.71 |
0.80 |
0.76 |
0.73 |
|
Categorical Boosting Classifier |
83.05% |
0.83 |
0.83 |
0.88 |
0.76 |
0.86 |
0.79 |
|
Multi-Layer Perceptron (MLP) |
83.05% |
0.88 |
0.78 |
0.82 |
0.84 |
0.85 |
0.81 |
|
Deep Neural Network |
79.66% |
0.87 |
0.72 |
0.76 |
0.84 |
0.81 |
0.78 |
|
CatML |
88.14% |
0.89 |
0.88 |
0.91 |
0.84 |
0.90 |
0.86 |
From Table 4, the CatBoost Classifier demonstrates a solid accuracy of 83%. The model shows a precision of 0.83 for both No Chance and Chance, indicating its consistent ability to predict true negatives and true positives accurately. The recall rates stand at 0.88 for No chance and 0.76 for class Chance, reflecting that the model is slightly more effective at identifying actual negative cases than positive ones. The F1-scores, which are 0.86 for No chance and 0.79 for Chance, suggest a strong balance between precision and recall, with a slightly better performance for the negative class. This balanced approach highlights the model’s capability in managing classification across both types of outcomes efficiently. The ROC curve for the CatBoost model, depicted in Figure 13 (c), features an AUC of 0.90. This high AUC value underscores a significant capability of the model to distinguish between the classes effectively, making it highly reliable for tasks requiring precise classification in varying scenarios. This performance demonstrates the strength of CatBoost in handling complex datasets with a high degree of accuracy and robustness.
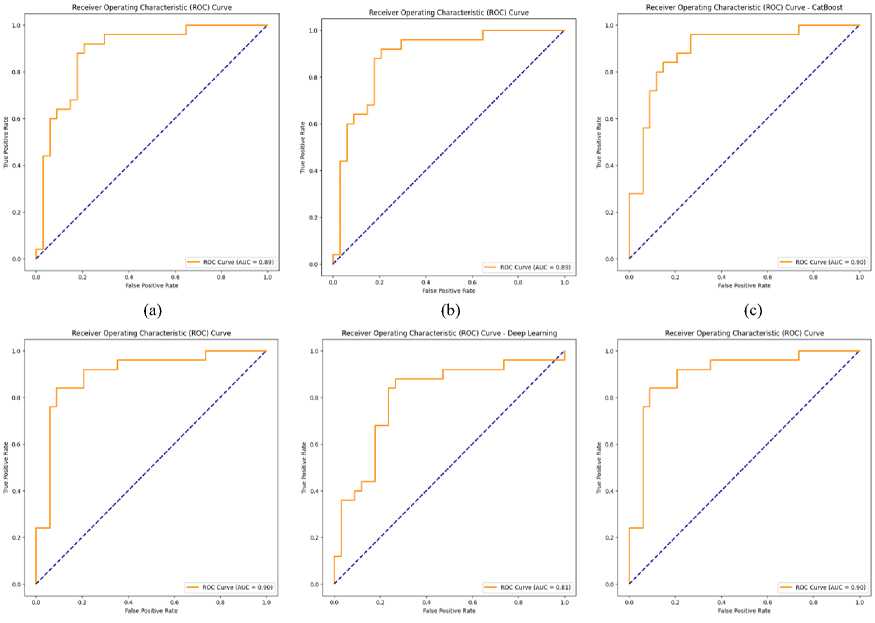
(d) (e) (f)
Fig. 13. ROC-AUC curve for each model (a) Gradient Boosting, (b) AdaBoost, (c) Categorical Boosting, (d) MLP, (e) DNN, (f) CatML
-
4.2.4. Multilayer Perceptron
-
4.2.5. Deep Neural Network
-
4.2.6. CatML (Proposed)
-
4.3. Web Application
From Table 4, the MLP Classifier exhibits robust performance with an accuracy of 83%. The model demonstrates high precision for No chance at 0.88 and for Chance at 0.78, effectively identifying both negative and positive cases accurately. The recall rates are similarly strong, with 0.82 for No chance and 0.84 for Chance, indicating the model's capability to capture most actual cases across both categories. The F1-scores, 0.85 for No chance and 0.81 for Chance, reflect a well-balanced performance, emphasizing the model’s ability to manage both false positives and false negatives efficiently. The ROC curve associated with this model, depicted in Figure 13 (d), shows an AUC of 0.90. This high AUC value underscores a significant improvement in discriminative ability, highlighting the model's robustness and reliability for complex classification tasks.
From Table 4, the Deep Neural Network model exhibits an accuracy of 80%, indicating solid performance in classification tasks. The precision for No chance is quite high at 0.87, showcasing the model's strength in correctly predicting negative outcomes with a relatively low rate of false positives. For Chance, the precision is 0.72, indicating a good but slightly less accurate performance in identifying positive outcomes. The recall rates are 0.76 for No chance, suggesting that the model captures a large portion of the actual negative cases, and 0.84 for Chance, demonstrating a higher effectiveness in identifying true positive cases. The F1-scores, 0.81 for No chance and 0.78 for Chance, reflect a balanced performance between precision and recall, showing that the model can maintain a consistent level of accuracy across both classifications. The ROC curve for the Deep Neural Network, depicted in Figure 13 (e), with an AUC of 0.81, illustrates the model’s commendable discriminative ability between the classes. This AUC value highlights the neural network's capability to effectively distinguish between positive and negative outcomes, confirming its utility in scenarios that demand high accuracy and nuanced differentiation between varied results.
From Table 4, the CatML Perceptron, which integrates the strengths of CatBoost and MLP classifiers, achieves a commendable accuracy of 88%. This model shows excellent precision with 0.89 for No chance and 0.88 for Chance, indicating its proficiency in accurately identifying both negative and positive cases with minimal false positives. The recall for No chance is 0.91, suggesting that the model effectively captures most of the actual negative instances, and for Chance, it is 0.84, showing strong detection of true positive cases, although slightly lower than for negatives. The F1-scores are closely aligned with other metrics, at 0.90 for No chance and 0.86 for Chance, highlighting the model's balanced performance in precision and recall. The ROC curve for this CatML Perceptron, depicted in Figure 13(f), with an AUC of 0.90, reflects the model’s superior discriminative ability between classes. This high AUC value confirms the efficacy of combining multiple learning algorithms to enhance classification accuracy, making it a robust choice for complex classification scenarios where high precision and recall are essential.
From Figure 14 and Figure 15, we have developed a web interface that integrates our advanced machine learning model, CatML, which combines the predictive powers of CatBoost and MLP classifiers. This platform is specifically designed to assist Bangladeshi students in estimating their chances of gaining admission to U.S. universities based on crucial academic and extracurricular factors such as GRE scores, TOEFL scores, university rankings, publications, and more. The web interface provides a user-friendly environment where students can input their academic details, such as GPA, GRE scores, TOEFL scores, number of publications, and their targeted university’s rank. Once the data is entered, the CatML model processes the information through sophisticated algorithms running on the backend, executed via scripts in a bash environment. This setup ensures that the predictions are not only accurate but also swiftly delivered
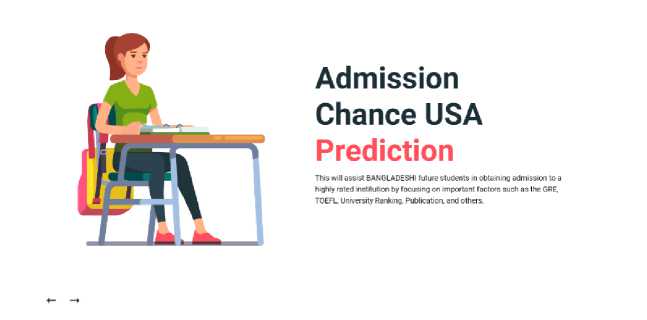
Fig. 14. Homepage of Admission Chance USA prediction web application.
to the user. After submitting their information, students receive a personalized prediction of their admission chances, expressed as a percentage. This system empowers students by providing them with a clear and data-driven outlook on their prospects, allowing them to make informed decisions about their educational strategies and potential adjustments they might need to enhance their profiles. This initiative bridges the gap between Bangladeshi students and their aspirations to study in top-tier U.S. universities by providing a realistic assessment of their admission chances based on historical data and advanced predictive analytics.
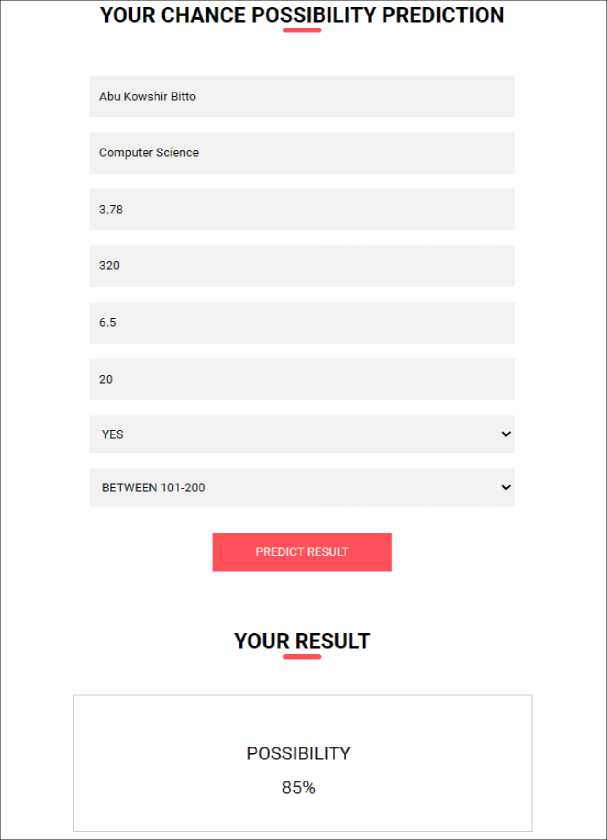
Fig. 15. Prediction through the web application for a student with his/her criteria.
Table 5. Comparative study with earlier study on USA postgraduation prediction.
|
Study |
Context |
Dataset |
Best Methods |
Accuracy |
|
[34] |
Graduation rate prediction |
Public university in Colombia |
Random Forest |
84.11% |
|
[38] |
Student retention in Chile |
Various levels, Chile |
Random Forest |
80% |
|
Proposed |
Admission Chance USA |
Students’ Profile |
CatML |
88.14% |
4.4. Discussions and Comparative Study
5. Conclusion
The use of SMOTE and grid search has profoundly impacted the performances of the models. Before SMOTE can be applied, the class imbalance was found to be extreme in the dataset, and therefore the models were poorly performing in correctly predicting the minority class with low recall, precision, and F1-scores even though overall accuracy was moderate. Models favored accurately predicting the majority class, and they produced misleading performance measures. After SMOTE usage, class balancing using synthetic data allowed models to detect patterns in the minority class better, greatly enhancing recall, precision, and F1-score, yet also overall accuracy or even making it higher. This shows that addressing class imbalance was the most important factor in developing more balanced, reliable, and usable predictive models.
Before applying SMOTE, the models exhibited low sensitivity towards the minority class, which translated to reduced recall and F1-scores. Upon using SMOTE, balance in the distribution of the classes guaranteed that sensitivity of the models to the minority class increased noticeably, with aggregated measures like recall, precision, and F1-score rising dramatically. Grid search also optimized the model parameters, adjusting them to be better suited for generalization and stability. This is particularly noted in models like the Gradient Boosting Classifier and CatML, whose high accuracy and more stable class handling were the result of fine-tuned parameters after grid search. The combination of SMOTE with grid search has proved to be a crucial step towards enhancing model performances, particularly for their ability to generalize and classify instances with accuracy and precision in a balanced manner. This proves to be extremely beneficial in acquiring greater recall and precision, and hence the models become more accurate and efficient to be implemented in real-world applications. Besides, by integrating the final optimized model with a web-based system, this intelligent tool can offer better decision-making support for future Bangladeshi master's applicants to pursue studies in the USA.
From the comparative analysis of various machine learning models employed in educational outcome predictions, our study demonstrates a notably high accuracy using the Stacking Classifier, named CatML, which combines CatBoost and MLP classifiers. This model achieves an accuracy of 88.14%, as detailed in the performance summary Table 5.
This study provided a thorough analysis of the CatML StackingClassifier, a cutting-edge machine learning framework designed to forecast students' chances of admission to American colleges by fusing the best features of CatBoost and MLP classifiers. With an astounding 88.14% accuracy rate, the model surpassed conventional predictive models, demonstrating its effectiveness over techniques like Random Forest and SVM, which demonstrated lesser accuracy in comparable educational scenarios. The system, which is integrated into an intuitive web interface, offers prospective students’ data-driven forecasts in real-time based on relevant academic criteria, enabling them to make well-informed decisions. The model's capacity to manage unbalanced datasets was much improved using the Synthetic Minority Over-sampling Technique (SMOTE), which increased the model's prediction accuracy and dependability. By using this method, we were able to overcome the prevalent problem of class imbalance in educational data, which frequently resulted in forecasts that were biased in favor of the dominant class. In the future, this research will cover a wider range of potential students from different nations to broaden the model's applicability to a worldwide audience of people who wish to pursue studies in the United States. To increase the predicted accuracy and strengthen the predictability of our results, this expansion will entail gathering larger amounts of data and investigating new machine learning models. Additionally, we intend to use Conditional Generative Adversarial Networks (CGANs) to generate data for profiles of underrepresented students. This will enhance our training dataset and maybe reveal more complex insights into the variables affecting admission success. Our goal is to create a more complete solution that can cater to a larger range of student demographics by expanding our dataset and implementing more sophisticated machine learning algorithms. In addition to focusing on model parameter optimization, future versions of this study will also include newer algorithms that may perform better at forecasting educational outcomes.
