A Novel Joint Chaining Graph Model for Human Pose Estimation on 2D Action Videos and Facial Pose Estimation on 3D Images

Author: D.Ratna kishore, M. Chandra Mohan, Akepogu. Ananda Rao
Journal: International Journal of Image, Graphics and Signal Processing(IJIGSP) @ijigsp
Article in issue: 3 vol.9, 2017.
Free access
Human pose detection in 2D/3D images plays a vital role in a large number of applications such as gesture recognition, video surveillance and human robot interaction. Joint human pose estimation in the 2D motion video sequence and 3D facial pose estimation is the challenging issue in computer vision due to noise, large deformation, illumination and complex background. Traditional directed and undirected graphical models such as the Bayesian Markov model, conditional random field have limitations with arbitrary pose estimation in 2D/3D images using the joint probabilistic model. To overcome these issues, we introduce an ensemble chaining graph model to estimate arbitrary human poses in 2D video sequences and facial expression evaluation in 3D images. This system has three main hybrid algorithms, namely 2D/3D human pose pre-processing algorithm, ensemble graph chaining segmented model on 2D/3D video sequence pose estimation and 3D ensemble facial expression detection algorithm. The experimental results on public benchmarks 2D/3D datasets show that our model is more efficient in solving arbitrary human pose estimation problem. Also, this model has the high true positive rate, low false detection rate compared to traditional joint human pose detection models.
Human Pose Estimations, Chaining graph models, Edge based Filtering
Short address: https://sciup.org/15014170
IDR: 15014170
Text of the scientific article A Novel Joint Chaining Graph Model for Human Pose Estimation on 2D Action Videos and Facial Pose Estimation on 3D Images
Human pose detection is an active research in computer vision and can be extended from facial expression detection. Most of the pose detection models aim to determine the orientation and position of body parts within the image or video sequences. Several parameters have made this detection very challenging in arbitrary pose detection applications. This challenging is due to arbitrary actions, complex background noise and the distance between camera and human actions.
Traditional models of human pose detection can be divided into 3 types i.e models related to template matching, models related to color and models related to contour detection. Models related to color are efficiently detecting a human’s pose on complex actions, but the main limitation of this model is that the color histogram is not optimal in real-time surveillance actions. Also, the pose detection algorithm has better accuracy on a still action images and video sequences, a drawback of this model is that many background objects have similar colors to those of hair which gives in false detection.
The models related to template matching, detect segments belonging to head pose by computing the similarity measure of a pose template and the segmented area. Generally, pose templates are defined in terms of geometric shapes such as lines, circles, polygons, arcs and rectangle to determine the level of matching. Generally, these models are efficient to complex background and texture segmented regions, but the computational cost is too high for detection.
Models related to contour detection use some predefined geometric shapes to define body parts contour details. These models involve a constraint optimization which is efficient to noisy poses and noisy edge information. However, the curve fitting process is very time consuming process.
Predicting the 3D human pose using a template or contour is a severely under constrained problems, because many poses posses very similar projections in each direction.
The Hidden Markov model is the well known undirected graph based model for image segmentation. But, the Markov random field(MRF)[4] model incorporates the spatial relationships among the graph nodes. So, an improvement to this MRF model is a conditional random field (CRF) is also an undirected graph based model applicable for image segmentation. Traditionally, the human activity can be detected by using color based segmentation such as k-means, agglomerative and histogram approaches with edge detection algorithms. Digital image segmentation plays a significant role for partitioning an image into similar objects based on domain knowledge. Feature selection is an important requirement in most of the digital image segmentation techniques. Depending on the extracted features, the segmentation approaches are classified into 3 categories, namely, edge-based, the region based and thresholding based segmentations.
-
A. Human Pose Estimation Issues and solutions
-
a) The Eyes brows pose estimation
The 3D facial feature around the eyes tends noisy edges due to the reflection constraints and eye lashes. Facial texture gives high descriptive information about the shape or pose of the eye. For this reason, 3D facial features are used to find the key points around the eyes, namely inner, outer eye and around the iris region.
-
b) Nose pose estimation
Nose region is distinct in surface curvature, but plain in texture description. So, in order to detect the pose estimation in facial features, yaw angle of the 3D face is used.
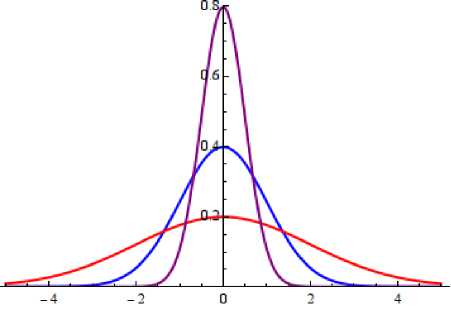
Fig.1. ROC Curves for nose error correction
Using ROC as shown in Fig.1 , the curve is repeatedly rotated to minimize this nose difference between the two symmetrical nose regions by computing maximal point as the new nose region. Once the key point of the nose is detected this entire surface is rotated and thus nose poses are estimated accurately.
-
c) Lips pose estimation
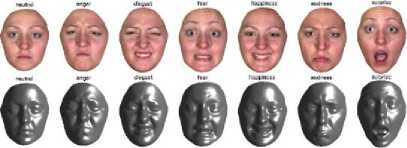
Fig.2. Facial expressions
-
d) Body pose estimation
The segmentation of human emotions or expressions are challenging factor in many real-time human activity identification. It is common in many domains such as biometric identification and medical fields which exhibit irregular boundaries and discontinuities. Also, segmented sub-regions can only be partitioned when several modalities are merged, which requires an efficient registration process in the pre-processing step. In the traditional human activity detection models, intra and inter region resolutions may affect the segmentation accuracy. Due to the partial volume effect, inherent noise, wide range of image features and spatial constraints, conventional models fail to detect the exact location and segmentation of the human activities in large training datasets.
-
II. Related Works
The traditional graph based models for image segmentation are based on either directed graphical or undirected graphical models. But, they often fail to capture the complex region relationship of different activities. In [5],color texture analysis to extract spectral correlation features is proposed. Both approaches doesn’t handle texture boundary extraction due to noise in the image. A more improved approach is proposed in the Texem model , which consists of a conditional dependency between neighbor regions and it is totally based on Gaussian mixture model. Digital image thresholding is one the most popular method due to its simple implementation and intuitive features. Consequently, the threshold measures for multimodal histograms must be minima among the two maxima. A few techniques enlighten the histogram peaks in image feature extraction stage so as to provide the threshold detection. The main drawback of this method is to segregate the object from background if the object and background regions are identical pixel distribution. Edge based segmentation works well against irregularities in image attributes such as texture, gray level, color etc. These irregularities are known as edges and are noticed using edge detection operations, some of the generally used operations are prewitt, Laplace, sobel etc. Segmentation using edge-based method could be used as incomplete due to the occurrence of stray, broken or noisy edges. Enhanced image processing is essential to extract the edges corresponding to rational objects. Several edge based methods have been proposed in the literature, but the frequently accepted segmentation systems are edge based thresholding, which is used to clear noisy edges in bright conditions. Edge image thresholding directs to stray edges in the presence of noise where the actual edges are frequently missing [6][7]. Stray edge problems can be cleared if the edge properties are decided with respect to the mutual neighbor, while the presence of edge based on the strength of edges in the near neighborhood. Region based segmentation approach which depends on the homogeneity measure to divide and merge regions in an image so as to broaden semantic or useful division in the processed image.
-
A. Conventional Human Activity Detection Methods
The region growing model is proposed in C-V segmentation. For a given frame I on the domain, C represents the closed curve region and i1 and i2 represents the average inside and outside intensities of the closed curve C . The basic assumption of this segmentation by optimizing the energy function as:
E ( i 1 ,i 2 ,C ) = µ X.len(C) + ω .area(C)
+ θ ∫ |I - v 1 | 2 dxdy + θ ∫ |I - v 2 | 2 dxdy ins( C) ins( C)
Where µ >0 , ω >0 , θ , θ >0 are fixed values.
The partial differentiation equation corresponding to the given C-V model is evaluated as
∂ ϕ / ∂ t = df(x) [ µ div( ∇ ϕ /| ∇ ϕ |) - ω - θ (I - v 1 ) 2 + θ (I - v 2 ) 2 ] dx X 12
f(x)=1,if x≥0
f(x)=0,if x<0
This model assumes that the image intensity values in each adjacent block always uniform.
Self Organizing Map (SOM), as part of competitive learning neural network technique has been used to develop the vector quantization process. The role of SOM for vector quantization process is mainly due to the pixel similarity between the region learning applied in the self organizing map. Neural units in the competitive layer need to be nearly equal to the number of regions specified in the segmented image. This is the main disadvantage of traditional SOM for image segmentation.
An optimization to C-V model was implemented by Zhang et al[8] which consider intensity data to find the refined edges. Thus, using gradient information, the gradient based C-V model is proposed. The basic optimization in GCV model is:
E(v 1 ,v 2 ,ds 1 ,ds 2 , η ) = µ ∫ 0 . 5 (| ∇ η | - 1 ) 2 dxdy +
Ω
Ω ins(C) ins(C)
-
B. Problems in Traditional Human activity segmentation Algorithms
-
• Conventional Segmentation algorithms fail to differentiate the human activities with the corner edges.
-
• Each activity depends on the histogram and user specified threshold. Need to specify a dynamic or global and local threshold.
-
• Fails to identify the symmetrical activities due to noisy pixels in the central region.
-
• Fails to detect new types of activities in the test data.
-
• Difficult to segment the human expressions using the activity list.
-
C. Traditional Joint Bayesian Probabilistic Chain Graphical Model
Each probabilistic graph model consists of two phases: quantitative and qualitative parts. Each probabilistic graph model is denoted by a graph G =(V,E) ; where V is the set of vertices and E is the edge set as shown in Fig.3.
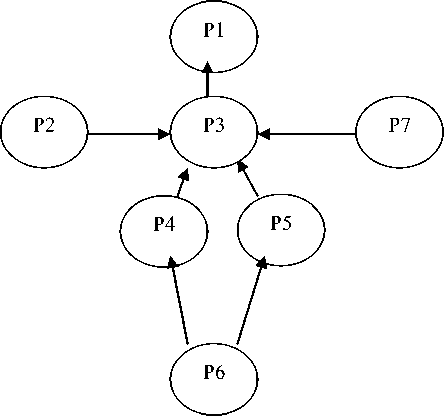
Fig.3. Bayesian directed chaining graph model
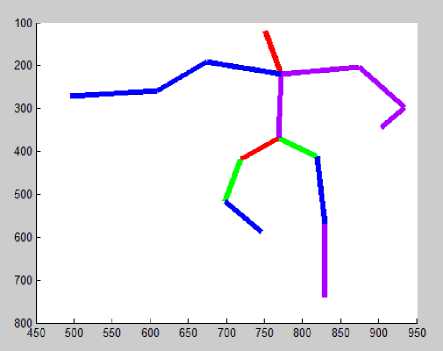
Fig.4. Corresponding 2D action estimation to chaining graph model
Each node in the vertices set represents the random variable and the link or edge represents the prior probabilistic relationships among the node random variables. In the novel chain graphical model, graph contains both directed and undirected edges. Each edge in the novel chain graphical model represents the joint probability distribution among the random variables. Figure 3 shows the Bayesian chaining graph model for pose detection on 2D images. Probabilistic Bayesian model is used to predict the discrimination evidence and to estimate pose from these evidences as shown in Fig.4.
The pose estimation problem is to detect the orientation and location of a 3D object through object mapping in between the 3D object to the 2D pose. The Gaussian energy function for pose scanning can be estimated using the following function.
g (x) = e
( Ц 2 i ° 2 )(x -g j (x)) 2 (f (x^ -a^
if y=m(row size of the block or pose)
- ( g 2 /4 ° 2 )(x g 2 (x))2 (f(x,y) - 0.5)
g(X) = 6
if y=n(column size of the block or pose)
Where g and g2 are the pose mean ; 02 and 02 are the pose variance.
In this model, to classify for a particular pose class, using the Bayesian classifiers the entire pose class set is a computational overhead. In this joint boosting model, candidate pose set is pre-selected at random from the training data. During training phase , image background is trained into a class that discriminates pose from the background. This model is used to classify multi-pose learning that is used in image classification and key-pose extraction.
-
D. 3D-Facial pose estimation
-
[5] Implemented the enhanced PCA-ICA scheme to estimate facial features recognition using only the texture description on the predefined poses training data. They extracted the face pose contours in the given query image around the eyes, eyebrows, nose and mouth by implementing an active contour techniques. These pose contours were mapped onto the 3D-mesh data to generate the texture information subjected to the enhanced PCA model to recognize expressions.
In general, most of the literature work on 3D-facial expression evaluation can be classified as feature based classification or generic facial based classification. In the first category, 3D facial poses are scanned and classify them into various facial expressions. Most of these models, the 3D face is sub partitioned into regions using manually annotated landmarks, principal direction and surface curvature to recognize various facial expressions.
In the second category, general facial features are constructed using dense correspondence on a set of training 3D feature points[12-15].
The facial pose estimation between each frame in the 3D facial training data are used to annotate pose regions using the B-spline interpolation. Let F1=(x1,y1,z1) and F2=(x2,y2,z3) are the two facial pose key features used to estimate pose vector field P(F) such that,
F2=P(F)+F1;
Let L( ф ) be the lattice structure of the regular source image which consists of n(x) x n(y) x n(z) feature points in each direction with regular space field ф (i,J,k) . The pose transformation of the B-spline interpolation of the 60 closest feature control points is given by
P(F) = EEE B xi,x2,x3 (l)D(i,J,k) i = 0 J = 0 k
Where xl = x - x0,x2 = y - y0,x3 = z - z0; and
(x0,y0,z0) is the initial pose point.
B (l) is the basis function of cubic B-
Spline ,defined as
B(l0) = (1/6)( - x3 + 3x2 - 3x + 1)
B(l,) = (1/6)(3x3 + 6x 2 + 4)
B(l2) = (1/ 8)( - 3 x3 + 3x2 + 3x + 1)
B(l 3 ) = 1/6)(x3)
P(F) is the facial expression evaluation function.
-
III. Proposed Model
-
A. Probabilistic based Human Pose Detection in 2D Action Video Sequences
In this proposed model, 2D video action sequences are used to detect the accuracy human poses using enhanced chaining graph model with filtering algorithm. The conditional dependence represents the relationship of the occurrence of one object being dependent on the occurrence of the other object and asymmetric in nature. Also, the homogeneous association usually computes the similarity among the objects. The main aim of the chaining graph segmentation algorithm is to partition an image into homogeneous regions (classes) with respect to one or more pose characteristics. Proposed segmentation algorithm is based on probabilistic estimation of the human action and non-actions regions as shown in Fig. 5. In this human pose detection algorithm, the basic chain graph algorithm is applied on the pre-processed image for initial segments. Initial segments have a large number of over segmented regions which are very difficult to detect or process the activities in the image.
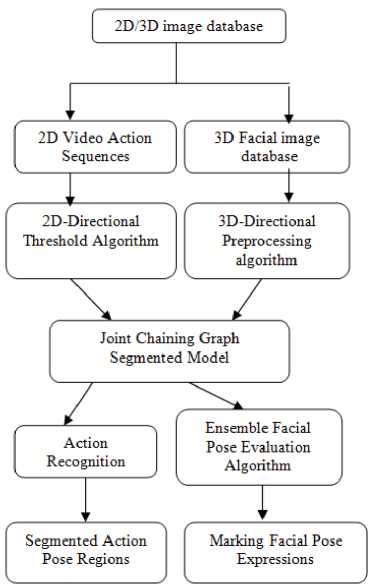
Fig.5. Proposed Joint Human Pose Detection Model
In order to overcome this issue, the probabilistic estimation method is applied in the over-segmented regions to extract the activities by merging the estimated regions. In this proposed model, 2D/3D data are used to find the pose estimation in 2D and 3D facial expressions. The proposed model is summarized in the Figure 5. In this model two phases are used to detect the poses. In the first phase, 2D video sequences are used to find the action poses using the 2D directional filtering algorithm and chaining graph segmentation model. Directional filtering algorithm is used to filter the noise in each direction x-axis and y-axis and enhanced chain graph model is used to find the pose actions using the foreground and background segmented regions. In the second phase, 3D facial database are used to evaluate the 3D facial expressions using 3D facial pre-processing algorithm, joint segmentation algorithm and the ensemble facial expression evaluation algorithm. Algorithm 1 and 2 describe the 2D video sequences pre-processing algorithm and the chaining graph segmentation algorithms for pose detection in the video sequences. Algorithm 3 and 4 describe the 3D facial filtering algorithm and the ensemble segmented model for facial expression evaluation algorithm on the 3D facial database.
Algorithm 1: 2D Video Sequence Pre-processing Algorithm
Input: Video Sequence Images Output: Filtered Video Sequences Procedure:
Step 1:
For each frame F do
Divide the human action frame into two classes Cls in X-axis and Cls in Y-axis directions with foreground level fg , background level bg and the block mean value Th such that
fg = {0,1,2...Th} and bg = {Th+1,Th+2...Th+N} where N is the total number of levels in each direction
Th = min{ ∑ fxy(x,y))/|fx(x,y)|, ∑ fxy(x,y))/|fy(x,y)|}
Step 2: Determine the foreground level lower threshold using C-V model T .
∂ϕ / ∂ t = df(x, y) [ µ div( ∇ϕ /| ∇ϕ |) -ω-θ (I - v1)2 +θ (I - v2)2]s dx
+ df(x,y) [ µ div( ∇ϕ /| ∇ϕ |) -ω-θ (I - v1)2 +θ (I - v2)2]s dy
Where v1 =∫fx(x,y)dx/∫fy(x,y)dy ΩΩ v2 = ∫fxy(x, y) dxdy/(∫fx(x, y) dx. fy(x, y) dy)
T =∂ϕΩ/∂t*∑(x*proΩb2(x)-x2*prob)/|N|
Step 3:
Determine upper threshold T .
T = ∑ N - 1 prob ( x )* ∑ N - 1(x* prob 2( x ) - x 2* prob (x))/|N| x = Th + 1 x = Th + 1
Step 4:
Check the foreground and background noise using the following condition:
if(T 1 >λ 1 )
remove gaussian noise(fg);
else if(T >λ )
remove guassian noise(bg);
else continue;
Step 6: Repeat steps 2 to 4 until the video sequence is empty.
After enhancing the given video sequences using a preprocessing algorithm, the next step is to find the human pose in the enhance image using proposed chaining graph model.
Algorithm 2:Optimized Region Merging Activity Segmentation Algorithm
Input:
Filtered Dimensional Data.
e ( x ) =edgeset values along with probabilistic values of first region.
e (y) = edge set values along with probabilistic values of first region.
p ( x ) =intensity values of first region.
p ( y ) =intensity values of second region.
Output : Enhanced Human Activity Segments.
Procedure:
Segmented regions S ;
Human activites estimated over segmented Regions S generated from chain graphical model.
Segmented_Regions[]=ChainGraphModel(data);
For each region reg in Segmented_Regions
Do
If(reg is oversegmented)
Then
Si =reg;
End if done
Set i=0.
For each pair of adjacent oversegmented activities in S do
Calculate the similarity between the oversegmented activities (O i ,O j ) along with the area as
L ( i , j ) = (1 / 2 n ) * e - 0 - O j | 2 / 2 *ma<{ ° 2 ’ " 2 }
Done
For each pair of nearest neighbor over-segmented activites
Do
R(A)=RegionrArea(A), R(B)=RegionArea(B).
Calculate mean similarity value of all the oversegmented activities in List L as θ
θ=L(i,j)/N;
Where N is the number of over segmented regions.
If( (R(A) ||R(B)) < θ )
Then
η = prob ( p ( x ) / p (y))
η = 1 *e - (1/2)* N 2 )
(2 π ) N 1 *| cov(p(x), p(y) |
The variance of edge sets x is evaluated as :
∂ e(x)/ ∂ t = df(x) [ µ div( ∇ ϕ / | ∇ ϕ |) - ω - θ (I - v 1 ) 2
dx e(x) 1
+ θ 2 (I - v 2 ) 2 ]
Where v1 = ∫fx(x,y)dx/∫fy(x,y)dy v2= ∫fxy(x, y) dxdy/(∫fx(x, y) dx. fy(x, y) dy)
ΩΩ
f(x) = 1 if e(x) ≥ 0 = 0 if e(x)<0
e'x =Max{∂e(x) /∂t,|E∩{px}|/| {px}|}
The variance of edge sets y is evaluated as :
∂ e(y)/ ∂ t = df(x) [ µ e(y) div( ∇ ϕ / | ∇ ϕ |) - ω - θ 1 (I - v 1 ) 2 dx
+ θ 2 (I - v 2 ) 2 ]
ΩΩ
f(x) = 1 if e(y) ≥ 0
= 0 if e(y)<0
and
e'y =Max{∂e(y) /∂t,|E∩{py}|/|{py}|} λ=|E∩{ex∪ey}|/(min(e'x,e'y)*|{ex∪ey}|
Where
End if
If( λ <= η )
Then
Merge( p ( x ) , p ( y ) )
Else
Break.
End if done
Algorithm 3:3D-Facial Pre-processing Algorithm
Input : Yaw(Y),Pitch(P) and Roll, T(Y,P,R)
Output: 3D- Facial pre-processing image
Procedure:
Step 1: Initialize 3D image database
Step 2: Applying directional noise filtering procedure as shown below
G Y (P,R) = 1/^ 2 πσ Y .exp( - 0.5(xp2 + y2R) ---(1)
G P (Y,R) = 1/ J 2 πσ P .exp( - 0.5(xY2 + y2R) ----(2)
G R (Y,P) = 1/ у/ 2 πσ R .exp( - 0.5(xY2 + y2P) ----(3)
Remove Gaussian noise in each direction usingGY(P, R) ,GP(P,R) and GR(P, R) .
Step 3: For each Pose T(Y,P,R) do
α , β , γ are the 3 directional threshold limits.
If(GY(P,R)> α )
Then
Guassian_remove ( G (P, R) );
Else if(GP(Y,R)> β )
Then
Guassian_remove( G (Y, R) );
Else if(G R (Y,P)> γ )
Guassian_remove ( G (Y, P) );
End for.
Step 4: T'(Y,P,R) = T(Y,P,R)
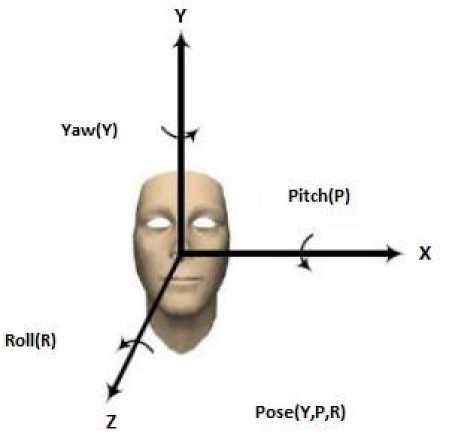
Fig.6. 3-Dimensional Face Coordinates
3D-Directional Preprocessing
This filtering model is implemented in two phases. In the first phase, holes are fixed in each direction, i.e Y,P,R direction as shown in Fig. 6. This process is used to filter the noise or ridges in each direction using Knn(K nearest neighbor) method. In this method, Knn is applied on the Y,P direction and then average of these k-points are set to z-axis (R direction). These k points (Y,P) and R average points are used to fill the holes or ridges in each direction for normalization process. In the second phase, 3-D facial landmarks in each direction Y,P,R are computed using the surface ‘S’ representation by twice differentiation of the real valued function. So, for each point in each direction Y,P,R compute normalized mean and normalized curvatures as follows:
NM(Normalized - Mean) =
(1 + f x2y )f yy - 2f x f y f xy + (1 + f y2 )f xx
2(1 + f x2y + f x2 + f y2 )
NM(Normalized - Mean) =
∂2f ∂2f ∂f ∂f ∂2f ∂2f
(1 + ) 2 - 2 + (1 +
∂x∂y ∂y2 ∂x ∂y ∂x∂y ∂y2
∂ 2f ∂ 2f ∂ 2f
2(1 + + +
∂x∂y ∂x2
Here f is a real valued function vector in each direction Y,R and P.
∂2f ∂2f
Normalized Curvature(NC)=
2(1 +
∂ x2 ∂ y2 ∂ x ∂ y
∂ 2f ∂ 2f ∂ 2f
+ 2+
Where f , f are the first order partial derivatives, f , f 2 , f 2 are the second order partial derivatives .Thus for each point in the 3-dimensional vector space ,partial derivatives are computed to estimate curvatures. These curvatures are used to find the edges in each direction.
Algorithm 4:Ensemble Graph Based Facial Expression Recognition Model
Input : Filtered 3D faces
Output: Expression Recognition and Marking
Procedure:
Step 1: For each dimension (Y,P,R) axis Construct graph model as
PG = ProbChainGraph(Y);
PG = ProbChainGraph(P);
PG = ProbChainGraph(R);
Extract E(PGY), E(PGP), E(PGR) as Edges sets in Y,P,R direction .
End for
Step 2: For each dimension (Y,P,R)
Do
Seg_PG [] = Apply enhanced chaining graph model in Y direction for PG ;
Seg_PG [] = Apply enhanced chaining graph model in P direction for PG ;
Seg_PG [] = Apply enhanced chaining graph model in R direction for PG ;
Done
Let r be the randomly selected region in each direction.
For each region r in SPG []
Do
Find center of region in Y direction as
C y = min{ ' k i + 1' } where i={{1,2...|SPG y []|} - k}
| SPGY []|
For each region r in SPG []
Do
Find center of region in Y direction as
Set X y = C y
Compute similarity between the regions along the Y direction as
Sim_PGY[] = (1/2n)exp(-| rk-r |2 Z2)*max(c2,02);
If(Sim_PGY[i]< X y)
Then
Find the angular expression computation in the direction Yaw(Y).
Ang_PGY = cos-1(E(rk).E(ri)/ || E(ik) ||. || E(ii |) |)
Where E(rk), E(ri) are the edge sets of regions r ,r in
Y direction.
Mark edge set points in the direction of angle
Ang_PGY .
Done
For each region r in SPG []
Do
Find center of region in P direction as
cr = min{
|rk - ri + i I |SPG R [] |
} where 1={{1,2...|SPGr[]|} - k}
Set X r = C r
Compute similarity between the regions along the R direction as
Sim _ PGr [] = (1/ 2n) exp(-| rk - r |2 /2)* max(o2,02 );
If(Sim_PG R [i]< X p )
Then
Find the angular expression computation in the direction R.
Ang_PGR = cos-1(E(rk).E(ri)/1| E(rk) ||. || E(r |) |)
Where E(rk), E(ri) are the edge sets of regions r ,r in R direction.
Mark edge set points in the direction of angle Ang_PG R .
Done
c
p
= min{
|rk - ri + i 1
|SPG P []|
} where 1={{1,2...|SPGp[] |} - k}
Set X p = cp
Compute similarity between the regions along the P direction as
Sim _ PGp [] = (1/ 2n) exp(-1 rk - r |2 /2)* max(o2,02 );
If(Sim_PGp[i]< Xp)
Then
Find the angular expression computation in the direction P.
Ang_PGp = cos-1(E(Tk).E(Ti)/ || E(ik) ||.|| E(ii |) |)
Where E(rk), E(ri) are the edge sets of regions r ,r in P direction.
Mark edge set points in the direction of angle
Ang_PGP.
Done
IV. Experimental Results
The evaluation of the proposed system is carried out using standard performance measures which are of falsepositiverate(fpr), truepositiverate(tpr), accuracy and errorrate, true positives(tp), false positives(fp), true negatives(tn), false negatives(fn). (fp+tn) indicates the total number of pixels represented foreground and background. 2D human pose data sets like CAVIAR (2004), CASIA ACTION (2007) and ETISEO (2005) are used in our experimental study for human pose recognition. A three-dimensional face showing different facial expressions, acquired using a real-time range camera [1]. The database contains 15 3D facial expressions of the same face, represented as a XYZ(.vert) and ASCII text file format.
fp tp fpr =-------; tpr =-------;
fp + tn tp + fn tp accuracy =--------------;
tp + fn + fp + tn
errorrate = 1 - accuracy
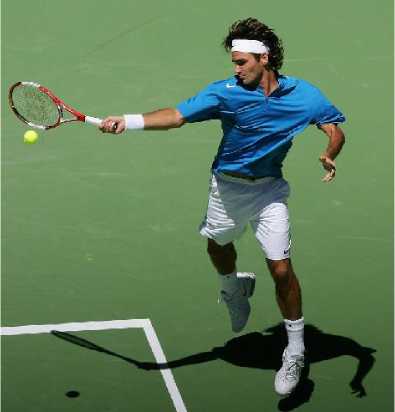
Fig.7. Input Image
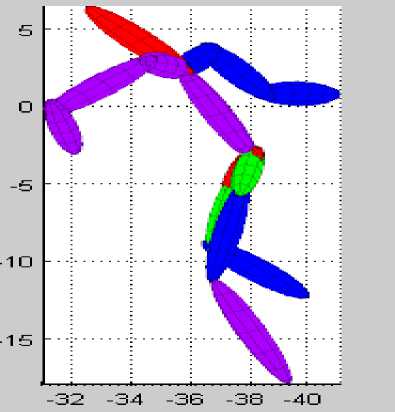
Fig.10. 2D Y-Z Directional View
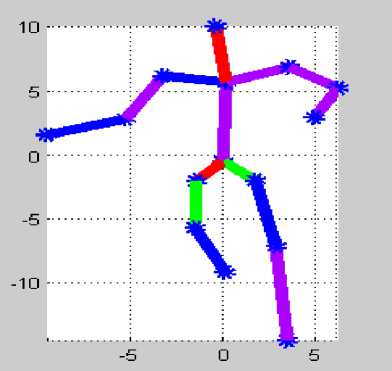
Fig.8. 2D action recognition
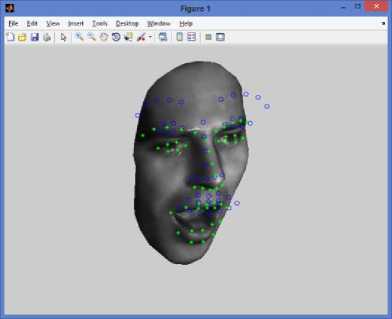
Fig.11. Traditional 3D Facial Pose estimation using Edge based Model
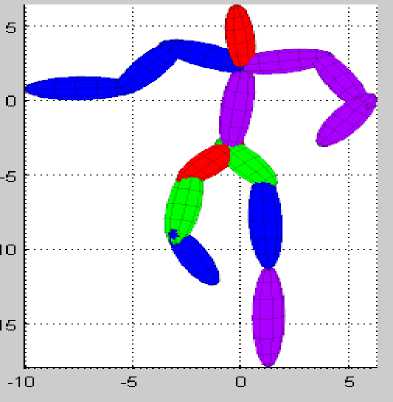
Fig.9. 2D X-Y Directional View
Fig. 11. Shows the 3D facial expression evaluated using the proposed graph based edge detection model. From the figure, it is observed that green marks are identified using our proposed model as facial three dimensional expressions and blue marks indicates the traditional otsu’s based edge detection model.
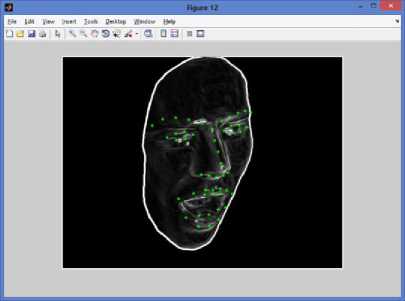
Fig.12. Proposed Ensemble based 3D Facial Pose Estimation Model
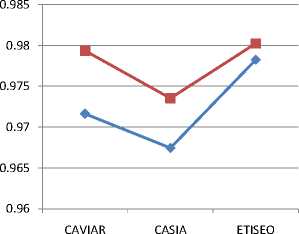
Table 1. True Positive rate of the existing and proposed model on 2D video sequences
|
2D-Dataset |
Avg TPR(EHPM) |
Proposed ECGPM |
|
CAVIAR |
0.97163 |
0.97935 |
|
CASIA |
0.96744 |
0.98353 |
|
ETISEO |
0.97824 |
0.98024 |
Table.1. shows the average true positive rate of the enhanced hybrid probabilistic model and the proposed ensemble based chaining graph probabilistic model. By observing the table it is clear that the proposed technique can perform better true positive rate compare to the existing technique .
— ♦ —Avg TPR(EHPM)
- ■ =Proposed ECGPM
Fig.13. Avg True Positive Rate of the existing and proposed model
Fig.13., shows the average true positive rate of the enhanced hybrid probabilistic model and the proposed ensemble based chaining graph probabilistic model. By observing the table it is clear that the proposed technique can perform better true positive rate compare to the existing technique .
Table 2. RunTime comparison of proposed and existing models on 2Dpose estimation.
|
Algorithm |
RunTime(Secs) |
|
Texture based Pose Estimation |
163 |
|
JBPCG |
154 |
|
EJBPCG |
139 |
|
Proposed Model |
125 |
Table 2. describes the runtime comparison of proposed and existing model on 2D-videos and 3D-facial expression evaluation. From this table, it is observed that proposed model has less runtime compared to traditional models.
Table 3. RunTime comparison of proposed and existing models on 3Dfacial expression evaluation
|
Algorithm |
RunTime(Secs) |
|
Texture based Pose Estimation |
NA |
|
JBPCG |
89 |
|
EJBPCG |
78 |
|
Proposed Model |
64 |
Table 3. describes the runtime comparison of proposed and existing model on 3D-facial expression evaluation. From this table, it is observed that proposed model has less runtime compared to traditional models.
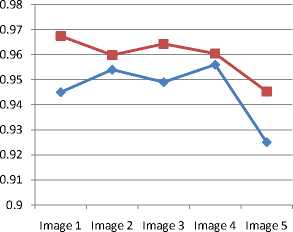
Table 4. True Positive Rate of the existing and proposed model on 3D facial pose estimation
|
3D-Dataset |
Avg TPR(EHPM) |
Proposed ECGPM |
|
Image 1 |
0.945 |
0.9674 |
|
Image 2 |
0.954 |
0.9598 |
|
Image 3 |
0.949 |
0.9643 |
|
Image 4 |
0.956 |
0.9604 |
|
Image 5 |
0.925 |
0.9453 |
Table 4. Shows the average true positive rate of the enhanced hybrid probabilistic model and the proposed ensemble based chaining graph probabilistic model. By observing the table it is clear that the proposed technique can perform better true positive rate compare to the existing technique .
— ♦ —Avg TPR(EHPM)
- ■ -Proposed ECGPM
Fig.14. True Positive Rate of the existing and proposed model on 3D facial pose estimation
Fig.14, shows the average true positive rate of the enhanced hybrid probabilistic model and the proposed ensemble based chaining graph probabilistic model. By observing the table it is clear that the proposed technique can perform better true positive rate compare to the existing technique .
V. Conclusion
In this paper, we have proposed a novel 2D /3D joint ensemble chaining graph model for pose detection. Traditional directed and undirected graphical models such as Bayesian Markov model, conditional random field have limitations with arbitrary pose estimation in 2D/3D images using the joint probabilistic model. To overcome these issues, we introduce an ensemble chaining graph model to estimate arbitrary human poses in 2D video sequences and facial expression evaluation in 3D images. This system has three main hybrid algorithms, namely 2D/3D human pose pre-processing algorithm, ensemble graph chaining segmented model on 2D/3D video sequence pose estimation and 3D ensemble facial expression detection algorithm. The experimental results on public benchmarks 2D/3D datasets show that our model is more efficient in solving arbitrary human pose estimation problem. Also, this model has high true positive rate, low false detection rate compared to traditional joint human pose detection models. In future, this work can be extended to detect various 3D motion detection using a hybrid multi-objective based probabilistic graphical segmentation model.
References A Novel Joint Chaining Graph Model for Human Pose Estimation on 2D Action Videos and Facial Pose Estimation on 3D Images
- http://tosca.cs.technion.ac.il/data/face.zip
- Y. Freund and R. E. Schapire. A decision-theoretic generalization on on-line learning and an application to boosting. Journal of Computer and System Sciences, 55(1):119–139, 1997.
- A. H. Gee and R. Cipolla. Determine the gaze of faces in images. Image and Vision Computing, 12(10):639–647, 1994.
- C. Dharmagunawardhana, S. Mahmoodi, M. Bennett and M. Niranjan, "Gaussian Markov random field based improved texture descriptor for image segmentation", Image and Vision Computing, vol. 32, no. 11, pp. 884-895, 2014.
- B. Sun and J. He, "Discriminative dictionary based representation and classification of image texture", Sixth International Conference on Digital Image Processing (ICDIP 2014), 2014.
- N. Wang, "Color Image Edge Detection Based on Cube Similarity", 2015 IEEE International Conference on Computational Intelligence & Communication Technology, 2015.
- X. Zhang and C. Liu, "An ideal image edge detection scheme", Multidimensional Systems and Signal Processing, vol. 25, no. 4, pp. 659-681, 2013.
- K. Zhang and K. Lam, "A Level Set Approach to Image Segmentation With Intensity Inhomogeneity", IEEE Trans. Cybern., vol. 46, no. 2, pp. 546-557, 2016.
- E. Murphy Chutorian and M. Manubhai Trivedi, Head Pose Estimation in Computer: A Survey, IEEE Transaction on Pattern Analysis and Machine Intelligence, Vol. 31. No.4, pp. 607627, 2009.
- G. Fanelli, J. Gall, and L. Van Gool, "Real time head pose estimation with random regression forests," in CVPR, 2011.
- K.I. Chang, K.W. Bowyer, P.J. Flynn, "An evaluation of multi-model 2D+3D biometrics", IEEE Transactions on Pattern Analysis and Machine Intelligence 27 (4) (2005) 619–624.
- P. S. Hiremath, Manjunatha Hiremath,"Depth and Intensity Gabor Features Based 3D Face Recognition Using Symbolic LDA and AdaBoost", IJIGSP, vol.6, no.1, pp.32-39, 2014.DOI: 10.5815/ijigsp.2014.01.05.
- K.I. Chang, K.W. Bowyer, P.J. Flynn, "Multiple nose region matching for 3D face recognition under varying facial expression", IEEE Transactions on Pattern Analysis and Machine Intelligence 28 (10) (2006) 1695–1700.
- P. S. Hiremath, Manjunatha Hiremath,"3D Face Recognition based on Radon Transform, PCA, LDA using KNN and SVM", IJIGSP, vol.6, no.7, pp.36-43, 2014.DOI: 10.5815/ijigsp.2014.07.05.
- Kevin W. Bowyer, Kyong Chang, Patrick Flynn, "A survey of approaches and challenges in 3D and multi-modal 3D + 2D face recognition", Computer Vision and Image Understanding 101, 1–15 (2006).
