A parallel fusion method of remote sensing image based on NSCT

Author: Xue Xiaorong, Xiang Fang, Wang Hongfu
Journal: Компьютерная оптика @computer-optics
Section: Обработка изображений, распознавание образов
Article in issue: 1 т.43, 2019.
Free access
Remote sensing image fusion is very important for playing the advantages of a variety of remote sensing data. However, remote sensing image fusion is large in computing capacity and time consuming. In this paper, in order to fuse remote sensing images accurately and quickly, a parallel fusion algorithm of remote sensing image based on NSCT (nonsubsampled contourlet transform) is proposed. In the method, two important kinds of remote sensing image, multispectral image and panchromatic image are used, and the advantages of parallel computing in high performance computing and the advantages of NSCT in information processing are combined. In the method, based on parallel computing, some processes with large amount of calculation including IHS (Intensity, Hue, Saturation) transform, NSCT, inverse NSCT, inverse IHS transform, etc., are done. To realize the method, multispectral image is processed with IHS transform, and the three components, I, H, and S are gotten. The component I and the panchromatic image are decomposed with NSCT...
Image fusion, remote sensing image, panchromatic image, multispectral image, nonsubsampled contourlet transform, ihs transform, parallel computing
Short address: https://sciup.org/140243260
IDR: 140243260 | DOI: 10.18287/2412-6179-2019-43-1-123-131
Text of the scientific article A parallel fusion method of remote sensing image based on NSCT
Acknowledgments : The work was supported in part supported by (1) the Fund Project of National Natural Science of China(U1204402), (2) the Foundation Project(21AT-2016-13) supported by the twenty-first century Aerospace technology Co., Ltd., China, (3) the Natural Science Research Program Project (18A520001) supported by the Department of Education in Henan Province, China.
the improvement of the performance of the computer takes large cost. The traditional serial data processing algorithm can’t meet the requirements with both high accuracy and high speed, so it is significant for the application of a variety of earth observation satellites to use other way to study rapid integration of remote sensing image [1–5, 11–13, 15–17].
As a multi-scale geometric analysis tool, wavelet transform has good space and frequency domain locality, it has been widely used in the field of image fusion. Wavelet transform is optimal in the singularity analysis of point-like transient characteristics, but it is not optimal in expressing the straight line/curve singularity of image structure [11]. In order to solve the limitation of wavelet, the new theories develop constantly [12]. In Literature [8], a multi-direction and multi-resolution image representation is proposed, which is just Contourlet transform theory. To solve the 2D or higher singularity, the Contourlet transform arose as a new analysis tool, this transformation has the main features of very good directional sensitivity and anisotropy, can accurately capture edge information of image on different scales and frequency subband. Therefore, better results of image enhancement and denoising can be achieved with Contourlet transform than wavelet transform. The
Contourlet transform is applied to image fusion, and good fusion effect is achieved [6, 9]. But because of the need for upsampling and downsampling, the Contourlet transform is lack of translation invariance, leading to that the Gibbs effect is introduced in image processing. In Literature [6], a Contourlet transform of translational invariance is proposed, which is nonsubsampled Contourlet transform (NSCT). The transformation gets shift-invariant, multi-resolution, multi-direction image representation capability by iterative nonsubsampled filter banks, and for its translation invariant and excellent expression ability of image geometric features, especially the edge direction information, the characteristics of original images are effectively extracted, providing richer information for the fused image. Therefore, NSCT has great advantages in information processing.
In the high performance computing, parallel cluster computing system has higher cost performance and good scalability, can satisfy the different sizes of large computational problems, so it is paid more and more attention [18]. In the paper, based on the advantages of the parallel computing in high performance computing, and NSCT [5] in information processing, a parallel fusion method of remote sensing image based on NSCT is studied and proposed, and two important kinds of remote sensing image, multispectral image and panchromatic image are used in the method. The experimental results show that the proposed fusion method can achieve better fusion effect of remote sensing image, and faster computing speed [10].
-
2. The construction of NSCT
-
3. IHS transform
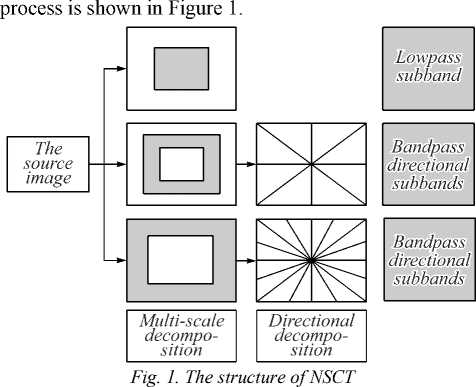
In Contourlet transform, multi-scale and multidirectional analysis are carried out separately, firstly, with the Laplacian pyramid (LP) transform, multi-scale decomposition of an image is done. By one LP decomposition, the original image can produce a low-pass sub-band image (low-frequency component) and a band-pass subband image (high-frequency component), after that, each level of LP decomposition can be iterated on the low-pass subband image. By LP decomposition, the singular point of the original image can be effectively captured. The high frequency component of every one LP decomposition is decomposed with the designed directional filter group (directional filter bank, DFB), finally, the singular points distributed in the same direction are connected into a contour segment. The Contourlet transform can ultimately approximate the source image with the base structure similar to the contour, which is the reason known as the Contourlet.
Like Contourlet transform, NSCT also uses the LP transform and DFB double iterative filter bank structure composed by DFB. The difference between NSCT and Contourlet transform is that the NSCT uses a nonsubsampled pyramid and nonsubsampled DFB, and it uses the equivalent shift bit nature of the Z-transform, removing downsampling (extraction) after signal filter analysis as well as upsampling (interpolation) prior to comprehensive filtering in the LP decomposition and DFB decomposition, instead, the corresponding filter is changed into upsampling, then analysis filter and comprehensive filter of the signal are done. Since there is no upsampling and downsampling, all the decomposition subbands are the same size as the original image, translation invariance is gotten in the NSCT [6–9].
NSCT consists of a nonsubsampled pyramid filter bank (NSP) and a nonsubsampled directional filter bank (NSDFB) [17]. The size of the sub-band image obtained in this process is the same as that of the source image, which is conducive to the formulation of fusion rules. The decomposition in the nonsubsampled pyramid filter bank (NSP) is done by a two-channel non-sampling filter bank operation. In NSP, the Atrous algorithm is refered [13], and non-subsampling tower decomposition is repeated on an image, making the image has multi-scale. The nonsubsampled directional filter bank (NSDFB) is implemented by a two-channel non-sampling filter bank constructed by sector-oriented filters. Similar to NSP, the same two-channel directional filter bank decomposition is repeated on the image to make the image multi-direction. Since there are no upsampling and downsampling steps in both NSP and NSDFB decomposition, the spectral aliasing is eliminated, and therefore more translational invariance than Contourlet transform is provided. The specific process of NSCT transform is that the input source image is convolved with the 2-dimensional filter mask to obtain a low frequency approximation image. The difference between the source image and the low frequency image is the high frequency detail, and then the high frequency detail is decomposed by the NSDFB filter to obtain the direction details. The structure of the NSCT
RGB colorimetric systems are commonly used when colors are processed quantitatively on computers, but using IHS systems is more intuitive when colors are visually characterized. In the IHS transform, I,H and S respectively represent the brightness or intensity (I), the hue (H) and the saturation (S), which are the three characteristics which recognize the color from the human eye. Brightness refers to the human eye’s feeling on the brightness of the light source or object, in general, brightness is proportional to the reflectivity of the object.
Hue, also known as color, which refers to the color of the category, is the features of each other's distinguishing for colors. Saturation refers to the purity of color, in general, the more vibrant the color, the greater the saturation.
In order to realize the conversion from RGB to IHS, a relation model between RGB space and IHS space should be established. Common transformations are spherical color transform, cylinder color transform, triangle color transform and single hexagon cone color transform. IHS algorithm is an early development of image fusion technology, now a mature algorithm for spatial transformation. Through the analysis of test results, the sphere transformation and the triangle transformation are the ideal IHS transformation forms. From the computational volume, the spherical transformation are eliminated, and so the triangular transformation are the most ideal form. The IHS algorithm with the triangular transform can well preserve the spectral information and spatial resolution of source image, the amount of computation is also small, and be easy to implement.
The IHS fusion process in the step 2 is a triangular transformation fusion in the IHS fusion. The triangular transformation is calculated as follows:
I = 3( r + G + B ), (1)
S = 1 - M R , G,B ) ] , (2)
R + G + B

Where,
-9
when B < G when B > G
9 = arccos
2 [ ( R - G ) + ( R - B ) ] [ ( R - G )2 + ( R - B )( G - B ) ] '/ 2
The corresponding inverse transform is ' B = I (1 - S )
S cos H
^ R = I 1 +
[ cos(60 o - H ) G = 3 1 - ( R + B )
' B = I (1 - S )
when 0 o < H < 120 o ,
S cos( H - 120 o )
^ R = I 1 +
L cos(60 o - ( H - 120 o ))
G = 31 - (R + B)
when 120 ° < H < 240 ° .
B = I (1 - S )
S cos( H - 240 o )
^ R = I 1 +
L cos(60 o - ( H - 240 o ))
_ G = 3 1 - ( R + B ) when 240 ° < H < 360 ° .
-
4. Image fusion based on NSCT and IHS transform
The significance of image fusion based on NSCT lies in that NSCT inherits the excellent local characteristics of wavelet transform in spatial and frequency domain, but it has stronger expression ability of image geometric features than wavelet transform. The reason is that the wavelet transform has only limited directions (horizontal, vertical and diagonal direction), and it is isotropic. However, NSCT has directions of arbitrary angle, it is anisotropic, and it has stronger expressive ability of image information along edges. In image processing, edge is often a kind of most important feature, but in the actual environment, image edge is often weakened by other factors such as noises [13], etc. In this case, the advantages of NSCT with strong expressive ability of image information along edges and the ability of shift invariant, are self-evident for restoring the visual characteristics of main structure of image. Therefore, by introducing NSCT into image fusion, the characteristics of the source image can be extracted better, and more information for the fusion image can be provided.
By multi-resolution (such as wavelet, NSCT) decomposition of image, the low frequency part obtained represents approximate component of image, which contains the spectral information of the original image. The high frequency part represents the detail component of image, which contains the edge detail information of the original image. Therefore, the choice of the fusion algorithms (namely the fusion rules) after decomposition is very crucial for fusion quality. The current widely used fusion rules can be summarized as fusion rules based on pixel and fusion rules based on feature. From the characteristics of human visual system, eyes are not sensitive on the gray value of single pixel. Clearness of image is reflected by all the pixels together in an image area. Therefore, the fusion rule based on the pixel has certain limitation. The fusion rule based on neighborhood characteristics is that neighborhood variance, energy, gradient feature surrounding a position of image (the characteristics can reflect whether the position is important information of the image) are used as measures to guide the coefficient selection in the position, the size of neighborhood is generally taken as a small window. Currently, more commonly used fusion operators are general that an average operator or a weighted average operator is used in the low frequency part, operator of maximal absolute value is used in the high frequency part. Because the multi-spectral image has richer spectral information than panchromatic image, when the average or a weighted average operator strategies are used in the low-frequency part, some spectral information of the multi-spectral image will lose, and the spectral information of the fused image is inferior to the multi-spectral image[10, 11, 15]. To obtain the fusion effect with better visual characteristics and richer prominent details, two effective fusion rules based on the neighborhood feature are used:
-
(1) Selection of low frequency coefficient. Because the low frequency part reflects the similar properties of the
original image, concentrates the most information of the original image, and account for larger proportion of the image energy, the energy feature information of the neighborhood surrounding a pixel of the image can be used to guide the choice of low frequency coefficient. Firstly, a pixel's neighborhood energy is defined as the following,
E l (i , j) = s ftom , n) .
(m,n) e Win
In the formula, E l ( i, j )( l = A, B ) is the energy of the neighborhood of the pixel ( i , j ) in the image. f ( l ) ( m, n ) ( l = A, B) is the gray value of the pixel ( m , n ), i – k ≤ m ≤ i + k , j – k ≤ n ≤ j + k , Win = 2* k + 1, k = 1, 2,..., Win is the size of the neighborhood.
And then the matching degree of the two images in the neighborhood window is calculated,
Ma в ( I , j ) =------------------ x
E a ( i , j ) + E b ( i , j )
X S f A ) ( m , n ) f B ) ( m , n ).
( m , n ) e W in
According to the matching size, the low frequency coefficients are selected or averaged on weight. If the matching degree is less than a certain threshold, it is indicated that the two images have larger space characteristic differences in the location, and the low frequency coefficient with larger energy of window is selected as the low frequency coefficient of the fusion image. On the contrary, the low frequency coefficients are processed by weighting, the weights are calculated according to the equation (9).
W min = 2
1 Г 1 - M ab ^ 2 ( 1 -X )
w„ = 1 — max min .
Generally, the threshold λ can be assigned 0.5~1, in the paper, λ = 0.8(the value of λ can refer to the distribution histogram of the matching degree, MAB). Low frequency coefficient selection is summarized as the following, cF (i, j) =
C a ( i , j ), M ab ( i , j ) ^ X and E a ( i , j ) > E b ( i , j ), C b ( i , j ), M ab ( i , j ) ^ X and E a ( i , j ) < E b ( i , j ),
= <
wmax X Ca (i, j) + wmin x Cb (i, j), Mab (i, j) > X, (10) and Ea (i, j) > Eb (i, j), wmin X Ca (i, j) + Wmiax x Cb (i, j), Mab (i, j) > X,
_ and E a ( i , j ) < E b ( i , j ).
In the formula, c l ( i, j ), l = A, B , F is the low frequency coefficient of the pixel ( i , j ) in the image.
(2)Selection of high frequency coefficients. The high frequency subband after NSCT decomposition represents the detail component of the image, and the greater the regional variance of the high frequency subband, the higher the original image clarity in the corresponding region, therefore the neighborhood variance characteristics information of high frequency coefficients can be used to guide the choice of high frequency coefficients. The neighborhood variance of a high frequency coefficient is defined as the following:
STD i , s , t ( i , j ) = S (I d i , ^ . t ( m , n )| - du,. ) 2 . (11)
( m, n ) e W in
In the formula, STD l,s,t ( i, j )( l = A, B) is the neighborhood high frequency coefficient variance at the pixel ( i , j ) at the direction t in the decomposition layers of the fig. l. d l,s,t ( m, n )( l = A, B) is the high frequency coefficient at the pixel ( i , j ) at the direction t in the decomposition layer s of the image l. d l , s , t ( l = A , B ) is the mean of the absolute values of the high frequency coefficients in the neighborhood, i – k ≤ m ≤ i + k , j – k ≤ n ≤ j + k , Win=2* k + 1, k =1,2,…
Select the high-frequency coefficients of the original image with the larger neighborhood high frequency coefficient variance as the high frequency coefficients of the fusion image dF,s,t ( i, j) =
= Г d A , s,t (i, j) STD A_st (i, j) > STD b , s , t ( i, j ), (12) I d B , s , t (i, j) STD A,s,t (i, j) < STD b , s , t (i, j).
In the formula, d l,s,t ( m, n )( l = A, B) is the high frequency direction coefficient at the point ( i , j ) at the direction t in the decomposition layer s of the image l.
-
5. The detailed steps of the parallel fusion method of multi-spectral image and panchromatic image based on NSCT proposed in the paper
The calculation quantity of some processes of remote sensing images in the proposed fusion method including NSCT and inverse NSCT, IHS and inverse HIS, etc., is very vast, and for large images, this situation is more prominent. For that, the cost time is long. The processes of remote sensing images including NSCT and inverse NSCT, IHS and inverse HIS, etc. can be calculated directly in parallel computing surrounding. By that, the fusion speed can be improved greatly.
Take the fusion of two source remote sensing images, Mu(multi-spectral image) and Pa(panchromatic image) as an example, the basic steps of the parallel remote sensing image fusion based on NSCT are as the follows,
Step 1, the Mu is decomposed with the IHS transform, and the I, H, S, component are gotten. The I component after treatment and the Pa are decomposed with multistage NSCT respectively, and different scale layer of NSCT coefficients, including the low frequency coefficients and the different scale layer of high frequency direction coefficients are gotten. The processes of IHS and NSCT are done with parallel computing.
Step 2, in accordance with the two effective fusion rules in the paper, and with parallel computing, the low frequency part and high frequency parts are integrated, and the low frequency coefficients of fusion and the high frequency direction coefficients of fusion in different scale layers are finally gotten.
Step 3, with parallel computing, the low frequency coefficients of fusion and the directional high frequency coefficients of fusion in different scale layer are operated with inverse NSCT transform, then the reconstructed component INF is gotten.
Step 4, with parallel computing, the component INF, H, S, are operated with inverse IHS transform (the so-called image reconstruction), then the fusion image is finally gotten.
In this paper, the decomposition levels of NSCT are 3, the pyramid filter bank is “9–7” [7], and the directional filter bank is “pkva” [20].
-
6. Experiments and result analysis
For verification of the fusion effect with the proposed method, in this paper, Beijing-1 small satellite images are selected. Beijing-1 Micro-satellite is a high-performance small satellite for earth observation, and it has advanced performance, short development cycle and low cost. The satellite is a small satellite for earth observation with two remote sensors of medium and high resolution, the medium resolution remote sensor is multi-spectral with 32 meters resolution, the high-resolution remote sensor is panchromatic remote sensor with 4 meters resolution, the 4 meters panchromatic band sensor of Beijing-1 microsatellite has currently higher solution among small satellites in China. In promoting economic development and social coordination, it can make full use of satellite’s advantages of remote sensing monitoring such as great range, high speed, data reliability, etc., and strive to serve the society. The launching of Beijing-1 Micro-satellite can bring research value and practical value [14].
We achieve the parallel method on the parallel cluster system. Because the size of the image affects the parallel performance of the algorithm, in the experiments, we use different sizes of the Beijing-1 Micro-satellite images and do experiments with different number of processes. We also do analysis and comparison of the results. The test platform is configured as the following, 8 computers constitute a cluster architecture (one as the management node (also do computing), 7 computing nodes), each node is configured as the following, its CPU is Intel™ Core™2 Duo CPU, memory is 2G, the 8 computers are interconnected through the 100 Mbps Fast Ethernet switch, and the software environment is made up of the Windows XP operating system, NT-MPICH message passing parallel libraries, etc..
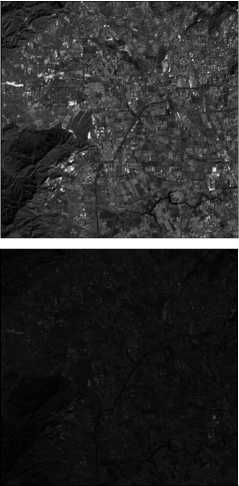
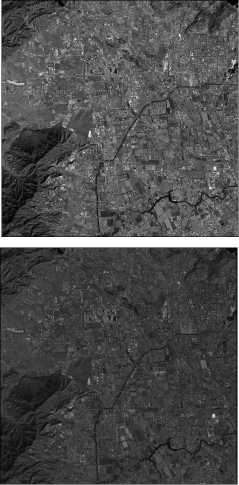
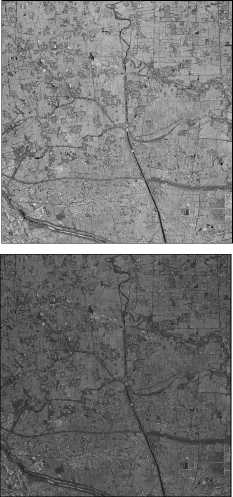
Two groups of registered Beijing-1 small satellite images, including two groups of corresponding panchromatic image and multi-spectral image in which every group of corresponding panchromatic image and multi-spectral image are from the same area, are selected for experiments. Figure 2 a and Figure 2 b are the first group of corresponding panchromatic image and multi-spectral image, and Figure 3 a and Figure 3 b are the second group of corresponding panchromatic image and multi-spectral image. For comparison, the proposed fusion method in the paper, the fusion method based on IHS transform, the fusion method based on Brovey transform[19], the fusion method based on wavelet transform(in the paper, the Daubechies3 wavelet is used, and the decomposing scale is two. The fusion strategy of average value is used for the fusion of the low frequency coefficient, and the fusion strategy of taking the bigger value is used for the fusion of the high frequency coefficient ), are all used for fusion of the two groups of panchromatic image and multi-spectral image.
(f)
(c)
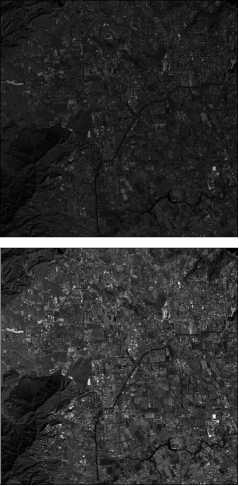
Fig. 2. The experiment one about fusion of the multispectral image and panchromatic image : the multispectral image of Beijing-1 small satellite (a), the panchromatic image of Beijing-1 small satellite (b), the fusion result with the fusion method based on IHS
transform (c), the fusion result with the fusion method based on Brovey transform (d), the fusion result with the fusion method based on wavelet transform (e), the fusion result with the proposed fusion method in the paper (f)
The fusion results based on NSCT and IHS transform are shown in Figure 2 f and Figure 3 f . The fusion results based on IHS transform are shown in Figure 2 c and Figure 3 c . The fusion results based on Brovey transform are shown in Figure 2 d and Figure 3 d . The fusion results based on wavelet transform are shown in Figure 2 e and
(d)
(a)

(e)
(b)
(f)
Figure 3 e . From the visual point of view, with the proposed fusion method, the fused images are better in retaining the multispectral information of scenery feature, and the edge information is prominent, which fully reflects the ability of capturing the information along image edges with the proposed method.
(c)
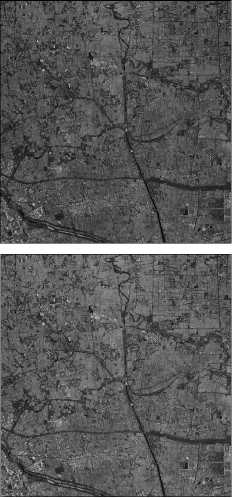
Fig. 3. The experiment two about fusion of the multispectral image and panchromatic image: the multispectral image of Beijing-1 small satellite (a), the panchromatic image of Beijing-1 small satellite (b), the fusion result with the fusion method based on IHS transform (c), the fusion result with the fusion method based on Brovey transform (d), the fusion result with the fusion method based on wavelet transform (e), the fusion result with the proposed fusion method in the paper (f)
the degree of correlation between the fused image and the original image. The larger the correlation coefficient, the bigger the similarity degree between the fused image and the source image, which means that more information is gotten from the original image [9, 15].
-
( 1 ) Information entropy
The traditional information entropy of an image is expressed as:
L - 1
H = -E P i ln Pi. (13)
i = 0
Where L is the number of gray levels, and p i is the ratio of the number of pixels with a gray value of i (0 ≤ i ≤ L –1) and the number of pixels in the entire image. The information entropy is calculated for fused images in this paper.
-
( 2 ) Correlation coefficient
The calculation of the correlation coefficient is the following,
MN
Z£ ( F(i, j ) - F ( A(i, j ) - A )
corr(F,A) = , i = 1 j = 1 . (14)
MN MN
Щ F(i, j ) - F) 2 ££ ( A(i, j ) - A )2 i = 1 j = 1 i = 1 j = 1
corr(F, A) is the correlation coefficient, F(i, j), A(i, j) are respectively the pixel gray values of the pixel (i, j) of the corresponding band of the fused image and the original multi-spectral image, F and A are the gray mean values of the corresponding band of the corresponding images, and M, N are the height and width of the corresponding images.
-
( 3 ) Average gradient
The calculation of the average gradient is the following,
A x g ( i,j ) = F ( i,j ) - F ( i - 1 ,j ), A x g ( i,j ) = F ( i,j ) - F ( i,j - 1),
MN
V g = ™ 1W n JE^A x g 2 ( M ) + A y g 2 ( M )). (16) ( m - 1)( n - 1)^ i = 2 j = 2
V g is the average gradient, F ( i , j' ), F ( i-1,j' ), F ( i , j -1)
are respectively the pixel gray values at the pixel points, ( i , j ), ( i – 1, j ), ( i , j – 1) in one band of the fused image.
-
( 4 ) Standard deviation
MN std = J t! (F (i,j) - F )2. (17)
\ mn - 1 1: 1 j : 1
Where, std is the standard deviation, and F ( i , j ) is the gray value of the pixel ( i , j ) in the fused image, F is the gray mean of the corresponding band of the fused image.
Table 1 and Table 2 give the result value of evaluation index of the fusion methods. It can be seen that the entropy and correlation coefficient of this fusion result with the proposed method are maximal, which shows that the fused images maintains important information of the two source images better, and meets the fusion requirements of information complementation. The average gradient value and standard deviation of the method proposed in this paper are above those with the fusion method based on IHS transform, the fusion method based on Brovey transform, and the fusion method based on wavelet transform, which show that the fused image retains the edge details of the source image better, and image definition is higher. With the above subjective and objective evaluation methods, it is seen that the fusion effect of the proposed method is better than those of the fusion method based on IHS transformation, the fusion method based on Brovey transform, and the fusion method based on wavelet transform.
Table 1. The objective evaluation indexes of the fusion results in the fusion experiment one
|
Image after fusion |
R G B |
Information entropy |
Correlation coefficient |
Average gradient |
Standard deviation |
|
Fusion image |
R |
7.513 |
0.892 |
4.443 |
13.415 |
|
with the fusion method |
G |
7.661 |
0.834 |
4.541 |
17.793 |
|
based on IHS transform |
B |
7.823 |
0.793 |
5.679 |
17.154 |
|
Fusion image with the |
R |
7.527 |
0.862 |
4.332 |
13.169 |
|
fusion method based |
G |
7.696 |
0.853 |
4.533 |
17.695 |
|
on Brovey Transform |
B |
7.831 |
0.787 |
5.586 |
17.014 |
|
Fusion image with the |
R |
7.603 |
0.875 |
4.445 |
14.334 |
|
fusion method based |
G |
7.712 |
0.869 |
4.774 |
18.631 |
|
on wavelet transform |
B |
7.899 |
0.798 |
5.892 |
17.153 |
|
Fusion image |
R |
7.763 |
0.932 |
4.993 |
15.763 |
|
with the proposed |
G |
7.899 |
0.897 |
4.935 |
20.455 |
|
fusion method |
B |
7.967 |
0.893 |
6.336 |
17.387 |
Table 2. The objective evaluation indexes of the fusion results in the fusion experiment two
|
Image after fusion |
R G B |
Information entropy |
Correlation coefficient |
Average gradient |
Standard deviation |
|
Fusion image with the |
R |
7.632 |
0.873 |
4.431 |
12.516 |
|
fusion method based |
G |
7.773 |
0.821 |
4.232 |
16.897 |
|
on IHS transform |
B |
7.965 |
0.765 |
5.378 |
16.965 |
|
Fusion image with the |
R |
7.655 |
0.843 |
4.165 |
12.465 |
|
fusion method based |
G |
7.834 |
0.836 |
4.113 |
16.593 |
|
on Brovey transform |
B |
7.978 |
0.763 |
5.309 |
15.892 |
|
Fusion image with the |
R |
7.754 |
0.879 |
4.553 |
13.989 |
|
fusion method based |
G |
7.987 |
0.856 |
4.612 |
17.993 |
|
on wavelet transform |
B |
7.996 |
0.798 |
5.975 |
16.213 |
|
Fusion image |
R |
7.975 |
0.906 |
4.779 |
15.134 |
|
with the proposed fusion |
G |
8.132 |
0.898 |
4.716 |
19.876 |
|
method |
B |
8.154 |
0.845 |
6.154 |
16.985 |
In analyzing the efficiency of the proposed method, the parameters, the speed-up ratio and parallel efficiency are used,
Speed-up ratio S p ( q ) = T s / T p ( q ).
Parallel efficiency E p ( q ) = S p ( q )/ q . (19)
Where, T s is the serial execution time, T p ( q ) is the parallel execution time with q processors.
Table 3 gives the cost time , the speed-up ratio and parallel efficiency of fusion for images of Beijing-1 Micro-satellite with different size on 1, 2, 4 and 8 computers respectively. The experiment results show that good result of fusion can be obtained quickly with the proposed method. On the other hand, the method’s parallel performance is affected by the communication time, the time can be reduced by some measures such as improving the network bandwidth, shortening waiting time among nodes, etc. By reducing the communication time, the parallel efficiency will be improved.
Table 3. The speed-up ratio and parallel efficiency
|
N |
1 |
2 |
4 |
8 |
|
|
Fusion one |
Time cost (ms) |
38276 |
19597 |
12095 |
8153 |
|
Speed-up ratio |
1 |
1.9532 |
3.1646 |
4.6947 |
|
|
Efficiency |
1 |
0.9766 |
0.7912 |
0.5868 |
|
|
Fusion |
Time cost (ms) |
516829 |
267717 |
165902 |
114219 |
|
two |
Speed-up ratio |
1 |
1.9305 |
3.1153 |
4.5249 |
|
Efficiency |
1 |
0.9653 |
0.7788 |
0.5656 |
|
Conclusions
To solve the defects of image fusion methods in the wavelet domain, the NSCT is introduced into the field of remote sensing image fusion, and a parallel remote sensing image fusion method in the NSCT domain based on regional characteristics is proposed. NSCT has image representation capability with invariant translation, multiresolution and multi-direction, and can effectively extract the characteristics information of the source image. In the integration process, taking into account the local and regional characteristics of remote sensing images, different fusion rules based on regional characteristics are used respectively in low frequency sub-band and high frequency sub-band. In the proposed method, to get high speed fusion, parallel computing is also used. The experimental results show that better fusion effect can be gotten with the proposed method, and the fusion speed is high.
References A parallel fusion method of remote sensing image based on NSCT
- Yang, Y. Multiple visual features measurement with gradient domain guided filtering for multisensor image fusion/Y. Yang, Y. Que, S. Huang, P. Lin//IEEE Transactions on Instrumentation and Measurement. -2017. -Vol. 66, Issue 4. -P. 691-703. - DOI: 10.1109/TIM.2017.2658098
- Song, H. Spatiotemporal satellite image fusion using deep convolutional neural networks/H. Song, Q. Liu, G. Wang, R. Hang, B. Huang//IEEE Journal of Selected Topics in Applied Earth Observations and Remote Sensing. -2018. -Vol. 11, Issue 3. -P. 821-829. - DOI: 10.1109/JSTARS.2018.2797894
- Chen, Y. Robust multi-focus image fusion using edge model and multi-matting/Y. Chen, J. Guan, W.-K. Cham//IEEE Transactions on Image Processing. -2018. -Vol. 27, Issue 3. -P. 1526-1541. - DOI: 10.1109/TIP.2017.2779274
- Luo, X. Image fusion with contextual statistical similarity and nonsubsampled shearlet transform/X. Luo, Z. Zhang, B. Zhang, X. Wu//IEEE Sensors Journal. -2017. -Vol. 17, Issue 6. -P. 1760-1771. - DOI: 10.1109/JSEN.2016.2646741
- Chien, C.-L. Image fusion with no gamut problem by improved nonlinear HIS transforms for remote sensing/C.-L. Chien, W.-H. Tsai//IEEE Transactions on Geoscience and Remote Sensing. -2014. -Vol. 52, Issue 1. -P. 651-663. - DOI: 10.1109/TGRS.2013.2243157
- Da Cunha, A.L. The nonsubsampled Contourlet transform: Theory, design, and applications/A.L. Da Cunha, J. Zhou, M.N. Do//IEEE Transactions on Image Processing. -2006. -Vol. 15, Issue 10. -P. 3089-3101. -
- DOI: 10.1109/TIP.2006.877507
- Do, M.N. Framing pyramids/M.N. Do, M. Vetterli//IEEE Transactions on Signal Processing. -2003. -Vol. 51, Issue 9. -P. 2329-2342. -
- DOI: 10.1109/TSP.2003.815389
- Do, M.N. The Contourlet transform: An efficient directional multiresolution image representation/M.N. Do, M. Vetterli//IEEE Transactions on Image Processing. -2005. -Vol. 14, Issue 12. -P. 2091-2106. -
- DOI: 10.1109/TIP.2005.859376
- Bhatnagar, G. Directive contrast based multimodal medical image fusion in NSCT domain/G. Bhatnagar, Q.M.J. Wu, Z. Liu//IEEE Transactions on Multimedia. -2013. -Vol. 15, Issue 5. -P. 1014-1024. -
- DOI: 10.1109/TMM.2013.2244870
- da Cunha, A.L. The nonsubsampled Contourlet transform: Theory, design, and applications. IEEE Transactions on Image Processing. -2006. -Vol. 15, Issue 10. -P. 3089-3101. -
- DOI: 10.1109/TIP.2006.877507
- Shahdoosti, H.R. Fusion of MS and PAN images preserving spectral quality. IEEE Geoscience and Remote Sensing Letters. -2015. -Vol. 12, Issue 3. -P. 611-615. -
- DOI: 10.1109/LGRS.2014.2353135
- Choi, J. A new adaptive component substitution based satellite image fusion by using partial replacement/J. Choi, K. Yu, Y. Kim//IEEE Transactions on Geoscience and Remote Sensing. -2010. -Vol. 49, Issue 1. -P. 295-309. -
- DOI: 10.1109/TGRS.2010.2051674
- Ma, J. Wavelet fusion on ratio images for change detection in SAR images/J. Ma, M. Gong, Z. Zhou//IEEE Geoscience and Remote Sensing Letters. -2012. -Vol. 9, Issue 6. -P. 1122-1126. -
- DOI: 10.1109/LGRS.2012.2191387
- Qingxi, T. Beijing-1 micro-satellite and its data applications/T. Qingxi, W. Zheng//Spacecraft Engineering. -2007. -Vol. 16, Issue 2. -P. 1-5.
- Ban, Y. Object-based fusion of multitemporal multiangle ENVISAT ASAR and HJ-1B multispectral data for urban land-cover mapping/Y. Ban, A. Jacob//IEEE Transactions on Geoscience and Remote Sensing. -2013. -Vol. 51, Issue 4. -P. 1998-2006. -
- DOI: 10.1109/TGRS.2012.2236560
- Jiang, Y. Image fusion using multiscale edge-preserving decomposition based on weighted least squares filter/Y. Jiang, M. Wang//IET Image Processing. -2014. -Vol. 8, Issue 3. -P. 183-190. -
- DOI: 10.1049/iet-ipr.2013.0429
- Miao, Z. Information fusion for urban road extraction from VHR optical satellite images/Z. Miao, W. Shi, A. Samat, G. Lisini, P. Gamba//IEEE Journal of Selected Topics in Applied Earth Observations and Remote Sensing. -2016. -Vol. 9, Issue 5. -P. 1817-1829. -
- DOI: 10.1109/JSTARS.2015.2498663
- Aulí-Llinàs, F. Bitplane image coding with parallel coefficient processing/F. Aulí-Llinàs, P. Enfedaque, J.C. Moure, V. Sanchez//IEEE Transactions on Image Processing. -2016. -Vol. 25, Issue 1. -P. 209-219. -
- DOI: 10.1109/TIP.2015.2484069
- Mandhare, RA. Pixel-level image fusion using brovey transforme and wavelet transform/R.A. Mandhare, P. Upadhyay, S. Gupta//International Journal of Advanced Research in Electrical, Electronics and Instrumentation Engineering. -2013. -Vol. 2, Issue 6. -P. 2690-2695.
- Zhang, S. A novel optimization design approach for Contourlet directional filter banks/S. Zhang, G. Yang, Z. Cheng, H. van de Wetering, C. Ikuta, Y. Nishio//IEICE Electronics Express. -2014. -Vol. 11, Issue 17. -P. 1-11. -
- DOI: 10.1587/elex.11.20140556
