A PDE based Method for Speckle Reduction of Log-compressed Ultrasound Image

Author: Jie Huang, Xiaoping Yang
Journal: International Journal of Image, Graphics and Signal Processing(IJIGSP) @ijigsp
Article in issue: 3 vol.3, 2011.
Free access
Speckle noise is widely existence in coherent imaging systems, such as synthetic aperture radar, sonar, ultrasound and laser imaging, and is commonly described as signal correlated. In this paper, we focus on speckle reduction problem in real ultrasound image. Unlike traditional anisotropic diffusion methods usually taking image gradient as a diffusion index, in this paper, we present a new texture based anisotropic diffusion method for speckle reduction in real ultrasound image. The results comparing our new method with other well known methods on both synthetic images and real ultrasound images are reported to show the superiority of our method in keeping important features of real ultrasound images.
Speckle reduction, Log-compressed ultrasound image, anisotropic diffusion, texture
Short address: https://sciup.org/15012136
IDR: 15012136
Text of the scientific article A PDE based Method for Speckle Reduction of Log-compressed Ultrasound Image
Published Online April 2011 in MECS
As we all know, medical ultrasound imaging is a low-cost, practically harmless to the human body, noninvasive, and real time imaging modality. However, medical ultrasound images suffer from speckle noise which appears in all coherent imaging systems such as synthetic aperture radar(SAR), sonar(SAS), ultrasound and laser imaging. Image information under coherent waves results in a granular pattern that is speckle. Speckle is an undesirable property as it can mask small but perhaps diagnostically significant image features.
A multiplicative form:
f = un . (1)
has been generally used to model speckle noise. Where f is the observed noisy image, u is the echogenicity or ground truth of the image, and n is the noise term [1]. In the literature, numerous methods for speckle reduction were proposed. There are adaptive filters, such as Lee filter [2], Kuan filter [3], Frost Filter [4]; MAP estimator based filters, such as Gamma-MAP filter [5], RayleighMAP filter [6]. Wavelet based methods de-noise by selecting threshold in different scales, such as [7] [8]. There are also variational based methods which usually include a regularization term and a data fitting term based on speckle statistics [9][10]. In [11], a PDE based anisotropic diffusion method, which is known as SRAD method, was proposed based on estimated local variance. Although the existing speckle reduction methods are termed as 'edge/feature preserving', effective speckle reduction requires an accurate image model of ultrasound signals.
One of practical factor should be considered in speckle reduction of medical ultrasound image is that a log-compression algorithm is incorporated in the preprocessing of medical echographic equipment in order to adjust the large echo dynamic range (60-100 dB) to the 8 bits of the digitization in the scanconverter and also helps to enhance the weak backscatterers [12][13]. This nonlinear transform totally changes the statistics of speckle noise and the image model.
A Log-compressed ultrasound image model is proposed in [14]:
f = u + Цйп (2)
Where f is the noisy signal, u is the true signal, n is a zero mean, white Gaussian noise with variance S n . In this paper, we will consider this image model for speckle reduction of ultrasound image.
This paper is organized as follows. In section II, we obtain a texture based anisotropic diffusion model for speckle reduction of Log-compressed ultrasound image. Section III is the numerical implementation of the proposed model. In section IV, we present some numerical experiments to illustrate the efficiency of the proposed method.
-
II. Texture based anisotropic diffusion
-
A. Description of Ultrasound Image Texture
Consider u as the product of a constant u c and its texture part R in (2), that is u = U c R . Where u c represents the mean strength of the signal, and R describes the homogeneous degree of the tissue. It’s natural to assume that the mean of texture is equal to one. Thus, (2) can be rewritten as:
f = uR + л luJtn cc
By the definition, the variance of the noisy image is represented as:
S f = E ( f 2 ) - E 2 ( f ) (4)
Because R and n are independent random variables.
Therefore, S f can be calculated as:
S f = u2 E ( R 2) + 2 u 2 E ( R 2 ) E ( n )
+ u c E ( R ) E ( n 2) - u2 E 2 ( R ) - u c E 2 (T R ) E 2 ( n )
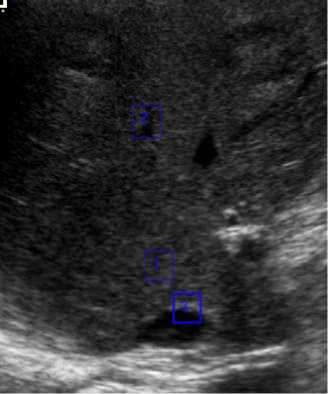
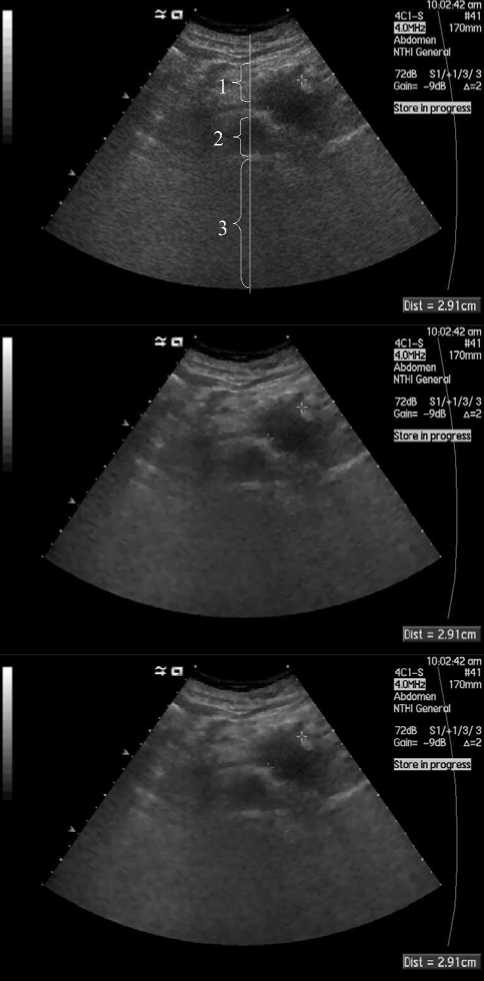
Figure 1. Selected different regions of a real ultrasound image. Region1:homogeneous region , S R = 134.1 is caused only by noise; Region2: region with small texture, S R = 180.7 is the co-effect of noise and texture; Region3: regions with edges, S 12 = 578.6 , edge is large texture.
= u 2 E ( R 2 ) + ucE ( n 2 ) - u R E 2 ( R )
22 2
= u c S R + u c S n
Where S R is the variance of the texture. And, we have:
S R
S f
^^^^^^^^^.
u S S cn
u
2 c
In a homogeneous region, u is a constant and it's equal to uc and S R is equal to zero; and S R is direct proportion to the homogeneous degree of the region, more inhomogeneous the region is, bigger S R 2 is(see Fig.1). And, inhomogeneous regions usually reflect important clinical diagnosis information, such as edges, lesions, tumors and so on. Therefore, the information in areas with large S R 2 should be kept in speckle reduction.
B. Speckle Reduction via Anisotropic Diffusion
Perona and Malik in [15] proposed the following nonlinear PDE for smoothing image on a continuous domain(PM model):
V = div [ c (| V u |) V u ]
< 5 1 (6)
u ( t = 0) = f
or c (x) = e-(x'K )2
Where K is an edge magnitude parameter which adjust the diffusion degree with respect to image gradient. PM model performs well for images corrupted with additive Gaussian noise. However, the use of gradient magnitude as an edge detector is not applicable in ultrasound images which is corrupted by speckle noise. In [11], the authors proposed a speckle reducing anisotropic diffusion(SRAD) method by replacing the gradient magnitude with an estimation of the standard deviation of noise:
— = div [ c (| V u |) V u ]
<5 1
_ u ( t = 0) = f
with
c ( q ) = ------9----9-----9------Г
1 + [ q 2 - q 02 ]/[ q 2 (1 + q 2 )]
where V is the gradient operator, div the divergence operator, || denotes the magnitude, c ( x ) the diffusion coefficient, and f the initial image. Where c ( x ) is
or
c ( q ) = e
- ( q 2 - q 0 )/[ q 0 (1 + q 0 )]
suggested to selected as:
c ( X ) =
1 + ( x / K ) 2
Where q is the instantaneous coefficient of variation determined by:
|
q=N |
(1/2)( V u / u ) 2 - (1/16)( V 2 u / u ) 2 |
|
[1 + (1/4)( V 2 u / u ) 2 ] |
and q 0 is the speckle scale function.
SRAD method is less dependence on the norm of the gradient and reduce the diffusion as the estimated standard deviation of noise decreasing. Unlike SRAD method using noise deviation as edge information, in this paper, we will take use of image texture information. Following (5), texture at pixel ( i , j ) of image u is defined as:
where
22 .2 _ °u w ( i , j ) - u W ( i , j ) c ° n ' R (i, j ) = „2
u W ( i , j ) c
V ui,j = ( u ij u yj )
|
u xj = |
ui + 1, j - ui _ 0, i = M |
j , i < M |
(9) |
|
ui,j + 1 - u i , 0, j = N |
, j < N |
(10) |
Where W(i, j) represents a window centered at (i, j) , 52 is the variance of u in window W(i, j) , and uW(i,j)
u W ( i , j ) c is the mean of u in window W ( i , j ) .
Approximately, we have uW(i,j)c « (G. * ukj)
and
And the discretization form of divergence operator is
given by
|
P^ j - pLu1 < i < M |
|
|
div ( P 1, P 2) i , j =' |
p 1, j , i = 1 (11) |
|
,- P i - 1, j , i = M |
5 u w ( i.j ) = u W ( i , j ) c ( uw ( i , j ) c )
+ X
« ( G . * u X j ) - ( G . * u ) 2, j )
Where G . is the Gauss kernel with variance . 2 . Thus, we consider following texture based anisotropic diffusion model:
pl j - p ,-„l < j < N p 2.j ,j = 1
,- Pl j - i , j = N
Then, the numerical algorithm for (8) is given in the following:
U n + 1 = Un. +T\div(cn.(unY .,cn.(unY ЛД i , j i , j i , j i , j , i , j i , j
<
d u = div [ C (| 5 R |) V u ] d t
Where
c 5 2 ) =
u ( t = 0) = f
In all the experiments. the time step size T is selected as T = 0.2. In addition. we take u 0 = f as the initial value. The stopping criterion is chosen as | u n + 1 - u n | L „ < 0.001 .
1 + ( G . * u 2 - ( G . * u )2 - 32 n G . * u )/( KG . * u )2
is the diffusion coefficient based on image texture information. 5 ^ is the speckle scale and can be estimated at each iteration using the method introduced in [11].
III. discretization
To discretize (8), the finite difference scheme in [16] is used. Denote the space step by h = 1 and the time step by T and denote by X the Euclidean space R N x N . If u E X , the gradient V u is a vector in Y = X x X given by
IV. Experiment Results
In this part, we will report experiment results of our method on both simulated images and real ultrasound images, and compare our experiment results with other well known PDE based methods, PM model and SRAD method..
The metrics used to experiment with simulated images have been the well-known MSE(mean-square error), SNR (signal-to-noise ratio), PSNR (peak signal-to-noise ratio). The MSE, SNR and PSNR metrics are defined in the following expressions:
MSE =
MN
NM
££ [ i ( i , j ) - 1 ( i , j )] 2
i = 1 j = 1
SNR = 10log 10
MMN I N^ M 1 1 2 ( i , j )
MSE
PSNR = 10log10
MSE
is much smoother after speckle reduction by using SRAD method and our method, with our method slightly smoother than SRAD method.
To evaluate the performance of edge preservation, a parameter β is proposed as[17]:
β = ∑ i N = 1 ∑ M j = 1[ Δ I ( i , j ) -Δ I ][ Δ I ˆ ( i , j ) -Δ I ˆ ] ∑ i N = 1 ∑ M j = 1[ Δ I ( i , j ) -Δ I ] 2 [ Δ I ˆ ( i , j ) -Δ I ˆ ] 2
In these expressions, I is the original image and I is the denoised image. M and N are row and column sizes respectively. The г operator A means applying a high pass filter to the image. To perform the filtering, the Laplacian operator is used in its 3 × 3 version. Δ is the mean value of the image after the operator is applied.
The MSE metric indicates how different the images being compared are. Therefore, the lower its value is, the closer the estimated image is to the original image and the better performance the algorithm. The SNR and PSNR metrics show a relationship between the real image and the estimation error. Therefore, a high value indicates an improvement. The is used to evaluate the preservation of the edges in the estimated image. The larger the , the better the effect of preservation of edges.
In the following, we will report our experiment results on both synthetic images and real ultrasound images.
In Figures 2-4, three synthetic images are corrupted by noise following the model (2) with δ n 2 = 3 . It is clear that the restoration results by the proposed model are visually better than that those by the SRAD model. For the evaluation, the MSEs, SNRs, PSNRs and β values of the noisy image and restored images are calculated. We can see from Table I that our method has higher SNRs, PSNRs, and β values, but lower MSEs, which indicates the better performance of our method comparing with SRAD method. Especially when dealing with texture images, our method performs much better(see Figure4).
In Figures 5-6, we test speckle reduction capability of our model on a real ultrasound abdomen image. Figure 5 shows the real ultrasound image and restored images by using SRAD method and our proposed method respectively. To show the performance of speckle reduction, we select three homogeneous regions along a line(column 393), which is marked by 1, 2 and 3 in the first image of Figure 5. Figure 6 shows the corresponding signal of this line before and after speckle reduction. The selected regions are marked in corresponding position. The selected regions are homogeneous regions, and the signal value in these regions should be fairly smooth, so, the sharp changes in these regions are the result of speckle noise. We can see from Figure 6, the first image contains a lot of sharp changes in region 1, 2 and 3. The signal in region 1, 2 ,3
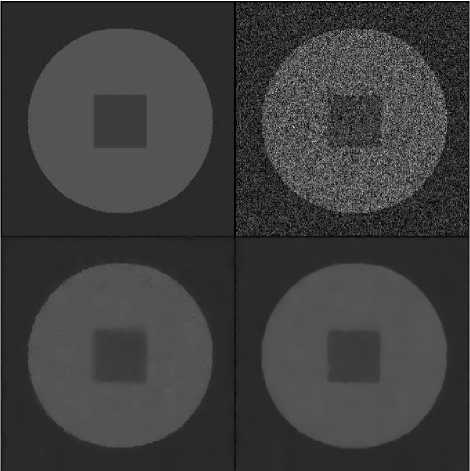
Figure 2. Speckle reduction on simulated images. Top left: original noise free image; Top Right: synthetic noisy image; Bottom left: restored image using SRAD method; Bottom left: restored image using our method.
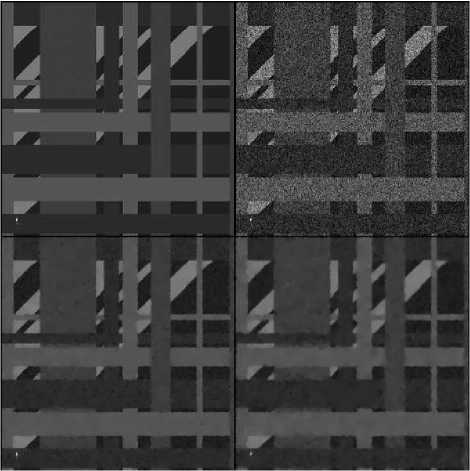
Figure 3. Speckle reduction on simulated images. Top left: original noise free image; Top Right: synthetic noisy image; Bottom left: restored image using SRAD method; Bottom left: restored image using our method.
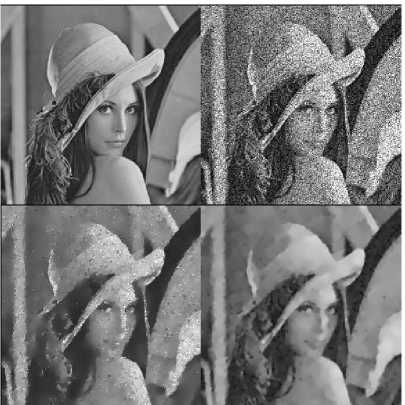
Figure 4. Speckle reduction on simulated images. Top left: original noise free image; Top Right: synthetic noisy image; Bottom left: restored image using SRAD method; Bottom left: restored image using our method.
TABLE I.
T he MSE s , SNR s , PSNR s and β V alues of the N oisy I mage and R estored I mages
|
Noisy image |
SRAD method |
Proposed method |
|
|
Figure2 |
MSE=244.7266 SNR=12.3203 PSNR=24.244 β =37.8339 |
MSE=12.7474 SNR= 25.4777 PSNR=37.0766 β =41.4065 |
MSE=10.7127 SNR=25.9081 PSNR=37.8318 β =41.4837 |
|
Figure3 |
MSE=535.6343 SNR=8.8652 PSNR=20.8421 β =36.4926 |
MSE=61.3649 SNR=18.4186 PSNR=30.2516 β =39.6240 |
MSE=60.8621 SNR=18.5104 PSNR=30.2873 β =40.2136 |
|
Figure4 |
MSE=1892.0 SNR=9.3 PSNR=15.4 β =34.9 |
MSE=191.6456 SNR=19.2830 PSNR=25.3058 β =38.4014 |
MSE=150.5402 SNR=20.3315 PSNR=26.3543 β =39.6275 |
itore h progress!
ЗЕИ35ЕЕ
Dist = 2.91cm
2.91cm
72dB S1A1/3/3
Cist = 2.91cm
72dB S1A1/3/3
Goin= -9dB д=2
72dB S1/f1/3/3
Goec -9dB д=2
100242 am
4CI-S «41
100242 am
4CI-S «41
100242 am
ICI-S #41
170mm
Abdomen NTH General
EEmE 170mm
Abdomen HTHI General
EEIE 170mm
Abdomen NTH General
Figure 5. Speckle reduction on a real ultrasound abdomen image. Top: a real ultrasound abdomen image; Middle: restored image using SRAD method; Bottom: restored image using our proposed method.
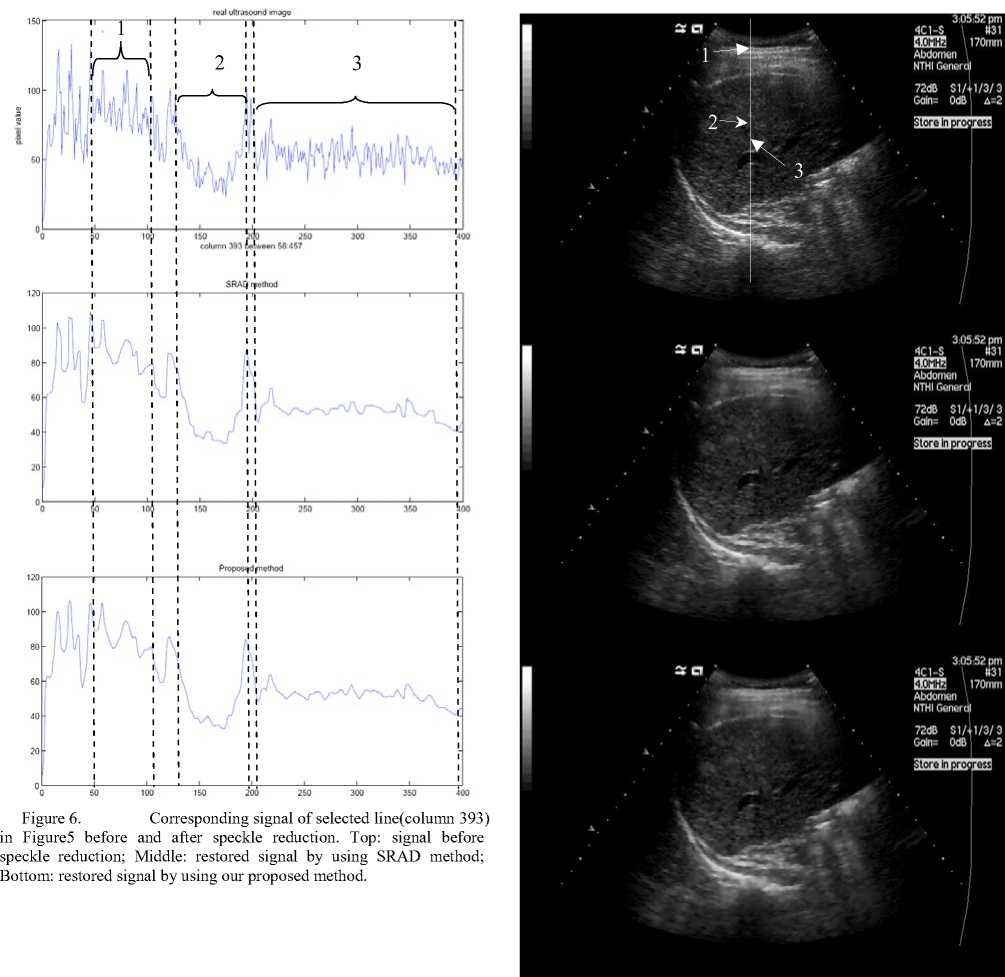
Figure 7. Speckle reduction on a another real ultrasound abdomen image. Top: a real ultrasound abdomen image; Middle: restored image using SRAD method; Bottom: restored image using our proposed method.
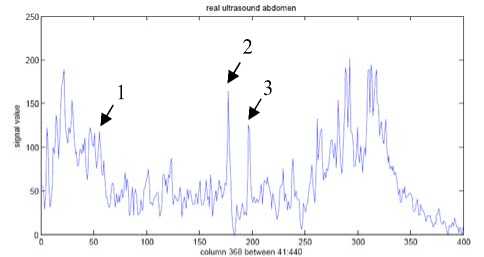
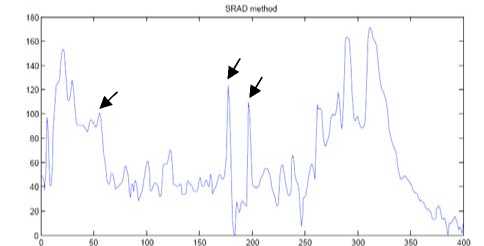
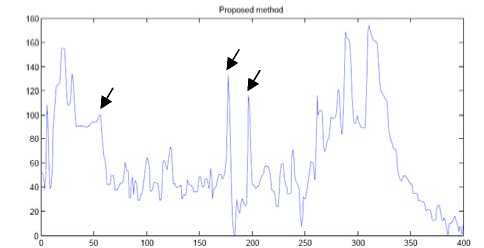
Figure 8. Corresponding signal of selected line(column 368) in Figure 7 before and after speckle reduction. Top: signal before speckle reduction; Middle: restored signal by using SRAD method; Bottom: restored signal by using our proposed method.
In Figures 7-8, we test edge preservation capability of our model in speckle reduction of a real ultrasound abdomen image. Figure 7 shows the real ultrasound image and restored images by using SRAD method and our proposed method respectively. We test the edge preservation capability by comparing the pixel value of 3 edge points, which are marked in the first image of Figure 7, before and after speckle reduction. Figure 8 shows the signal of selected line and corresponding edge points are pointed out in each signal by arrow. We can see that our method is effective and as well as SRAD method in edge preservation.
V. Conclusion
In this paper, we present a texture based anisotropic diffusion method for speckle reduction of real ultrasound image. The texture of ultrasound image is derived from a Log-compressed ultrasound image model. The performance of speckle reduction and edge preserving ability is evaluated by using MSE, SNR, PSNR and a β function, and is compared with SRAD method. We also test speckle reduction capability and edge preservation ability in real ultrasound images. The experiments show the superiority of our method in speckle reduction in Log-compressed ultrasound images.
Acknowledgment
The authors would like to thank PLA Nanjing General Hospital for providing ultrasound images. This work is supported by National Natural Science Foundation of China (No. 10926193) and Postgraduates Research Innovation Foundation of Jiangsu Province (No. CX10B-129Z).
References A PDE based Method for Speckle Reduction of Log-compressed Ultrasound Image
- M. Tur, K. C. Chin and J. W. Goodman, “When is speckle noise multiplicative? ,” Applied Optics, vol. 21, pp. 1157-1159, April 1982.
- J. S. Lee, “Speckle suppression and analysis for synthetic aperture radar,” Opt. Eng., vol. 25(5), pp. 636-643, 1986.
- D. T. Kuan, A. A. Sawchuk, T. C. Strand, and P. Chavel, “Adaptive restoration of images with speckle,” IEEE Trans. Acoust., Speech, Signal Process., vol. 35 pp. 373-383, 1987.
- V. S. Frost, J. A. Stiles, K. S. Shanmugan, and J. C. Holtzman, “A model for radar images and its application to adaptive digital filtering for multiplicative noise,” IEEE Trans. Pattern Anal. Machine Intell., vol. PAMI, no. 4, pp. 157-165, 1982.
- A. Lopes and R. Touzi, “Adaptive speckle filters and scene heterogeneit,” IEEE Trans. Geosci. Remote Sens., vol. 28, no. 6, pp. 992-1000, 1990.
- Tuncer C. Aysal and Kenneth E. Barner, “Rayleigh-Maximum-Likelihood filtering for speckle reduction of ultrasound images,” IEEE Trans. Med. Imag., vol. 26, no. 5, pp. 712-727, 2007.
- Xiaohui Hao, Shangkai Gao and Xiaorong Gao, “A novel mulmtiscale nonlinear thresholding method for ultrasonic speckle suppressing,” IEEE Trans. Med. Imag., vol. 18, no. 9, pp. 787-794, 1999.
- A. Pizurica, W. Philips, I. Lemahieu, and M. Acheroy, “A versatile wavelet domain noise filtration technique for medical imaging,” IEEE Trans. Med. Imag., vol. 22, no. 3, pp. 323-331, 2003.
- L.Rudin, P.L.Lions and S.Osher, “Multiplicative Denoising and Deblurring: Theory and Algorithms,” in: S.Osher, N.Paragios(Eds.), Geometric Level Sets in Imaging, Vision and Graphics, Springer, 2003, pp. 103-119.
- G. Aubert and J.F. Aujol, “A variational approach to removing multiplicative noise,” SIAM J. Appl. Math., vol. 68, pp. 925-946, 2008.
- Y. Yu and S. T. Acton, “Speckle reducing anisotropic diusion,” IEEE Trans. Image Process., vol. 11, no. 11, pp. 1260-1270, 2002.
- J. M. Thijssen, B. J. Oosterveld, R. F.Wagner, “Grey level transforms and lesion detectability in echographic images,” Utrason. Imag., vol. 10, pp. 171-195, 1988.
- Vinayak Dutt and J. F. Greenleaf, “Statistics of the log-compressed echo envelope,” J. Acoust. Soc. Am., vol. 99, no. 6, 38117-3825, 1996.
- T. Loupas, W. N. Mcdicken and P. L. Allan, “An adaptive weighted median filter for speckle suppression in medical ultrasonic images,” IEEE Trans. Circuit and Systems, vol. 36, no. 1, pp.129-135, Jan. 1989.
- P. Perona, J. Malik, “Scale space and edge detection using anisotropic diffusion,” IEEE Trans. Pattern Anal. Machine Intell., vol. 12, pp. 629-639, 1990.
- Antonin Chambolle, “An algorithm for total variation minimization and applications,” J. Math. Imag. Vis., vol. 20, pp. 89-97, 2004.
- F. Sattar, “Image enhancement based on a nonlinear multiscale method,” IEEE Trans. Image Processing, vol. 6, pp. 888-895, 1997.
