A Performance of the Scattered Averaging Technique based on the Dataset for the Cluster Center Initialization

Author: Arief Bramanto Wicaksono Putra, Achmad Fanany Onnilita Gaffar, Bedi Suprapty, Mulyanto
Journal: International Journal of Modern Education and Computer Science @ijmecs
Article in issue: 2 vol.13, 2021.
Free access
Clustering is one of the primary functions in data mining explorations and statistical data analysis which widely used in various fields. There are two types of the clustering algorithms which try to optimize certain objective function, i.e. the hierarchical and partitional clustering. This study focuses on the achievement of the best cluster results of the hard and soft clustering (K-Mean, FCM, and SOM clustering). The validation index called GOS (Global Optimum Solution) used to evaluate the cluster results. GOS index defined as a ratio of the distance variance within a cluster to the distance variance between clusters. The aim of this study is to produce the best GOS index through the use of the proposed method called the scattered averaging technique based on datasets for the cluster center initialization. The cluster results of each algorithm are also compared to determine the best GOS index between them. By using the annual rainfall data as the dataset, the results of this study showed that the proposed method significantly improved K-Mean clustering ability to achieve the global optimum solution with a performance ratio of 69.05% of the total performance of the three algorithms. The next best clustering algorithm is SOM clustering (24.65%) followed by FCM clustering (6.30%). In addition, the results of this study also showed that the three clustering algorithms achieve their best global optimum solution at the number of even clusters.
Global Optimum Solution, K-Mean, FCM, SOM, Scattered averaging technique
Short address: https://sciup.org/15017625
IDR: 15017625 | DOI: 10.5815/ijmecs.2021.02.05
Text of the scientific article A Performance of the Scattered Averaging Technique based on the Dataset for the Cluster Center Initialization
Clustering is one of the primary functions in data mining explorations and statistical data analysis which widely used in various fields. The purpose of clustering is to group datasets into groups or clusters based on the relationships between them. There are various algorithms for clustering, depend on the relationship of between the data in datasets and how the clusters are formed efficiently. The types of the relationship between data commonly are the distance of between data, connectivity between data, the density of the data space, the interval or the distribution of certain statistics, and the other definition of their relationships. From the standpoint of how to achieve efficient cluster formation, clustering regarded as a multi-purpose optimization problem.
There are two types of the clustering algorithms which try to optimize certain objective function, i.e. the hierarchical and partitional clustering. Hierarchical clustering builds clusters using dendrogram based on agglomerative or divisive approaches. This algorithm has been used to measure stock market liquidity in [1-3] . Partitional clustering algorithms attempt to partition the datasets directly into a given number of clusters where each cluster characterized by a cluster representative or vector prototype (a collection of the cluster center called centroid). The most common interdata relationship used in partitional clustering is the shortest distance. The most common optimization goal is until there is no change in cluster membership during the grouping process. The K-Mean Clustering is the most primitive, simple and effective method. The relationship of between its datasets and the center of its cluster is the shortest distance. This algorithm has been used to cluster the earthquake epicenter in [4] , to mining the attitude of social network users in [5] , and mapping of image and video in [6] . The uniform effects of this algorithm have studied in [7] . The Genetic Algorithm has also been used to optimize K-Mean for GPS data clustering in [8] .
K-Mean clustering is classified as hard clustering because each data pattern occupies only one cluster. The cluster membership stated by 1 and vice versa expressed by 0. Unlike the hard clustering, each data pattern of soft clustering has a certain degree of membership on each cluster expressed in the interval {0...1}. One type of this algorithm is Fuzzy C-Mean ( FCM ). The FCM has been used to perform the meta-analysis of cell-specific transcriptomic data discovers versatile viral responsive genes in [9] . This algorithm also used to segment an image in [10, 11] and classify the mental task in [12] . Combined FCM and PCA have been studied to modify the multiple generalized regression neural network in [13] . In-depth analyses of the convergence of between the K-Mean and FCM algorithms have studied in [14] .
the Cluster Center Initialization
Other clustering types are model-based clustering [15-18] , density-based clustering [19, 20] , and spatial clustering [21] . SOM (Self-Organizing Maps) is one of Artificial Neural Network architecture used for clustering that works with one type of machine learning that is unsupervised learning. SOM has been used for geospatial analysis of extreme weather events in [22] and reduce the complexity of terrestrial lidar data in [23] . The asymmetric SOM compare to the asymmetric K-Mean have studied in [24] . Several other studies have also been carried out related to the application of SOM clustering [25-28] .
The validation index measure how well the general goal of clustering which is consists of two parameters, namely the similarity within clusters and separability between clusters. The clustering results can be evaluated by using SC (Silhouette coefficient) [29-31] , PBM (Pakhira-Bandyopadhyay-Maulik) [32] , SSE (Sum of Squared Errors), and other techniques. SC allows for the evaluation of a given assignment for a particular observation. PBM measure the goodness of clustering on different partitions of a given dataset and describe a cluster validity index of a cluster solution. SSE is the most popular evaluation of distance which only needs to consider the cohesion of clusters to evaluate the cluster quality [33] . WB index is one of the clustering results evaluation based on SSW (sum of squares within a cluster) used to measure the similarity within a cluster and SSB SSW (sum of squares between clusters) used to measure the separability between clusters [34] .
Various optimization techniques related to clustering activities with different aims and objectives have also been studied as in [35-38] . Optimization of cluster center initialization is one approach that has been widely used to obtain a good validation index measurement of clustering activities. Several studies related to this have been carried out in [20, 39-42] .
This study focuses on the achievement of the best cluster results of the hard and soft clustering ( K-Mean, FCM , and SOM clustering). The validation index called GOS (Global Optimum Solution) used to evaluate the cluster results. GOS index defined as a ratio of the distance variance within a cluster to the distance variance between clusters. The aim of this study is to produce the best GOS index through the use of the proposed method called the scattered averaging technique based on datasets for the cluster center initialization. The cluster results of each algorithm are also compared to determine the best GOS index between them.
-
2. Materials and Methods
-
A. The scattered averaging technique
One of the simplest techniques to measure pattern the dataset to be grouped can be mapped into the N -dimensional Cartesian coordinates, where N is the number of data attributes. The clustering process performed on N -dimensional Cartesian coordinates that act as the data space. The scattered averaging technique is a proposed technique for cluster central initialization where the initial cluster center (called the initial centroid) placed scattered in the data space based on its dataset. This technique is expected to ensure the achievement of global optimum solutions regardless of how many iterations the process requires. Suppose there are 6 data has two attributes ( X and Y ) as follows:
|
X |
6 |
3 |
2 |
3 |
4 |
5 |
1 |
8 |
7 |
|
Y |
1 |
5 |
8 |
7 |
2 |
5 |
3 |
4 |
7 |
Firstly, the dataset is sorted ascending by all its attributes (by X , then by Y ) as follows:
|
X |
1 |
2 |
3 |
3 |
4 |
5 |
6 |
7 |
8 |
|
Y |
3 |
8 |
5 |
7 |
2 |
5 |
1 |
7 |
4 |
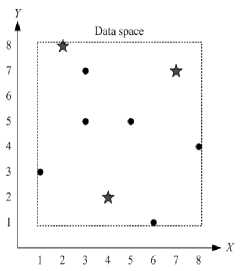
If the dataset will be grouped into two clusters, then the initial cluster center as follows:
|
X |
1 |
2 |
3 |
3 |
4 |
5 |
6 |
7 |
8 |
|
|
Y |
3 |
8 |
5 |
7 |
2 |
5 |
1 |
7 |
4 |
1st centroid 2nd centroid
If the dataset will be grouped into three clusters then the initial cluster center as follows:
|
X |
1 |
2 |
3 |
3 |
4 |
5 |
6 |
7 |
8 |
|
Y |
3 |
8 |
5 |
7 |
2 |
5 |
1 |
7 |
4 |
1st centroid 2nd centroid 3rd centroid
The illustrations are shown in Fig. 1.
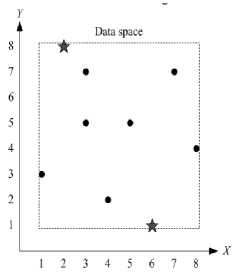
Fig. 1. Illustration of the cluster center initialization using the scattered averaging technique
If D is a dataset, M is the number of data, and k is the number of clusters desired then the cluster center initialization using the scattered averaging technique is expressed by:
kk = floor ( M / k )
c ( i ,: ) = D ( :, floor ( kk / 2 ) + ( i - 1 ) * kk )
where c ( i ,: ) is the i h cluster center initialization, and (:) is the index notation of the number of data attributes. This technique will be applied to the K-Mea n algorithm, FCM , and SOM clustering to know its performance through measurement of GOS index of cluster result of each algorithm.
-
B. The Global Optimum Solution (GOS)
A centroid is the cluster center. The best GOS achieved if the distance variance within a cluster as minimum as possible and the distance variance between clusters as maximum as possible. The GOS illustrated in Fig. 2. Suppose the data as follows:
X = [ x 1 x 2 ... x M 1
where M is the number of data. The measurement of data distribution to the average data is expressed by:
1 n
Var [ X ] = E [ ( X - M , ) 2 ] =- E ( X — M x ) 2 n , = 1
where Var [ X ] is the variance of X and mx is the average of X .
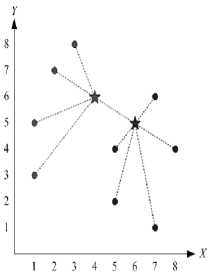
(a). Not a global optimum solution
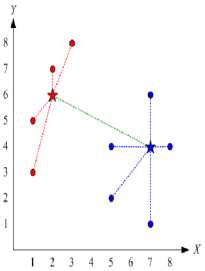
(b). A global optimum solution
Fig. 2. Illustration of the global optimum solution the Cluster Center Initialization
If Var ( member ) represents the average of the distance variance between the cluster members against its centroid and Var ( centroid ) represents the distance variance of between their centroids, then the global optimum solution is reached if it satisfies:
F = min ( Var ( member ) ) AND max ( Var ( centroid ) )
The GOS index is expressed by:
Var ( centroid )
GOS = ----------
Var ( member )
The formula shows that the smaller the Var ( member ) , the higher the similarity between cluster members in a cluster. Besides, the larger the Var ( centroid ) , the higher the separation between clusters. Finally, the higher the GOS index, the better the clustering results.
-
C. K-Mean clustering
K - Mean clustering is an iterative process that partitions a dataset into a number of K clusters. K - Mean clustering is classified as hard clustering because the cluster membership stated by 1 and vice versa expressed by 0. The initial cluster center (called centroid) used as the starting point of the partition based on the shortest distance between the cluster center against each data in the dataset. The iteration process is done continuously until no change of cluster membership in each cluster. The distance function used is Euclidean distance [43-46] . The K-Mean clustering algorithm is shown in Fig. 3.
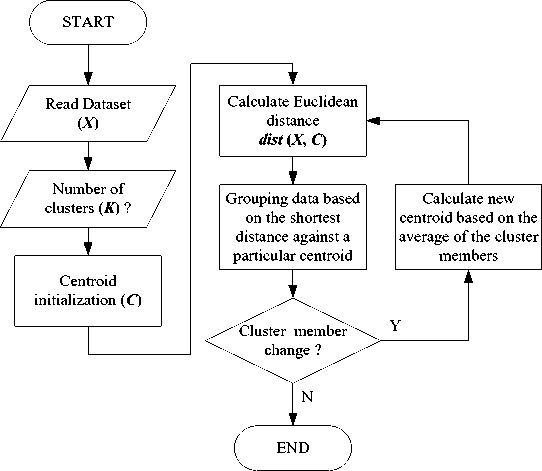
Fig. 3. The algorithm of K-Mean clustering
-
D. FCM clustering
In principle, Fuzzy C-Mean (FCM) is similar to K-Mean clustering. FCM clustering is classified as soft clustering because of the cluster membership of each data expressed by the degree of membership in the range {0 ... 1} [46] . FCM clustering output is the most optimized partition of the centroid.
If X = {x , x ,..., x } is the dataset, V = {v , v ,..., v } is the set of centroid, and U = {u ,u ,...,u } is the 12 M 12 K 11 12 KM degree of dataset membership in each centroid then the centroid partition optimization is obtained by minimizing the objective function expressed by:
the Cluster Center Initialization
MK
J ( U , V ) = ££ ( j q . ( d ji ) 2
j = 1 i = 1
where u is the degree of membership of x in ith cluster, and d is the Euclidean distance of between x and v expressed by:
( j 2 =|I х ; - vi|| (6)
The degree of membership of each data in each cluster is expressed by:
, 2X1/ ( q - 1 )
( 1/ ( d , ) )
K , 2J/ ( q - 1 )
Z(" (d,))
k = 1
where q is the fuzzification parameter (fuzzyfier, q >1). The generation of new centroids using the COA (Center of Area) formula expressed by:
M
E( uj) '.*, j=1
Vi = ---«----------
M
E(".)'
j = 1
The iteration process terminated if it satisfies:
I V - v| < 8
where 8 is the termination criteria within the range {0 ... 1}. The FCM clustering algorithm is shown in Fig. 4.
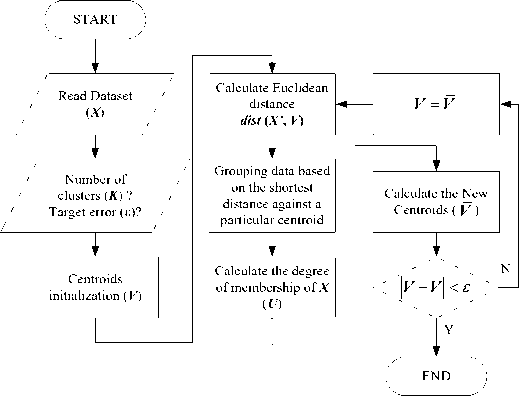
Fig. 4. The algorithm of FCM clustering
-
E. SOM clustering
SOM is one type of ANN architecture classified as unsupervised learning. SOM has a more complex geometric grouping capability because of the non-linear nature of its neuronal functions. The goal of SOM is to map the input data pattern to the N-dimensional grid of the neuron. The SOM architecture consists of an input layer, an output layer, and an intra-layer unit connecting the input and output layer. Each neuron of the input layer directly connected to each neuron of the output layer. The input layer has a neuron of M vector training. The output layer has a neuron of K clusters. The SOM architecture is shown in Fig. 5.
the Cluster Center Initialization
In principle, the intra-layer is a layer that represents the neighbouring distance function between the input layer weights with the output layer weights that map data from the input layer into the cluster membership in the output layer [45] . The neighbouring distance function is expressed by:
D = ndist ( P, IW ) = ||IW - p|f
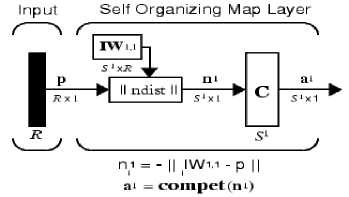
Fig. 5. The SOM architecture
P is the dataset, IW is a weighted intra-layer matrix as the centroid of each cluster, and D is the distance matrix. Winning neurons are the I wi output neuron weights that have the shortest distance P , expressed by:
C ( p ) = arg min || l w - p||2 i = 1... K (H)
If there is still a change in cluster membership, then the intra-layer weighted is updated using the following formula:
Iw j ( t + 1 ) = Iw j ( t ) - П ( P , - I w, ( t ) )
where n is learning rate within the range {0.1 ... 0.9}. In this case, the SOM clustering algorithm can achieve its best GOS index by setting the appropriate learning rate value. The SOM clustering algorithm is shown in Fig. 6.
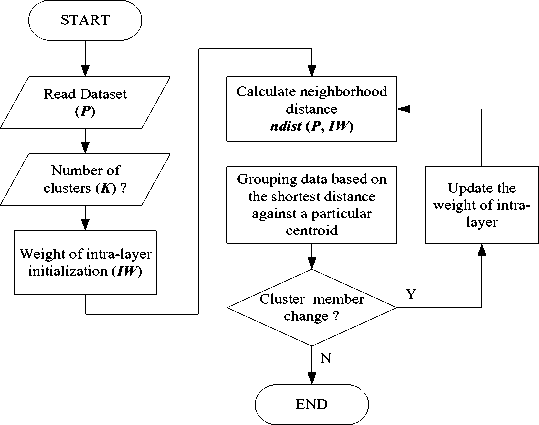
Fig. 6. The algorithm of SOM clustering
-
F. Dataset
This study uses annual rainfall data from the weather station of Samarinda city, East Kalimantan, Indonesia in period 2006-2016 ( BPS-Statistic of Samarinda Municipality, https://samarindakota.bps.go.id ). The dataset is shown in Table 1. The data to be clustered is the annual rainfall pattern in each month during the period. The data attributes used are min , max , and standard deviation expressed by:
X ( i ) = min ( X ( i ,2006:2016 ))
min
X ( i )^ = max ( X ( i ,2006 : 2016 ))
X ( i )
stdev

- X ( i ) ) / ( N - 1 )
where X ( i ) is the annual rainfall in the i t month, X ( i ) is the average of the annual rainfall in the ith month, and N is the number of year in period 2006-2016. Dataset by its attributes shown in Table 2.
Table 1. The Dataset of Annual Rainfall from The Weather Station of Samarinda City East Kalimantan Indonesia in the Period 2006-2016
|
Year |
Jan |
Feb Mar |
Apr |
May |
Jun |
Jul |
Aug |
Sep |
Oct |
Nov |
Dec |
|
|
2006 |
228 |
207 |
215 |
207 |
307 |
185 |
24 |
98 |
108 |
70 |
191 |
110 |
|
2007 |
307 |
220 |
260 |
340 |
112 |
213 |
279 |
133 |
183 |
181 |
85 |
141 |
|
2008 |
143 |
194 |
211 |
259 |
51 |
205 |
333 |
149 |
153 |
208 |
501 |
350 |
|
2009 |
164 |
196 |
279 |
309 |
186 |
41 |
157 |
123 |
99 |
232 |
165 |
211 |
|
2010 |
148 |
162 |
157 |
164 |
223 |
320 |
259 |
144 |
202 |
235 |
207 |
224 |
|
2011 |
332 |
320 |
368 |
332 |
389 |
95 |
238 |
124 |
132 |
218 |
197 |
244 |
|
2012 |
330 |
206 |
257 |
371 |
128 |
172 |
147 |
140 |
110 |
116 |
228 |
220 |
|
2013 |
176 |
309 |
284 |
337 |
234 |
161 |
145 |
90 |
256 |
223 |
363 |
276 |
|
2014 |
273 |
197 |
319 |
126 |
190 |
211 |
50 |
81 |
82 |
111 |
300 |
449 |
|
2015 |
345 |
193 |
198 |
344 |
214 |
259 |
163 |
58 |
0 |
73 |
61 |
191 |
|
2016 |
159 |
99 |
318 |
369 |
225 |
202 |
163 |
99 |
226 |
175 |
292 |
357 |
|
Table 2. The Dataset by Its Attributes |
||||||||||||
|
Attribute |
Jan |
Feb |
Mar |
Apr |
May |
Jun |
Jul |
Aug |
Sep |
Oct |
Nov |
Dec |
|
Min |
143 |
99 |
157 |
126 |
51 |
41 |
24 |
58 |
0 |
70 |
61 |
110 |
|
Max |
345 |
320 |
368 |
371 |
389 |
320 |
333 |
149 |
256 |
235 |
501 |
449 |
|
Stdev |
82 |
61 |
62 |
85 |
92 |
74 |
93 |
29 |
73 |
64 |
125 |
100 |
-
3. Result and Discussions
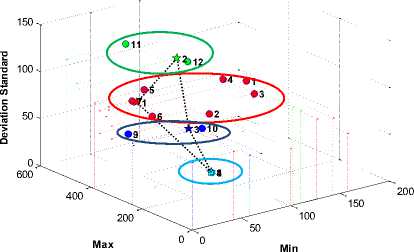
In this study, the dataset grouped into 3 and 4 clusters using K-Mean , FCM , and SOM clustering. By ignoring the number of iterative processes, the visualization of the optimum global solution of each algorithm is shown in Fig. 7, Fig. 8, and Fig. 9.
Table 3. The Results of the evaluation performance of All three clustering algorithms with cluster center initialization using the Scattered Averaging Technique
|
Algorithm |
Parameters |
Three clusters |
Four clusters |
Five clusters |
Six clusters |
Average value |
The performance ratio by total GOS Index (%) |
|
Var (centroid) |
660.8964 |
709.9072 |
998.8315 |
1191.7707 |
890.3515 |
||
|
K-Mean |
Var (member) |
187.5208 |
143.3436 |
641.4617 |
135.5959 |
276.9805 |
|
|
GOS index |
3.5244 |
4.9525 |
1.5571 |
8.7891 |
3.2145 |
69.05 |
|
|
Var (centroid) |
110.8552 |
211.1042 |
453.4930 |
429.1057 |
301.1395 |
||
|
FCM |
Var (member) |
1479.9727 |
997.9576 |
1056.1882 |
570.3514 |
1026.1175 |
|
|
GOS index |
0.0749 |
0.2115 |
0.4294 |
0.7524 |
0.2935 |
6.30 |
|
|
Var (centroid) |
1334.9529 |
1055.7393 |
755.8469 |
956.5152 |
1025.7636 |
||
|
SOM |
Var (member) |
2059.3491 |
669.6715 |
426.1999 |
419.5855 |
893.7015 |
|
|
GOS index |
0.6482 |
1.5765 |
1.7735 |
2.2797 |
1.1478 |
24.65 |
|
|
Total |
4.6557 |
Especially for SOM clustering, the global optimum solution is achieved by ^=0.8. The performance evaluation results from the three clustering algorithms with cluster center initialization using the scattered averaging technique the Cluster Center Initialization shown in Table 3. The dataset in this table has been grouped into 3, 4, 5, and 6 clusters. It was intended to review the results of clustering based on the number of odd and even clusters.
Table 3 has shown that cluster center initialization using the scattered averaging technique based on the dataset used has improved K-Mea n clustering ability to achieve the global optimum solution with a performance ratio of 69.05% of the total performance of the three algorithms. This result is evidenced by the average GOS Index of the K-Mean clustering (3.2145) is greater than the others ( FCM = 0.2935, SOM = 1.1478). The next best clustering algorithm is SOM clustering (24.65%) followed by FCM clustering (6.30%). In addition, Table 3 also shown that the three clustering algorithms achieve their best global optimum solution at the number of even clusters.

(a). three clusters by K-Mean
Fig. 7. The global optimum solution by K-Mean clustering algorithm
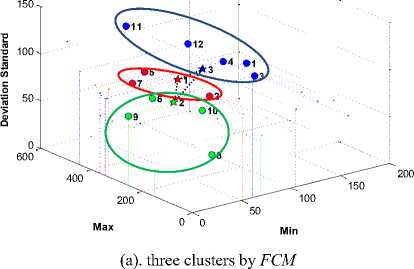
Fig. 8. The global optimum solution by FCM clustering algorithm
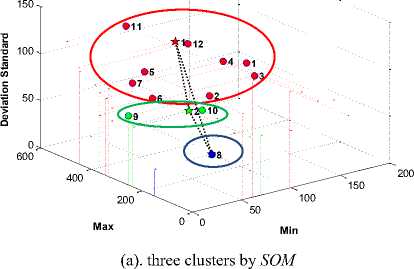
Fig. 9. The global optimum solution by SOM clustering algorithm
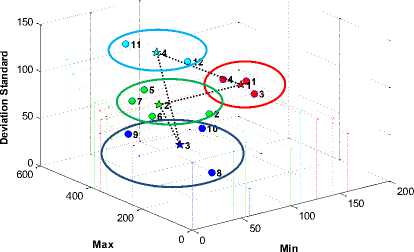
(b). four clusters by K-Mean
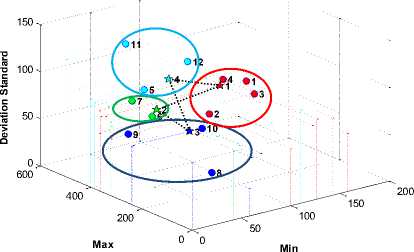
(b). four clusters by FCM
(b). four clusters by SOM
-
4. Conclusions
This study has implemented the scattered averaging technique for cluster center initialization based on its dataset applied to K-Mean , FCM , and SOM clustering algorithms. Their performance measured by using the GOS index. The results of this study had showed that this technique significantly improves the ability of K-Mean clustering in achieving global optimum solutions compared to SOM and FCM clustering algorithms. In addition, those clustering algorithms achieve their best global optimum solution on even-numbered clusters.
Future work is how to apply the scattered averaging technique based on the data space boundary in the N -dimensional Cartesian coordinates applied to K-Mean , FCM , and SOM clustering algorithms.
Acknowledgment
The authors would like to express their heartfelt thanks to The Modern Computing Research Center, Politeknik Negeri Samarinda, for providing all their support.
References A Performance of the Scattered Averaging Technique based on the Dataset for the Cluster Center Initialization
- A. Sharma, Y. López, and T. Tsunoda, "Divisive hierarchical maximum likelihood clustering," BMC Bioinformatics, vol. 18, 2017.
- A. Salighehdar, Y. Liu, D. Bozdog, and a. I. Florescu, "Cluster Analysis of Liquidity Measures in a Stock Market using High Frequency Data," Journal of Management Science and Business Intelligence, pp. 1-8, 2017.
- S. Kumar and D. Toshniwal, "Analysis of hourly road accident counts using hierarchical clustering and cophenetic correlation coefficient (CPCC)," Journal of Big Data, vol. 3, 2016.
- P. Novianti, D. Setyorini, and U. Rafflesia, "K-Means cluster analysis in earthquake epicenter clustering," International Journal of Advances in Intelligent Informatics, vol. 3, pp. 81-89, 2017.
- V. Gurusamy, S. Kannan, and J. R. Prabhu, "Mining the Attitude of Social Network Users using K-means Clustering," International Journal of Advanced Research in Computer Science and Software Engineering, vol. 7, pp. 226-230, 2017.
- M. Oskarsson, "Temporally Consistent Tone Mapping of Images and Video Using Optimal K-means Clustering," Journal of Mathematical Imaging and Vision, vol. 57, pp. 225-238, 2016.
- J. Wu, "The Uniform Effect of K-means Clustering," Springer Theses, pp. 17-35, 2012.
- X. Zhou, J. Gu, S. Shen, H. Ma, F. Miao, H. Zhang, and H. Gong, "An Automatic K-Means Clustering Algorithm of GPS Data Combining a Novel Niche Genetic Algorithm with Noise and Density," ISPRS International Journal of Geo-Information, vol. 6, p. 392, 2017.
- A. Khan, D. Katanic, and J. Thakar, "Meta-analysis of cell-specific transcriptomic data using fuzzy c-means clustering discovers versatile viral responsive genes," BMC Bioinformatics, vol. 18, 2017.
- H.-Y. Li, W.-J. Hwang, and C.-Y. Chang, "Efficient Fuzzy C-Means Architecture for Image Segmentation," Sensors, vol. 11, pp. 6697-6718, 2011.
- J. Yang, Y.-s. Ke, and M.-z. Wang, "An adaptive clustering segmentation algorithm based on FCM," Turkish Journal of Electrical Engineering & Computer Sciences, vol. 25, pp. 4533-4544, 2017.
- A. Gupta and D. Kumar, "Fuzzy clustering-based feature extraction method for mental task classification," Brain Informatics, vol. 4, pp. 135-145, 2016.
- C. S. Chin, X. Ji, W. L. Woo, T. J. Kwee, and W. Yang, "Modified multiple generalized regression neural network models using fuzzy C-means with principal component analysis for noise prediction of offshore platform," Neural Computing and Applications, 2017.
- A. Saha and S. Das, "Feature-weighted clustering with inner product induced norm based dissimilarity measures: an optimization perspective," Machine Learning, vol. 106, pp. 951-992, 2017.
- G. Malsiner-Walli, S. Frühwirth-Schnatter, and B. Grün, "Model-based clustering based on sparse finite Gaussian mixtures," Statistics and Computing, vol. 26, pp. 303-324, 2014.
- P. D. McNicholas, "Model-based clustering," Journal of Classification, vol. 33, pp. 331-373, 2016.
- S. Zhang, Z. Li, K. Beland, and G. Lu, "Model-based clustering with certainty estimation: implication for clade assignment of influenza viruses," BMC Bioinformatics, vol. 17, 2016.
- S. Akogul and M. Erisoglu, "An Approach for Determining the Number of Clusters in a Model-Based Cluster Analysis," Entropy, vol. 19, p. 452, 2017.
- F. Huang, Q. Zhu, J. Zhou, J. Tao, X. Zhou, D. Jin, X. Tan, and L. Wang, "Research on the Parallelization of the DBSCAN Clustering Algorithm for Spatial Data Mining Based on the Spark Platform," Remote Sensing, vol. 9, p. 1301, 2017.
- J. Huang, Q. Zhu, L. Yang, D. Cheng, and Q. Wu, "QCC: a novel clustering algorithm based on Quasi-Cluster Centers," Machine Learning, vol. 106, pp. 337-357, 2017.
- M. Bertamini, M. Zito, N. E. Scott-Samuel, and J. Hulleman, "Spatial clustering and its effect on perceived clustering, numerosity, and dispersion," Attention, Perception, & Psychophysics, vol. 78, pp. 1460-1471, 2016.
- A. Akande, A. C. Costa, J. Mateu, and R. Henriques, "Geospatial Analysis of Extreme Weather Events in Nigeria (1985–2015) Using Self-Organizing Maps," Advances in Meteorology, vol. 2017, pp. 1-11, 2017.
- C. Nguyen, M. Starek, P. Tissot, and J. Gibeaut, "Unsupervised Clustering Method for Complexity Reduction of Terrestrial Lidar Data in Marshes," Remote Sensing, vol. 10, p. 133, 2018.
- D. Olszewski, "Asymmetric K -Means Clustering of the Asymmetric Self-Organizing Map," Neural Processing Letters, vol. 43, pp. 231-253, 2015.
- U. F. Alias, N. B. Ahmad, and S. Hasan, "Mining of E-learning Behavior using SOM Clustering," 6th ICT International Student Project Conference (ICT-ISPC), 2017.
- S. Honghong and H. Lili, "A Binary Approximate Naive Bayesian Classification Algorithm Based on SOM Neural Network Clustering " 2017 International Conference on Computer Systems, Electronics and Control (ICCSEC), 2017.
- D. K. Roy and H. M. Pandey, "A New Clustering Method Using an Augmentation to the Self Organizing Maps," 8th International Conference on Cloud Computing, Data Science & Engineering (Confluence), Noida, India, 2018.
- L.-F. Zhang, C.-F. Li, H.-R. Wang, and M.-Y. Shi, "Research on Face Image Clustering based on Integrating SOM and Spectral Clustering Algorithm," Proceeding of the 2018 International Conference on Machine Learning and Cybernetics, Chengdu, China, 2018.
- U. Maulik and S. Bandyopadhyay, "Performance Evaluation of Some Clustering Algorithms and Validity Indices," IEEE TRANSACTIONS ON PATTERN ANALYSIS AND MACHINE INTELLIGENCE, vol. 24, pp. 1650-1654, 2002.
- O. Arbelaitz, I. Gurrutxaga, J. Muguerza, J. M. Pérez, and I. Perona, "An extensive comparative study of cluster validity indices," Pattern Recognition, vol. 46, pp. 243-256, 2013.
- S. Jauhiainen and T. Karkkainen, "A Simple Cluster Validation Index with Maximal Coverage," in European Symposium on Artificial Neural Networks (ESANN 2017), Computational Intelligence and Machine Learning, Bruges (Belgium), 2017, pp. 293-298.
- M. F. Zarandi, M. Faraj, and M. Karbasian, "An Exponential cluster validity index for Fuzzy Clustering with Crisp and Fuzzy Data," Transaction E: Industrial Engineering, vol. 17, pp. 95-110, 2010.
- J. Hämäläinen, S. Jauhiainen, and T. Kärkkäinen, "Comparison of Internal Clustering Validation Indices for Prototype-Based Clustering," Algorithms, vol. 10, p. 105, 2017.
- Q. Zhao and P. Fränti, "WB-index: A sum-of-squares based index for cluster validity," Data & Knowledge Engineering, vol. 92, pp. 77-89, 2014.
- R. Kama, K. Chinegaram, R. B. Tummala, and R. R. Ganta, "Segmentation of Soft Tissues and Tumors from Biomedical Images using Optimized K-Means Clustering via Level Set formulation," International Journal of Intelligent Systems and Applications(IJISA), vol. 11, pp. 18-28, 2019.
- D. A. A. Gnana Singh and E. J. Leavline, "Dimensionality Reduction for Classification and Clustering," International Journal of Intelligent Systems and Applications(IJISA), vol. 11, pp. 61-68, 2019.
- A. Khandare and A. S. Alvi, "Optimized Time Efficient Data Cluster Validity Measures," International Journal of Information Technology and Computer Science(IJITCS), vol. 10, pp. 46-54, 2018.
- A. Khandare and A. Alvi, "Efficient Clustering Algorithm with Enhanced Cohesive Quality Clusters," I.J. Intelligent Systems and Applications (IJISA), vol. 10, pp. 48-57, 2018.
- S. H. Jung, H. Lee, and J. H. Huh, "A Novel Model on Reinforce K-Means Using Location Division Model and Outlier of Initial Value for Lowering Data Cost," Entropy (Basel), vol. 22, Aug 17 2020.
- B. K. Mishra, A. K. Rath, S. K. Nanda, and R. R. Baidyanath, "Efficient Intelligent Framework for Selection of Initial Cluster Centers," International Journal of Intelligent Systems and Applications(IJISA), vol. 11, pp. 44-55, 2019.
- A. Kumar and S. Kumar, "Density Based Initialization Method for K-Means Clustering Algorithm," International Journal of Intelligent Systems and Applications(IJISA), vol. 9, pp. 40-48, 2017.
- R. T. Aldahdooh and W. Ashour, "DIMK-means “Distance-based Initialization Method for K-means Clustering Algorithm”," International Journal of Intelligent Systems and Applications(IJISA), vol. 5, pp. 41-51, 2013.
- A. F. O. Gaffar, Ibayasid, R. Malani, A. B. W. Putra, and A. Wajiansyah, "Optimization of the Spatial Interpolation Based on the Sliding Neighborhood Operation Method by using K-Mean Clustering for Predicting the Topographic Shape of the Ground Surface " International Journal of Advances in Soft Computing & Its Applications, vol. 11, 2019.
- M. E. Hiswati, A. F. O. Gaffar, Rihartanto, and Haviluddin, "Minimum wage prediction based on K-Mean clustering using neural based optimized Minkowski Distance Weighting," International Journal of Engineering & Technology (IJET), vol. 7, pp. 90-93, 2018.
- Mislan, Haviluddin, R. Alfred, and A. F. O. Gaffar, "A Performance Neighborhood Distance (ndist) Between K -Means and SOM Algorithms," Advanced Science Letters, vol. 24, pp. 1224-1229, 2018.
- Purnawansyah, Haviluddin, A. F. O. Gafar, and I. Tahyudin, "Comparison Between K-Means and Fuzzy C-Means Clustering in Network Traffic Activities," Cham, 2018, pp. 300-310.
