A Preliminary Model of Infrared Image Generation for Exhaust Plume

Author: Fei Mei, Shiguo Chen, Yong Jiang, Jing Cai
Journal: International Journal of Image, Graphics and Signal Processing(IJIGSP) @ijigsp
Article in issue: 4 vol.3, 2011.
Free access
Based on the irradiance calculation of all pixels on the focal plane array, a preliminary infrared imaging prediction model of exhaust plume that have considered the geometrical and the thermal resolution of the camera was developed to understanding the infrared characteristics of exhaust plume. In order to compute the irradiance incident on each pixel, the gas radiation transfer path in the plume for the instantaneous field of view corresponds to the pixel was solved by the simultaneous equation of a enclosure cylinder which covers the exhaust plume and the line of sight. Radiance of the transfer path was calculated by radiation transfer equation for nonscattering gas. The radiative properties of combustion needed in the equation was provided by employing Malkmus model with EM2C narrow band database(25cm-1). The pressure, species concentration along the path was determination by CFD analysis. The relative irradiance intensity of each pixel was converted to color in the display according to gray map coding and hot map coding. Infrared image of the exhaust plumes from a subsonic axisymmetric nozzle with different relative position of camera and the plume was predicted with the model. By changing the parameters, such as FOV and space resolution, the image of different imaging system can be predicted.
Exhaust plume, Infrared imaging, Radiative transfer equation, colormap
Short address: https://sciup.org/15012161
IDR: 15012161
Text of the scientific article A Preliminary Model of Infrared Image Generation for Exhaust Plume
Published Online June 2011 in MECS
-
A. Background and Motivation
Infrared (IR) guided missiles have been one of the most deadly threats to aircraft, they have been responsible for most of the military and civilian aircraft downed in the last several decades [1]. From Vietnam through Desert Storm, they leaded to more aircraft shutdowns than any other anti-aircraft weapons. They have truly fire and forget capability as they acquire and intercept aircraft by passively detecting IR-radiation (heat signatures) from them[2].
Since its advent in the early 1950’s, The IR guided missile has advanced from un-cooled reticle seeker to multi-color array imaging seeker. The early heat seeking missile usually used un-cooled Lead Sulphide (PbS) detectors, have a peak sensitivity at < 3µm, operating in the near-IR 2-2.7µm atmospheric window waveband, which tends to limit such missiles to rear engagements as the detector can only discern the hot metal parts of the engine and the hotter water emission in the plume. Whereas, the next generation cooled detectors have higher sensitivity and can detect warm skin of an aircraft or the hot exhaust gas plume. These cooled detectors, used materials such as Indium Antimonide (InSb) for detection in the mid-IR 3-5µm atmospheric window. As they working at longer wavelengths , the cooler parts of the engine, hot parts of the airframe, and the cooler CO2 emissions in the exhaust plume can be detected, thus allowing wider angles of engagement.
The latest missiles usually equipped with imaging seekers working in the mid-IR or the far-IR wave band. The major advantages of this type of system are increased lock-on range and robustness to countermeasures.
As the infrared imaging missiles has been the escalating threat to the aircraft, Thus understanding the knowledge of accurate characteristic of target’s IR image is necessary both in evaluating the threat against civilian aircraft and designing aircraft less susceptible to heat seeking missiles. It is also helpful for designing more lethal seekers.
-
B. The Aircraft Sources of Radiation
The typical radiation sources of jet aircraft are the hot metal tail-pipe, metallic fuselage and the exhaust gas plume [3].The total radiance of an object can have contributions due to emission, transmission and reflection (scattering).
Fuselage and tailpipe, are generally solid metal and opaque in nature and usually considered as gray body. We may assume that the “opaque objects” emit thermal radiations and reflect what they receive from the environment. But the transmission part may be neglected. Their infrared image or signature can be evaluated by computation of the effective intensity of the projected meshed facets in the instaneous field of view (IFOV) of the IR camera. The effective intensity of a facet is the sum of self-emitted intensity, the specular reflected intensity of other facets, earth, or sky, and the diffuse reflected intensity of the earth or sky. The self-emitted intensity is determined by Plank Law with their skin’s emissivity and temperature. For a complex geometry, the difficulty to get the effective intensity for them are modeling the reflective relation accurately between different facets of the skin, obscuration calculation to determine which facets can be seen in the FOV of the IR camera.
On the other hand, the exhaust plume which created by the engine combustion processes and released into the atmosphere is non-opaque in nature. Thus the exhaust gas plume may be assumed to emit thermal radiations and transmit the energy through a non-opaque volume. But the third element of reflection (or scattering) may be neglected. The exhaust plume is a gas mixture of H 2 O, CO 2 , CO and O 2 . The IR radiation from the plume is emitted by the vibrational energy of the gaseous species, and thermal energy of solid and liquid species, its emissivity changes sharply with wavelength. The gas thickness, temperature field and gas composition along given path all affected the total radiation.
-
C. Previous Work of Plume Radaition Calculation
Decher [4] and Chu et al. [5] developed a simple descriptive model for plume IR radiation estimation i. Heragu et al. [6] and Heragu and Rao [7] gave a comprehensive scheme for the prediction of radiation from an engine exhaust plume, based on the combination of radiation from the surface and the gaseous plume. The Standardized Infrared Radiation Model (SIRRM) code developed under JANNAF (Joint Army Navy NASA Air Force) project, predicts IR radiation from missile and aircraft plumes [8]. The code also predicts the effect of carbon particles on IR emission characteristics of plume. Bakker et al.[9] gave a brief methodology for computing plume IR signatures from naval ship gas turbine engines, using NATO’s NPLUME program for exhaust field computations. Hypothetical band models for plume IR radiation modeling are classified into narrow-band and wide-band models. Wide-band models are used for obtaining total quantities, while narrow-band models are used for spectral information [6]. Ibgui and Hartmann [10] and Ibgui et al. [11] developed an optimized line-by-line FORTRAN code for the calculation of aircraft plume IR signature. The results obtained by the model were in good agreement with the measured laboratory simulation results.
The exhaust gas plume of an aircraft is usually the dominant source of thermal radiations in the 3 to 5 micron band. The plume length is several times more than the aircraft length; therefore, plume radiation is visible from a much wider view angle. With the intent to develop the stealth aircraft design and evaluation technology, this paper reviewed the imaging mechanism of infrared camera and the method of gas radiation computation. Some efforts were done on developing a preliminary methodology for infrared imaging generation of exhaust plume.
II. Analysis of Infrared Imaging
-
A. Description of Infrared Imaging System
There are three basic types of method to get a twodimensional image, raster scan, parallel scan, and staring.
In a raster scan, two mirrors are mechanically steer the field of view of a single detector in both the vertical and horizontal directions. A parallel scan needs only one mirror to mechanically scan the scene in a single horizontal sweep using a row of detectors. Staring system are the most efficient and expedient method which characterized by a two dimensional array of detectors and are scanned electronically.
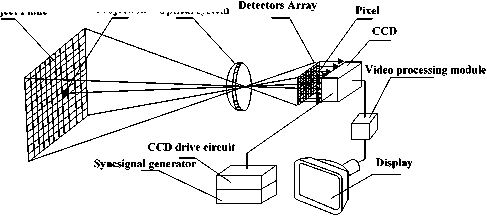
Object Plane Projection Optical system
-
Figure 1. Schematic Illustration of IR Imaging System
The matrixes of detectors, called pixels, are located at the focal plane of the camera (see fig 1).Detector size ranges from approximately 20×20μm to 60×60μm. Common sizes of detector array are 128×128, 256×256,320×240 and 640×512 pixels. Each of the detectors has an instantaneous FOV (IFOV) and receives radiation from their own IFOV. The radiation was converted to electrical signal by the detector, and an amplifier was used to boost the signal. The output of the amplifier is digitized in an analog-to-digital converter (ADC) and then quantized into digital counts. The digital count is determined by the amount of irradiance on the detector and was used to control one pixel’s color at the display according to a color map. Size of infrared image at the display is the same as the size of detectors array. This is also called detector spatial resolution.
-
B. Basic Relationship
The pixel of the focal plane array (FPA) has a size of a x b , focus of the optical system is f , distance between the target and the lens is R , the projection area of the IFOV at the object plane is a x b (fig2).
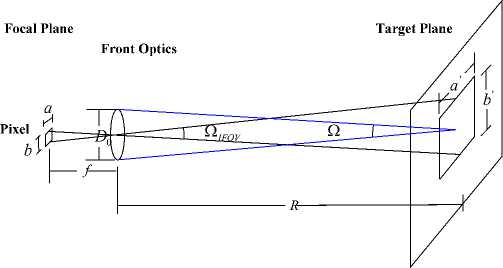
Figure 2. Geometry Relationship between Target and Pixel It is obviously that:
О IFOV
a x b f 2
a ' x b '
R 2
The radiant flux received by one pixel is
Ф = LA Qt 0 t ( R ) (2)
L represents the radiance of the pixel’s projected area in the target plane. A is the projected area. Q is the solid angle of front optics which is determined by the distance R and the front optics’ diameter D 0 .
species concentrations needed by the gas radiation calculation.
For simplified, a commercial software FLUENT was employed to do this work. An implicit, coupled solver with standard k-ε turbulance model has been used to model the plume emanating from the nozzle.
A cylinder was built to enclosure the exhaust plume, the cylinder was exactly the computation zone for computation fluid dynamics (CFD) analysis.
Q =
B. Gas Radiation Transfer Path in the IFOV
4 f 2
T 0 or t ( R ) is the transmittance of optic system or atmospheric is respectively.
Thus, the irradiance incident on the pixel is
E Ф L n D2^ R )
ab 4 f 2
From equation (3) it is obvious that irradiance incident on the pixel is directly proportional to the radiance L of plume in its IFOV, as the other parameters are camera specific constants.
III Methodology
In order to predict the infrared image for a specific camera, it is important to calculate the irradiance of all the pixels. According to equation (3), this problem is equal to calculating the radiance in the IFOV for all the pixels. The related prediction work to the exhaust plume was summarized and done as the following process:
Gas radiation transfer path referred to the path in the infrared active gas volume. The cylinder that enclosure the exhaust plume and used in CFD Analysis was considered as the infrared source. In order to calculate the radiance in the pixel’s IFOV, the gas radiation transfer path for each pixel should be found.
To find the path, the concept “line of sight” was employed. It was a line that connects the center of optical system and center of the pixel.
Suppose that an IR camera is at 90° aspect angle (The position are most commonly be adopted to measure the infrared signature of exhaust plume), as demonstrated in fig.4, the gas radiation transfer path is between A and B. These two points are the intersection points of the cylinder boundary and the line of sight. Thus, the path was determined by the position, diameter of the cylinder enclosure, optical focus and the pixel position at the FPA.
Method to calculate the coordinates of A and B is discussed below.
Presupposition: FOV of the infrared camera is ax в ,
size of detector array is m x n , the detector is at the focal
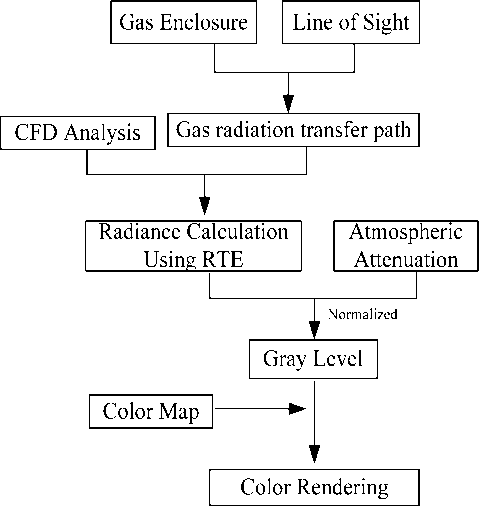
Figure 3. IR Imaging Simulation Process for Subsonic Exhaust Plume
plane, so the center of detectors array was at coordinate
( 0,0, f )
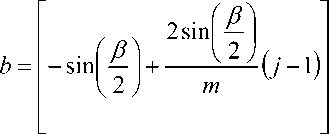
Coordinate of the ( i x j ) h pixel’s center is
' x 0 ( m , n ) = a • s * y 0 ( m , n ) = b • s z 0 ( m , n ) = c • s
The coefficient’s expression is listed below


m
( i - 1 )
c
= 41 2 - a 2 - b2
A. CFD Analysis
The fluid computation should be done before any other works. It provides data of the temperature, pressure and
Line of sight from this pixel center
x = У = z x 0 (m, n) y 0 (m, n ) z 0 (m, n )
From equation (4) and equation (5), equation (5) can be written in this form x = a • t
< y = b • t (6)
z = c • t tis a formalize parameter.
Mathematic equation of the cylinder enclosure is x2 +(z + L )2 = r2 (7)
Put equation (6) in (7), we get
( a 2 + c 2 )f2 + 2 ct + L 2 - r 2 = r 2
If the Cylinder can filled the FOV of the camera, this equation definitely have two real roots t 1,2 .Put the roots in equation (6), we get ( xA, yA, zA ) and ( xB, yB, zB ) .
Cylinder Enclosure for Exhaust plume Optical System
FASCODE. These were developed by Air Force Geophysics Laboratory, USA. There are also some other models such as 4A/OP[13] initially developed at LMD (Laboratoire de Météorologie Dynamique).
LOWTRAN 7 is a low-resolution propagation computer code for predicting atmospheric transmittance and background radiance from 0 to 50,000 cm-1 at a resolution of 20cm-1 which has been validated against field measurements. It is suitable for low altitudes(less than 40 km) and at moderate temperatures. The code is based on the LOWTRAN 6 [14] model. Multiple scattered radiation has been added to the model as well as new molecular band model parameters.
The LOWTRAN-7 code has been used in present analysis for computing atmospheric transmissivity.
E. Color Mapping
The dynamic response range for an infrared camera is 0 to 0 , The irradiance put on the detector’s FPA min Emax varies from E to , and min max
E °- < E < E < E 0
min min max max
The irradiance E was normalized by
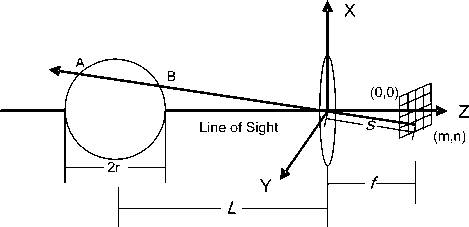
Figure 4. Gas Radiation Transfer Path for one Pixel
I = Round-
E - E™.„ , , )
-----min— x color number*
\E -E .
V max min
^^^^^^™
color number is the levels of colors for the ^^■i^^*
color map, we assigned it 256 here.
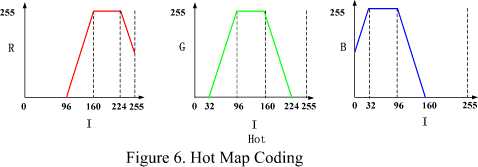
Two color maps were employed to render the pixels. The coding from I to RGB are showed in fig5 and fig6 respectively.
1) Gray
Gray returns a linear grayscale colormap (Fig5).
C. Radiance Calculation along the Path
The path was divided into a number of isothermal columns. The solution adopted to compute the radiative transfer through the plume is based on the band model depending on the temperature along the line of sight(LOS). Curtis-Godson approximation is used for the mean transmissivity through inhomogeneous gases. Pressure, temperature and the concentration of gases (water vapor, carbon dioxide, and carbon monoxide) which emit most strongly in the infrared band along the path were provided by CFD analysis.
The details to compute radiance along the given path has been discussed in section IV.
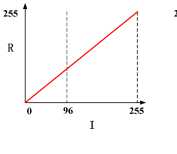
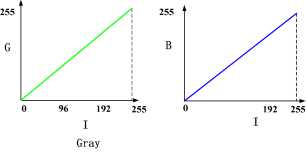
Fig. 5 Gray Map Coding
2) Hot
Hot varies smoothly from black through shades of red, orange, and yellow, to white (Fig6).
D. Atmospheric Attenuation
Radiant flux from the exhaust plume is selectively absorbed by several atmospheric gases and scattered away by small particles suspended in atmosphere (aerosols). The absorption and scattering are usually considered as the topic of extinction which causes attenuation in the amount of radiant flux passing through the atmosphere. The transmission of the atmosphere present in between the scene and the sensor is calculated by various numerical models that on the basis of the absorption, scattering and refractive-index fluctuations or turbulence, such as LOWTRAN [12], MODTRAN and
IV. Gas Radiance Calculation
When the target was metal, the radiance in the IFOV can be calculated by Planck’s law with the emissivity. Unfortunately, that’s not true for gas. Because radiation emitted by gas is at discrete frequency, a characteristic of the vibrational mode. The number, width, and emissive
powers of the various bands, depend on the gas composition, pressure, temperature, and thickness of gas volume. The variation of the spectral radiation intensity along a path is described by the RTE, which is an integral-differential equation that describes the spectral radiation intensity along a path in a fixed direction through an absorbing, emitting, scattering medium.
A. Equation of Radiation Transfer for Nonscattering Gas
In the RTE, the attenuation of intensity due to the absorption and scattering, and the augmentation of intensity resulted from the emission and scattering to the path are included.
Since it has few scattering media, the RTE in nonscattering media was exactly right for aircraft exhaust plume. When the distributions of pressure, temperature, and species concentration are given explicitly as functions of the path distance u, the equation of transfer reads
L u ( u,и ) = [ Lu u (u,u'Y ^r t ( u , u ,udu (9)
J 0 d u
For a given path which was divided into a number of isothermal columns, the equation is usually transformed into a numerical summation form m=N
L u = - E L u ( T m )L m - t . , -, ) (10)
m = 1
Where the transmittance is um
Tu , m = exP I— J 0 Ku du )
C 1 u3
Lb u ec2 ^ T - 1
C 1 = 2 hc 2 = 1.191 X 10 - 12
C 2 = hc / k = 1.43879
B. Band Model
Gas
N N-l
Observer
2 1

Figure 7. Sketch Map of Discrete Path

To obtain the radiance for a waveband, the spectral radiance should be integrated across frequency,
u
L = J
J u 1
L u d u
As absorption coefficient k u is usually a very rapidly
varying function of wavenumber u , a precise determination of L requires evaluation of (11) at a very large number of frequencies. Such detailed calculations may be impractical or undesirable. The gas absorption coefficient varies much more rapidly across the spectrum than other quantities, such as blackbody intensity, etc. It is, therefore, in principle possible to replace the actual absorption coefficient (and intensity) by smoothened values appropriately averaged over a narrow spectral
range.
Lb u
m = n
E L b u ( T m Д Т » , m
m = 1
T 1
u , m -1
Tu m is a smoothened transmittance over a narrow spectral range defined by the band model. Lb u referred to blackbody radiance
W / cm 2 • sr • cm 1
W / cm 2
cm • K
Band models are hypothetical models of simplified mathematical structure which are introduced to provide fair representations of the properties of real spectra at reasonable computing cost [15]. In general, a model consists of a set of lines in a spectral interval with specified properties regarding the intensities, shape, number, and distribution of the lines. Band model consists of Wide Band Model (WBD) and Narrow Band Model (NBD).NBD average the absorption coefficient over a smaller spectral interval, with higher accuracy than WBD.
A number of such "narrow band models" have been
developed some 40-50 years ago. They were divided into regular band model (Elsasser Model) and statistical band model according to their own assumptive spectral lines distribution.
We can find several statistical band models which all
assume that the positions of the individual spectral lines occur at random and that all lines have identical shape, differing only in strength. Such as Lines of equal strength, exponential line strength distribution (Goody Model), exponential tailed line strength distribution (Malkmus Model)[16]. The radiative properties of combustion were computed by Malkmus model which having a good agreement with Line by Line method with EM2C narrow band database(25cm-1) [17] here.
т = exp
- 2 Y /1 + xplk— - 1 d U Y
For Inhomogeneous gas columns , the Curtis-Godson
approximation is convenient.
k eq = E xiP liki! E XP1
eq
ч I Y I / E x i P l i k i
I d i )
V. Result and Conclusion
The infrared imaging simulation was conducted for the exhaust plumes of a subsonic axisymmetric nozzle. The diameter of the nozzle exit is 20 cm. The primary boundary parameters for CFD analysis are listed in table I.
TABLE I
BOUNDARY PARAMETERS FOR CFD
|
Nozzle exit |
environment |
|
|
Total pressure(pa) |
104510 |
96700 |
|
Static pressure(pa) |
96700 |
96700 |
|
Total temperature(K) |
590 |
296 |
|
Mole fraction of CO 2 |
0.1 |
3.79 X 10 -4 |
|
Mole fraction of H 2 O |
0.1 |
0.005 |
The total FOV of the infrared camera was supposed 22×15°, image size is 320×240. The spectral interval for
simulation is 2000-5000cm-1. The model can predict the infrared image of different imaging system by changing the parameters, such as FOV and space resolution.
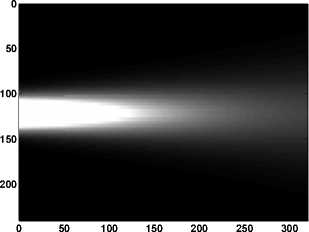
The camera is placed at 90°aspect angle, 500 cm away from the plume centerline and 220 cm away from the exit. The predicted infrared image is
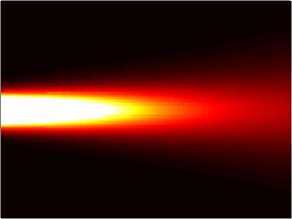
0 50 100 150 200 250 300
a) Hot
-
b) Gray
Figure 8. IR Image for 500cm Away
Change the relatively position of the camera and plume, the image can be predicted properly well too. Fig 4 showed the predicted infrared image when the camera is placed at 90°aspect angle, 400 cm away from the plume centerline and 200 cm away from the exit.
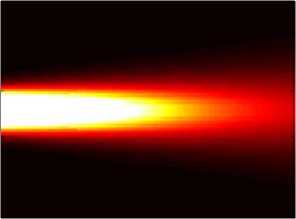
0 50 100 150 200 250 300
a) hot
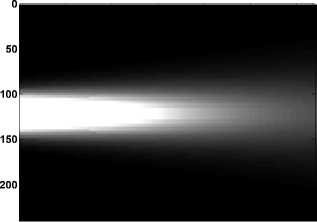
0 50 100 150 200 250 300
b) gray
Fig. 9 IR Image for 400cm Away
The predicted image was showed reasonable, but the work of the author is also a preliminary study. This model can produce an ideal image which was predicted by the consideration of the geometrical and the thermal resolution of the camera. It needs some other work such as the consideration of the interior effect of camera. The experiment to validation which is planned to be done with an auxiliary power unit of a commercial airplane soon is also needed.
Acknowledgment
The authors are grateful to graduate student Bing Wen, Air Force Engineering University, for the systematic discussion of the computation fluid dynamic knowledge. The authors also thank XuDong, Li of Xi’an Institute of Applied Optics for his many beneficial suggestions of the infrared imaging.
This work was supported in part by a grant from China Aeronautics Science Grant.
References A Preliminary Model of Infrared Image Generation for Exhaust Plume
- Hughes D. and Wall R, “Missile Attack on DHL Jet Keeps Self-Defense Issue Bubbling,” Aviation Week & Space Technology November 2003.
- Understanding the infrared threat, Journal of Electronic Defense, vol.22 no.2, February 1999.
- S.P. Mahulikar, G.A. Rao, H.R. Sonawane, etc, “ Infrared signature studies of airborne target,” Poceedings of the International Conference on Aerospace Science and Technology, India, 2008.
- Decher R. Infrared emissions from turbofans with high aspect ratio nozzles. J Aircraft 1981;18(12):1025–31.
- Chu CW, Der J, Wun W. Simple two-dimensional nozzle plume model for infrared analysis. J.Aircraft 1981; 18(12): 1038–1043.
- Heragu SS, Rao KVL, Raghunandan BN. Generalized model for infrared perception from an engine exhaust. J. Thermophys Heat Transfer 2002;16(1):68–76.
- Heragu SS, Rao KVL. Prediction of radiative transfer from potential core of a hot jet. J Thermophys Heat Transfer 1994;8(2):368–70.
- Nelson HF, Tucker EO. Infrared emission from the engine exhaust plumes. AIAA paper no. AIAA-1986-465. Reston, VA, USA: AIAA Inc.; 1986. p. 8.
- Bakker E.J, Fair M.L., Schleijpen H.M.A. Modelling multi spectral imagery data with NIRATAMv3.1 and NPLUME v1.6. In: Proceedings of SPIE—The International Society for Optical Engineering, Targets and backgrounds: char-acterization and representation—V, vol. 3699. Bellingham, WA, USA: SPIE; 1999. p. 80–91.
- Ibgui L, Hartmann JM. An optimized line by line code for plume signature calculations—I: model and data. J Quant Spectrosc Radiat Transfer 2002;75(3):273–95.
- Ibgui L, Valentin A,MerienneMF, Jenouvrier A, Lux JP, Le Doucen R, et al. An optimized line-by-line code for plume signature calculations, II:comparisons with mea-surements. J Quant Spectrosc Radiat Transfer 2002; 74(4): 401–15.
- Kneizys, F.X., Shettle, E.P.etc, “Lowtran 7 computer code: user's Manual,”AFGL-TR-88-0177, Hanscom AFB, MA 1988.
- L. Chaumat, C. Standfuss, B. Tournier, R. Armante and N. A. Scott, “4A/OP Reference Documentation,” NOV-3049-NT-1178-v4.0, NOVELTIS, LMD/CNRS, CNES. 2009.
- Kneizys, F.X., Shettle, E.P.etc, “Atmospheric Trans-mittance /Radiance: Computer Code LOWTRAN 6,” Air Force Geophysics Laboratory, Report AFGL-TR-83-0187, Hanscom AFB, MA. 1983.
- C.B. Ludwing, W. Malkmus, J.E. Reardon, J.A.L. Thomson, “Handbook of Infrared Radiation from Combustion,” NASA-SP-3080, 1973.
- Malkmus, W., “Random band Lorentz with exponential tailed S-1 line-intensity distribution function,” Journal of the Optical Society of America. vol.57, no.3, pp. 323-329 , 1967 .
- Saufiani, A. and Taine, J, “High temperature gas radiative property parameters of statistical narrow-band model for H2O, CO2 and CO, and correlated-K model for H2O and CO2,” Int. J. of Heat Mass Transfer, vol. 40, no.4, pp. 987-991,1997
