A Review of Computer Aided Detection of Anatomical Structures and Lesions of DR from Color Retina Images

Author: Sreejini K S, V. K Govindan
Journal: International Journal of Image, Graphics and Signal Processing(IJIGSP) @ijigsp
Article in issue: 11 vol.7, 2015.
Free access
Ophthalmology is the study of structures, functions, treatment and disorders of eye. Computer aided analysis of retina images is still an open research area. Numerous efforts have been made to automate the analysis of retina images. This paper presents a review of various existing research in detection of anatomical structures in retina and lesions for the diagnosis of diabetic retinopathy (DR). The research in detection of anatomical structures is further divided into subcategories, namely, vessel segmentation and vessel centerline extraction, optic disc segmentation and localization, and fovea/ macula detection and extraction. Various research works in each of the categories are reviewed highlighting the techniques employed and comparing the performance figures obtained. The issues/ lacuna of various approaches are brought out. The following major observations are made: Most of the vessel detection algorithms fail to extract small thin vessels having low contrast. It is difficult to detect vessels at regions where close vessels are merged, at regions of missing of small vessels, at optic disc regions, and at regions of pathology. Machine learning based approaches for blood vessel tracing requires long processing time. It is difficult to detect optic disc radius or boundary with simple blood vessel tracing. Automatic detection of fovea and macular region extraction becomes complicated due to non-uniform illuminations while imaging and diseases of the eyes. Techniques requiring prior knowledge leads to complexity. Most lesion detection algorithms underperform due to wide variations in the color of fundus images arising out of variations in the degree of pigmentation and presence of choroid.
Diabetic retinopathy, retina fundus image, optic disc, macula, fovea, blood vessels, exudates, microaneurysms, hemorrhages, segmentation, survey
Short address: https://sciup.org/15013927
IDR: 15013927
Text of the scientific article A Review of Computer Aided Detection of Anatomical Structures and Lesions of DR from Color Retina Images
Published Online October 2015 in MECS
Abnormalities in retina are the indicators of various diseases in human body and research in this field became popular due to the increase of prevalence of diabetic patients. Diabetes is a life style disease which interferes with the ability of human body to store and produce insulin. This pancreas generated insulin controls the sugar level of blood [1]. It has adverse effect on the eyes called Diabetic Retinopathy (DR), on nervous system called diabetic neuropathy, on kidneys called diabetic nephropathy, but most likely affected part is retina is the patient vision. The after effect of DR is the damage of retinal blood vessels. DR has no early signs, thus most of the patients are unaware of their disease until it turns to become more severe [2]. However, its adverse effect on vision may be avoided by consulting ophthalmologist for regular screening for DR. Ophthalmologists have to put up good effort to analyze fundus images and arrive at a valid conclusion regarding the severity of the disease. If the initial tasks such as analyzing the images and identification of various lesions and vessel segmentation are automated, the Doctors can make a quick diagnosis. Thus, an inexpensive automated system capable of meeting the demands of increasing diabetic population is of great help for Doctors and diabetic patients.
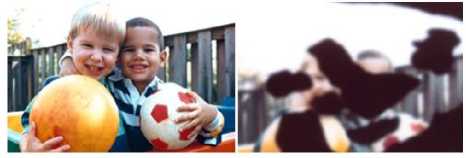
Fig. 1. Loss of vision due to the influence of diabetes: (a) Normal vision (b) Diabetic Retinopathy (Courtesy: National Eye Institute, National Institute of Health [3]).
The images shown in Fig. 1 demonstrate the adverse effect of DR on patient vision. The sample retinal image with marked lesions and main retinal features is given in Fig. 2. The image of retina was taken from DIARETDB1
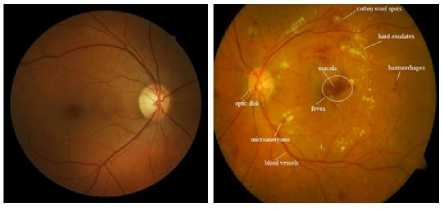
(a) Healthy retina
(b) Abnormal retina
Fig. 2. Retina fundus images (a) Normal healthy retina (b) Diabetic Retinopathy [4].
dataset [3]. Vision loss will occur when exudates are present in macular region, which is known as Diabetic Macular Edema (DME). Fig. 2.a shows the normal healthy color retina image. Abnormal retina image where various lesions and main retinal structures marked is presented in Fig. 2.b.
Before we review the approaches/ techniques for detection of anatomical structures of retina and lesions of DR, we present brief introductions to retinal fundus imaging, anatomical structures of retina, lesions of diabetic retinopathy and publically available retinal databases in the following subsections:
-
A. Retinal Fundus Imaging
Retinal images are acquired through variety of techniques such as Fluorescein Angiograms (FA) or fundus camera. Fluorescein is injected into our body before imaging for improving the contrast of features like arteries, capillaries and veins. Images thus obtained will have better visibility for vessel features. However, such gray-scale imaging of retina is time consuming, inconvenient, costly and having side effects on patients. As the gray scale images do not provide all details of retina, it is not adequate for proper diagnosis. Nowadays, use of color fundus images taken through fundus camera is found useful for better diagnosis. This makes use of color CCD sensors to grab fine details of retina image.
-
B. Anatomical Structures of Retina
-
• Optic disc or blind spot – optic nerves that enter into the round zone region of the retina is called optic disc.
-
• Fovea - the depression in the retina that contains only cones, and provides acute vision.
-
• Macula – area in the middle of the retina that
allows seeing objects with great detail.
-
• Vessels – thin, elongated piecewise linear
structures in the retina and they have limited curvature. Width and length of vessels widely vary across the image. Vessels always converge into the optic disc are usually connected and shape is similar to the binary tree. The diameter of the vessels decreases when the distance from the optic disc increases.
-
C. Lesions of Diabetic Retinopathy
-
• Exudates –Due to the damages of blood vessels of retina, there will be leaking of lipid out of blood vessels which is a major indicator of DR. These lipid leaks produces yellow structures on retina called hard exudates, and white structure on retina called soft exudates. Hard exudates have clear boundaries but soft exudates or cotton wool spots have fuzzy borders.
-
• Hemorrhages – smallest spots of blood that break into the retina.
-
• Microaneurysms – are enlarged, aneurismal retina vessels that show up as red dots on retina. This is caused due to the occlusion of vessel capillary and frequent leak of fluid.
-
D. Publicly available Retina Image Database
Databases mainly used for vessel segmentation are DRIVE [5] and STARE [6].
There are 40 color fundus images including 7 images affected by pathologies in DRIVE database. STARE database is a collection of 20 color fundus images, 10 among them are pathology affected images.
DIARETDB1 database is used for lesion analysis. It has 89 color images including 84 images having some lesions of DR. Ground truth provides rough annotations by four experts but to get correct segmentation of lesions without the help of trained persons is difficult.
HEI-MED database [7] contains 169 images used for detection of exudates and Diabetic Macular Edema (DME). This Database is not suitable for lesion level analysis for the same reason as DIRECTDB1 Database.
MESSIDOR [8] contains 1200 images, macula centered color fundus images, usually used for grading the severity of DME, but cannot be used for segmentation of lesions.
E-ophtha database [9] consists of two sub databases, one for microaneurysms ( e-ophtha-MA), and the other for exudates (e-ophtha-EX). It includes ground-truth annotated by ophthalmology experts.
VICAVR database [10] provides images with separated arteries and veins which can be used for computing ratio of arteries and veins.
The review, in this paper, is organized into two broad categories of existing research, one dealing with the detection and extraction of anatomical structures of retina, and the other dealing with the detection and extraction of lesions of diabetic retinopathy. The next two major sections present the review of existing research work in these two broad categories.
-
II. Research Related to Computer Aided Detection of Anatomical Structures in Retinal Images
Knowledge about structure/ shape and location of optic disc, fovea, macula and vessels is very important in retinal fundus image analysis. Optic disc features are similar to exudates, and hence it is required to erase the optic disc area from the image before the classification of exudates. Also, finding the location of optic disc is important for segmentation of other retinal features such as fovea and macula. Identification of fovea is used for identifying the risk associated with DR such as DME [11,
-
12] . Vessel narrowing, complete occlusions or new vessel development introduces changes in morphological structure of the retina vessel distribution/ blood flow. These are useful for detection of hypertension [13] and cardiovascular diseases such as DR [1], Glaucoma [14], obesity [15], and arteriosclerosis [16]. Segmentation of vessels is necessary for locating structures of retina like fovea and optic disc. It also serves for registration of retinal images. The progression of diseases may be monitored automatically using registered images.
Review of the research related to various anatomical structures of retina may be grouped in to the following three categories:
-
1. Segmentation of vessels and vessel centerline extraction
-
2. Segmentation of optic disc and its localization
-
3. Fovea / Macula detection extraction
The following three subsections review the above three categories of works. The performance figures of different works in each of the categories are discussed, and the issues and lacuna of existing approaches are brought out.
-
A. Vessel Segmentation and Vessel Centerline
Extraction
Extraction of vessels may be thought as a problem of detection of lines in the image. Ordinary edge detectors such as Sobel and Prewitt do not produce good results due to smooth change in intensity of vessels. The thinned vessels and low local contrast vessels are also not detected by these classical edge detection operators. Computational analysis of the retinal image was first attempted by Akitha and Huga in 1982 [17]. Chaudhuri et al. [18] published the first paper on retinal vessel segmentation.
There are numerous methods available for the detection of vessels. Such methods may be grouped in to four main categories based on: matched filter, tracking, machine learning, and morphology. Machine learning is subdivided into supervised and unsupervised methods. Sometimes the combination of these techniques is also used to solve vessel detection.
Matched Filter based techniques are based on the principle of response to vessels in the image. Matched filter is a widely used template matching algorithm. Here, we assume that the vessels are piecewise linear and intensities follow Gaussian distribution [18]. Vessels in different directions are detected by the use of a set of Gaussian filters. These assumptions are the limitations of the Chaudhuri et al. [18] as these do not hold at all vessel regions of the image.
Tracking based techniques s tarts from a set of seed points selected either manually or automatically, and then obtain the whole structure of vessels using local information. Advantage of this type of method is the increased accuracy with which vessel diameter measurement can be made. In the absence of proper seed points, tracking based methods are sometimes unable to detect all vessel segments and subtrees.
Another type of approach is mathematical morphology based , that uses various morphological operators. It is noise resistant compared to the supervised methods. First we get prior known vasculature shape features, then filter vasculature from the background for final segmentation. The accuracy is dependent upon the choice of structuring elements.
Machine learning based: In supervised methods, pixels can be classified into two classes, one for vessels and the other for non-vessels. They require pre-labelled training datasets and efficient training time and need dataset marked by experts for training which is not available in real time applications.
Rest of this Section reviews the existing research work related to vessel segmentation and vessel centerline extraction approaches. New vessel detection in optic disc, artery-vein classification, and vessel Tortuosity measurement are also briefly discussed.
Classical matched filter introduced by Chaudhuri et al. [18] is widely used because of its simplicity. It works by filtering with a kernel designed to match the cross section of vessel as Gaussian function and thresholding. It suffers from interrupted vessel segmentation and false detection of some non-vessels such as edges of lesions and other retinal structures. Matched filter values are empirically estimated.
Some researchers used different type of PDF kernel functions to improve the results [19, 20]. In [20], Student PDF is used instead of Gaussian PDF. In [19], Zolfagharnasab and Naghsh-Nilchi proposed a new kernel function by using Cauchy PDF to produce the improved results. They concluded that Cauchy PDF can model the alternation in intensity of vessels better than Gaussian PDF. Second derivative based Gaussian matched filter is used to achieve improved performance of the matched filter in [21]. Some researchers tried to improve the performance instead of changing the PDF function. Methods proposed in [21], [22] and [23] belongs to this category. In [21], performance of a matched filter is improved by changing its parameters. They used a simple optimization algorithm that uses a simple search space while in [22], genetic algorithm is used to find the optimal parameters of matched filter. Ant colony based matched filter optimization is used in [23].
Chanwimaluang et al. [24] used local entropy thresholding on enhanced vessels to get the segmented vessels. Matched filter is used for enhancing the vessels. Length filtering removes the misclassified pixels. The method is simple and works well on healthy images but produces more false positives in case of unhealthy images. Lesions are also enhanced and detected as vessels. Hoover et al. [25] presented an approach to detect the retinal vessels and segment them automatically. It uses matched filter responses and threshold probing process. They created STARE dataset, which contains a collection of retinal fundus image and ground truth to evaluate the results.
Zhang et al. [26] proposed an improvisation of classical matched filter [18]. They added first order derivative to matched filter to achieve better performance. This approach detects small vessels and reduces false detections.
Pulse Coupled Neural Network (PCNN) based vessel segmentation by firing neighboring neurons along with matched filter is proposed in [27]. After segmentation by PCNN, final vessel map is obtained by thresholding and analyzing regional connectivity.
Softka et al. [28] introduced a new likelihood ratio test which makes use of the output of matched filter and measures of vessel confidence and edges. 6-D measurement vector is computed for each pixel from these measures. Vessel confidence of each pixel is computed by mapping the 6-Dimensional vector to a likelihood ratio. This, combined with tracking, can be used as an effective vessel center-line extraction algorithm. Since the vessel width is widely varying across the image, matched filter with single scale is not efficient. Thus, a multi scale filter is developed by Li et al. [29] is used to improve the performance, however, the selection of various parameters is important.
Given in [30] is a technique for extracting center-lines employing multi-scale matched filter with Sparse Representation Classifier (SRC). Main steps used in their work are: multiscale matched filter based detection of vessel center-line, and the use of double thresholding. Pixels are categorized as vessel and non-vessel centerlines making use of SRC. This uses two dictionary; one for small scale to medium scale vessel center-lines and non-vessel center-lines, and the other for large scale vessel center-lines and non-vessel center-lines. Authors claim that the method efficiently separates the vessel center-lines from non-vessel center-lines and detects small vessels center-lines. But, the artificially generated fixed dictionaries for vessel extraction using Gaussian function reduce the discriminative performance of SRC.
Mendonca et al. [31] proposed morphology based method attempting to detect vascular network of retina automatically. The authors made use of morphological operations for filling vessel segments after extracting center-lines using differential filters. However, the approach suffers from interference due to the presence of optic disc structures, areas of pathologies, under segmentation and missing of vessels.
The work of Amin et al. [32] is a method based on phase congruency and thresholding. Phase congruency is invariant to image brightness or contrast and is obtained using Log-Gabor wavelets. This requires less processing time. Vlachos et al. [33] proposed a tracking based approach. Another approach for vessel segmentation is that by Sinthanayothin et al. [34]. They employed multilayer NN and Principal Component Analysis (PCA) for segmenting vessels.
The vessel detection technique based on ridges presented by Staal et al. [35] is a supervised approach. The approach makes use of extraction of ridges that are aligned with the centerlines. The approach computes 27 features for every pixels, and classification was performed by k-NN classifier. The authors claim that the method works better than two rule based method, given in [25] and Jiang et al. [36]. The limitation of this method is due to the missing of the central part of the vessel and lower accuracy in case of pathological images. The method proposed in [37] for segmentation of retinal vasculature is a supervised one. Response at different scales of oriented Gabor filters along with edge strength and morphological operators are used to compute a 7Dimensional feature. A GMM (Gaussian Mixture Model) based classifier is used for discrimination between vessel and non-vessel pixels. Use of bit planes and centerlines to segment vessels in retina is presented in [38].
Neural network based supervised pixel classification to segment retina vessels is proposed by Marin et al. in [39]. They used 7 features such as gray level including moment invariant features. The results of classification in the form of real numbers in the range of 0 to 1 are thresholded to obtain correct classification. Conditional random field based supervised method is used to segment retina vessels is proposed in [40]. Classification is performed using Support Vector Machine (SVM). [41] deals with an unsupervised weighted fuzzy c-means algorithm. The approach produced improved results because it considers spatial information, and the weight used is derived from K-NN algorithm. It is simple, less prone to noise and produces accurate segmentation results but fails in case of abnormal images.
Most methods perform better on healthy images and performance degrades in the presence of lesions. In [42] and [43], only bright lesions are considered. Laplacian operator is used to detect vessel-like objects. Vessel center-lines are found by normalized gradient vector fields. Pixel divergence is positive for vessel and negative for a non-vessel. Vessel center-lines are selected and noisy detected blood vessel-like objects are pruned by checking whether this pixel is far away from the centerlines. Selection of threshold value for artifact removal is necessary.
The scales and sizes of basic line detectors are modified to obtain the mutliscale line detectors for detecting the vessels of retina images in [44] so as to avoid the drawback of each individual basic line detectors. Another unsupervised method to handle bright lesions in vessel segmentation is proposed in [43], which uses K-means clustering algorithm to detect bright lesion regions. Then reduce the impact of bright lesion regions by subtracting the intensity by an amount determined by the intensity of perspective image. Line operator in three scale is used to detect blood vessels. It is a simple method and some dark lesions are also removed due to the irregularity shape of lesions. But thinned non-vessels sometimes cannot be removed efficiently.
A method to handle dark and bright lesions together based on multi-concavity is proposed in [45]. This makes use of different measures of concavity such as differentiable, line shape, and locally. First measure handles bright lesions, second handles dark lesions and third measure deals with unevenly distributed noise. These features together with lifting technique will produce desired results. A segmentation technique making use of high level features for removing nonvessels is proposed in [46]. Segmentation is performed, first by using low level features, and then by using high level features. Output of matched filter with FDOG is used for first level of segmentation. High level features such as linearity, irregularity, concavity and worm shape are used. Vessels and non-vessels are separated using SVM.
Use of multiscale Gabor filters for vessel classification is proposed by Osareh and Shadgar [47]. Candidate vessel identification is done by gabor filters and feature classification is achieved by GMM and SVM classifiers. [48] used Complex Continuous Wavelet Transform
(CCWT) for vessel enhancement and segmentation. The line structures along various directions are obtained by the optimization of CCWT parameters. Adaptive histogram based thresholding and length filtering is used to produce final classification results.
Morphological component analysis based on sparse representation is used to segment vessels in the proposal given in [49]. Wihandika and Suciati [50] described a method to remove false positive occurrence due to edge of optic disc in retina vessel segmentation.
Various vascular anomalies such as venous and arterial loops in FA images are described in [51]. Usually, vessel branching is dichotomous. Thus, triple branching of vessels at branches of arteries and veins are unusual. Though the crossings of arteriovenous are normal in fundus images, the vessels of same type are not normally involved in such crossings.
Table 1. Performance comparison of various vessel segmentation algorithms reviewed.
|
Researchers |
Year |
Techniques used |
Database used |
Performance reported |
|||||||
|
Sen. |
Sp. |
Acc. |
AROC |
MTPR |
MFPR |
MTNR |
MAA |
||||
|
Chaudhuri et al.[18] |
1989 |
Matched Filter |
DRIVE |
- |
- |
0.8773 |
0.7878 |
- |
- |
- |
- |
|
Zolfagharnasab and Naghsh-Nilchi [19] |
2014 |
Matched Filter |
DRIVE |
- |
- |
- |
- |
62.39 |
2.863 |
97.14 |
- |
|
Al-Rawi et al.[21] |
2007 |
Matched Filter |
DRIVE |
- |
- |
0.9535 |
0.9435 |
- |
- |
- |
- |
|
Al-Rawi et al.[22] |
2007 |
Matched Filter |
DRIVE |
- |
- |
0.9422 |
- |
- |
0.9422 |
||
|
Cinsdikici and Aydin [23] |
2009 |
Matched Filter |
DRIVE |
- |
- |
0.9293 |
0.9407 |
- |
- |
- |
- |
|
Hoover et al.[25] |
2000 |
Matched Filter |
STARE |
0.6751 |
0.9567 |
0.9267 |
- |
- |
- |
- |
- |
|
Zhang et al.[26] |
2010 |
Matched Filter |
DRIVE STARE |
0.7120 0.7177 |
0.9724 0.9753 |
0.9382 0.9484 |
- |
- |
- |
- |
- |
|
Yao and Chen [27] |
2009 |
Matched filter |
STARE |
0.8035 |
0.972 |
- |
- |
- |
- |
- |
- |
|
Mendonca and Campilho [31] |
2006 |
Morphology |
DRIVE STARE |
0.7344 0.6996 |
0.9764 0.9730 |
0.9452 0.9440 |
- |
- |
- |
- |
- |
|
Amin et al.[32] |
2010 |
Matched filter |
DRIVE STARE |
- |
- |
0.92 0.91 |
0.94 0.91 |
- |
- |
- |
- |
|
Vlachos et al. [33] |
2010 |
Tracking |
DRIVE |
0.747 |
0.747 |
0.955 |
- |
- |
- |
- |
- |
|
Sinthanayothin et al. [34] |
1999 |
Supervised |
Local Dataset |
0.833 |
0.91 |
- |
- |
- |
- |
- |
- |
|
Staal et al.[35] |
2004 |
Supervised |
DRIVE STARE |
- |
- |
0.9442 0.9516 |
0.952 0.9614 |
- |
- |
- |
- |
|
Fraz et al. [37] |
2011 |
Supervised |
DRIVE STARE |
0.7575 0.7604 |
0.9722 0.9812 |
0.9476 0.9812 |
0.9616 0.9734 |
- |
- |
- |
- |
|
Fraz et al. [38] |
2011 |
Morphology |
DRIVE STARE |
0.7152 0.7311 |
0.9769 0.9680 |
0.9430 0.9442 |
- |
- |
- |
- |
- |
|
Marin et al.[39] |
2011 |
Supervised |
DRIVE STARE |
0.7067 0.6944 |
0.9801 0.9819 |
0.9452 0.9526 |
0.9588 0.9766 |
- |
- |
- |
- |
|
Orlando and Blaschko [40] |
2014 |
Supervised |
DRIVE |
0.785 |
0.967 |
- |
- |
- |
- |
- |
- |
|
Kande et al.[41] |
2009 |
Unsupervised |
DRIVE STARE |
- |
- |
0.8911 0.8976 |
0.9518 0.9298 |
- |
- |
- |
- |
|
Lam and Hong [42] |
2008 |
Unsupervised |
STARE |
- |
- |
- |
0.9392 |
- |
- |
- |
- |
|
Saffarzadeh et al.[43] |
2013 |
Unsupervised |
DRIVE STARE |
- |
- |
0.9387 0.9483 |
0.9303 0.9431 |
- |
- |
- |
- |
|
Nguyen et al.[44] |
2013 |
Morphology |
DRIVE STARE |
- |
- |
0.9407 0.9324 |
- |
- |
- |
- |
- |
|
Lam et al.[45] |
2010 |
Unsupervised |
DRIVE STARE |
- |
- |
0.9472 0.9567 |
0.9614 0.9739 |
- |
- |
- |
- |
|
Osareh and Shadgar [47] |
2009 |
Supervised |
DRIVE |
- |
- |
- |
0.9650 |
- |
- |
- |
- |
|
Fathi and nilchi [48] |
2013 |
Unsupervised |
DRIVE STARE |
0.7768 0.8061 |
0.9759 0.9717 |
0.90.95 91581 |
0.9516 0.9680 |
- |
- |
- |
- |
|
Imani et al. [49] |
2015 |
unsupervised |
DRIVE STARE |
- |
- |
0.9523 0.9590 |
- |
- |
- |
- |
- |
|
Franklin et al.[ [50] |
2014 |
Supervised |
DRIVE |
- |
- |
0.9503 |
- |
- |
- |
- |
- |
|
Wihandika and Suciati [51] |
2013 |
Unsupervised |
DRIVE |
- |
- |
0.942 |
- |
- |
- |
- |
- |
MTPR – Mean of true positive ratio; MFPR – Mean of false positive ratio; MTNR – Mean of true negative ratio, MAA=maximum average accuracy,
AROC=area under ROC, Sen. - sensitivity, Sp.-specificity, Acc.-accuracy
New Vessels in Optic Disc
Extraction of vessels may be thought as a problem of detection of lines in the image. Ordinary edge detectors such as Sobel and Prewitt do not produce good results due to smooth change in intensity of vessels. The thinned vessels and low local contrast vessels are also not detected by these classical edge detection operators. Computational analysis of the retinal image was first attempted by Akitha and Huga in 1982 [17]. Chaudhuri et al. [18] published the first paper on retinal vessel segmentation.
There are numerous methods available for the detection of vessels. Such methods may be grouped in to four main categories based on: matched filter, tracking, machine learning, and morphology. Machine learning is subdivided into supervised and unsupervised methods. Sometimes the combination of these techniques is also used to solve vessel detection.
Matched Filter based techniques are based on the principle of response to vessels in the image. Matched filter is a widely used template matching algorithm. Here, we assume that the vessels are piecewise linear and intensities follow Gaussian distribution [18]. Vessels in different directions are detected by the use of a set of Gaussian filters. These assumptions are the limitations of the Chaudhuri et al. [18] as these do not hold at all vessel regions of the image.
Tracking based techniques s tarts from a set of seed points selected either manually or automatically, and then obtain the whole structure of vessels using local information. Advantage of this type of method is the increased accuracy with which vessel diameter measurement can be made. In the absence of proper seed points, tracking based methods are sometimes unable to detect all vessel segments and subtrees.
Another type of approach is mathematical morphology based , that uses various morphological operators. It is noise resistant compared to the supervised methods. First we get prior known vasculature shape features, then filter vasculature from the background for final segmentation. The accuracy is dependent upon the choice of structuring elements.
Machine learning based : In supervised methods, pixels can be classified into two classes, one for vessels and the other for non-vessels. They require pre-labelled training datasets and efficient training time and need dataset marked by experts for training which is not available in real time applications.
Rest of this Section reviews the existing research work related to vessel segmentation and vessel centerline extraction approaches. New vessel detection in optic disc, artery-vein classification, and vessel Tortuosity measurement are also briefly discussed.
Classical matched filter introduced by Chaudhuri et al. [18] is widely used because of its simplicity. It works by filtering with a kernel designed to match the cross section of vessel as Gaussian function and thresholding. It suffers from interrupted vessel segmentation and false detection of some non-vessels such as edges of lesions and other retinal structures. Matched filter values are empirically estimated.
Some researchers used different type of PDF kernel functions to improve the results [19, 20]. In [20], Student PDF is used instead of Gaussian PDF. In [19], Zolfagharnasab and Naghsh-Nilchi proposed a new kernel function by using Cauchy PDF to produce the improved results. They concluded that Cauchy PDF can model the alternation in intensity of vessels better than Gaussian PDF. Second derivative based Gaussian matched filter is used to achieve improved performance of the matched filter in [21]. Some researchers tried to improve the performance instead of changing the PDF function. Methods proposed in [21], [22] and [23] belongs to this category. In [21], performance of a matched filter is improved by changing its parameters. They used a simple optimization algorithm that uses a simple search space while in [22], genetic algorithm is used to find the optimal parameters of matched filter. Ant colony based matched filter optimization is used in [23].
Chanwimaluang et al. [24] used local entropy thresholding on enhanced vessels to get the segmented vessels. Matched filter is used for enhancing the vessels. Length filtering removes the misclassified pixels. The method is simple and works well on healthy images but produces more false positives in case of unhealthy images. Lesions are also enhanced and detected as vessels. Hoover et al. [25] presented an approach to detect the retinal vessels and segment them automatically. It uses matched filter responses and threshold probing process. They created STARE dataset, which contains a collection of retinal fundus image and ground truth to evaluate the results.
Zhang et al. [26] proposed an improvisation of classical matched filter [18]. They added first order derivative to matched filter to achieve better performance. This approach detects small vessels and reduces false detections.
Pulse Coupled Neural Network (PCNN) based vessel segmentation by firing neighboring neurons along with matched filter is proposed in [27]. After segmentation by PCNN, final vessel map is obtained by thresholding and analyzing regional connectivity.
Softka et al. [28] introduced a new likelihood ratio test which makes use of the output of matched filter and measures of vessel confidence and edges. 6-D measurement vector is computed for each pixel from these measures. Vessel confidence of each pixel is computed by mapping the 6-Dimensional vector to a likelihood ratio. This, combined with tracking, can be used as an effective vessel center-line extraction algorithm. Since the vessel width is widely varying across the image, matched filter with single scale is not efficient. Thus, a multi scale filter is developed by Li et al. [29] is used to improve the performance, however, the selection of various parameters is important.
Given in [30] is a technique for extracting center-lines employing multi-scale matched filter with Sparse Representation Classifier (SRC). Main steps used in their work are: multiscale matched filter based detection of vessel center-line, and the use of double thresholding. Pixels are categorized as vessel and non-vessel centerlines making use of SRC. This uses two dictionary; one for small scale to medium scale vessel center-lines and non-vessel center-lines, and the other for large scale vessel center-lines and non-vessel center-lines. Authors claim that the method efficiently separates the vessel center-lines from non-vessel center-lines and detects small vessels center-lines. But, the artificially generated fixed dictionaries for vessel extraction using Gaussian function reduce the discriminative performance of SRC.
Mendonca et al. [31] proposed morphology based method attempting to detect vascular network of retina automatically. The authors made use of morphological operations for filling vessel segments after extracting center-lines using differential filters. However, the approach suffers from interference due to the presence of optic disc structures, areas of pathologies, under segmentation and missing of vessels.
The work of Amin et al. [32] is a method based on phase congruency and thresholding. Phase congruency is invariant to image brightness or contrast and is obtained using Log-Gabor wavelets. This requires less processing time. Vlachos et al. [33] proposed a tracking based approach. Another approach for vessel segmentation is that by Sinthanayothin et al. [34]. They employed multilayer NN and Principal Component Analysis (PCA) for segmenting vessels.
The vessel detection technique based on ridges presented by Staal et al. [35] is a supervised approach. The approach makes use of extraction of ridges that are aligned with the centerlines. The approach computes 27 features for every pixels, and classification was performed by k-NN classifier. The authors claim that the method works better than two rule based method, given in [25] and Jiang et al. [36]. The limitation of this method is due to the missing of the central part of the vessel and lower accuracy in case of pathological images. The method proposed in [37] for segmentation of retinal vasculature is a supervised one. Response at different scales of oriented Gabor filters along with edge strength and morphological operators are used to compute a 7Dimensional feature. A GMM (Gaussian Mixture Model) based classifier is used for discrimination between vessel and non-vessel pixels. Use of bit planes and centerlines to segment vessels in retina is presented in [38].
Neural network based supervised pixel classification to segment retina vessels is proposed by Marin et al. in [39]. They used 7 features such as gray level including moment invariant features. The results of classification in the form of real numbers in the range of 0 to 1 are thresholded to obtain correct classification. Conditional random field based supervised method is used to segment retina vessels is proposed in [40]. Classification is performed using Support Vector Machine (SVM). [41] deals with an unsupervised weighted fuzzy c-means algorithm. The approach produced improved results because it considers spatial information, and the weight used is derived from K-NN algorithm. It is simple, less prone to noise and produces accurate segmentation results but fails in case of abnormal images.
Most methods perform better on healthy images and performance degrades in the presence of lesions. In [42] and [43], only bright lesions are considered. Laplacian operator is used to detect vessel-like objects. Vessel center-lines are found by normalized gradient vector fields. Pixel divergence is positive for vessel and negative for a non-vessel. Vessel center-lines are selected and noisy detected blood vessel-like objects are pruned by checking whether this pixel is far away from the centerlines. Selection of threshold value for artifact removal is necessary.
The scales and sizes of basic line detectors are modified to obtain the mutliscale line detectors for detecting the vessels of retina images in [44] so as to avoid the drawback of each individual basic line detectors. Another unsupervised method to handle bright lesions in vessel segmentation is proposed in [43], which uses K-means clustering algorithm to detect bright lesion regions. Then reduce the impact of bright lesion regions by subtracting the intensity by an amount determined by the intensity of perspective image. Line operator in three scale is used to detect blood vessels. It is a simple method and some dark lesions are also removed due to the irregularity shape of lesions. But thinned non-vessels sometimes cannot be removed efficiently.
A method to handle dark and bright lesions together based on multi-concavity is proposed in [45]. This makes use of different measures of concavity such as differentiable, line shape, and locally. First measure handles bright lesions, second handles dark lesions and third measure deals with unevenly distributed noise. These features together with lifting technique will produce desired results. A segmentation technique making use of high level features for removing nonvessels is proposed in [46]. Segmentation is performed, first by using low level features, and then by using high level features. Output of matched filter with FDOG is used for first level of segmentation. High level features such as linearity, irregularity, concavity and worm shape are used. Vessels and non-vessels are separated using SVM.
Use of multiscale Gabor filters for vessel classification is proposed by Osareh and Shadgar [47]. Candidate vessel identification is done by gabor filters and feature classification is achieved by GMM and SVM classifiers. [48] used Complex Continuous Wavelet Transform (CCWT) for vessel enhancement and segmentation. The line structures along various directions are obtained by the optimization of CCWT parameters. Adaptive histogram based thresholding and length filtering is used to produce final classification results.
Morphological component analysis based on sparse representation is used to segment vessels in the proposal given in [49]. Wihandika and Suciati [50] described a method to remove false positive occurrence due to edge of optic disc in retina vessel segmentation.
Various vascular anomalies such as venous and arterial loops in FA images are described in [51]. Usually, vessel branching is dichotomous. Thus, triple branching of vessels at branches of arteries and veins are unusual. Though the crossings of arteriovenous are normal in fundus images, the vessels of same type are not normally involved in such crossings.
DR leads to the growth of new vessels. Usually abnormal vessels in disc are smaller and more tortuous. An approach for new vessel detection in optic disc is proposed in [53]. In this, watershed transform is used to detect segments similar to vessels. 15 features such as shape, line density and contrast are computed for each of the segments. Then, each segment is classified based on these features using SVM classifier as normal or abnormal. Area under the R
New Vessels in Optic Disc
DR leads to the growth of new vessels. Usually abnormal vessels in disc are smaller and more tortuous. An approach for new vessel detection in optic disc is proposed in [53]. In this, watershed transform is used to detect segments similar to vessels. 15 features such as shape, line density and contrast are computed for each of the segments. Then, each segment is classified based on these features using SVM classifier as normal or abnormal. Area under the ROC is obtained as 0.911.
Artery Vein (A/V) Classification
Artery and veins are similar in appearance, but arteries are brighter and in red color as these carry oxygen rich blood. Veins are darker because they carry blood with low oxygen content. In general, artery calibers are smaller than veins and have thicker walls than neighbouring veins. Central reflex is wider in arteries. One characteristic of the retinal vessel tree is that, at least in the region near the optic disc (OD), veins rarely cross veins, and arteries rarely cross arteries, but both types can bifurcate to narrower vessels, and veins and arteries can cross each other [54]. At crossover points, one vessel is artery and other vessel is vein, and at every bifurcation point, all the vessels are of same type [55].
The first known research work to separate the arteries and veins is by Grisan et al. [56]. It is an automatic method based on tracking that classifies the vessels belonging to a concentric zone surrounding the optic disc. This algorithm does not consider the vessels in the zone together.
Behdad Dashtbozorg et al. [54] proposed a method to classify arteries and veins based on analysis of graph. It has mainly three phases, namely, graph generation, graph analysis and vessel classification. In graph representation of retina vasculature, each node represents one type of intersection point and links represent vessel segments. Accuracy values of 87.4% and 89.8% are obtained when tested with DRIVE, and VICAVR databases, respectively. Vessels in optic disc are also considered for classification. But, if a vessel segmented is misclassified, then its successors are also misclassified.
Automated and structured supervised method for A/V classification is proposed in [55]. After enhancement, vessel center-lines are segmented, and bifurcation and crossover points are removed. Then, features are extracted from center-lines of each of the vessel segments and are classified by using LDA. Here, they classify the vessel segments instead of classifying each vessel pixel. Post processing making use of knowledge of structures is employed for connecting the vessel segments at points of cross over and bifurcation.
Tortuosity Measurement
Due to increased blood pressure or due to weak walls of vessels, abnormal vessels appears as tortuous. Widely used method to measure the tortuosity is curve length over chord length [57, 58]. This method fails, when there exists two vessels with same chord length and curve length, but number of curves is different. Other measures such as chain code with number of inflection points [59], tortuosity index [60], measurement based on mean curvature [61] and measurement depends on thickness [62] are introduced to get the accurate measure of tortuosity.
The following discussion brings forth the various issues involved in existing vessel segmentation.
Discussions
Existing algorithms, in general, show poor segmentation performances at the bifurcation, cross over regions, and at the central part of the vessels. Most algorithms fail to extract small, thin vessels having low contrast. Also, the detection of vessels is difficult at regions where close vessels are merged, small vessels are missed, and at optic disc and at regions of pathology. Some algorithms did not consider central reflex pixels as part of a vessel, thus misinterpret them as two vessels. In some cases, two close vessels are considered as one wide vessel if they are merged together. Thus, we need to have high accuracy fast algorithms for unified analysis of fundus images of various datasets. Such systems, when developed will be useful for untrained community health workers who utilize this technology.
Vessel segmentation algorithm gives low accuracy when pathologies are present and fails to detect morphological changes. The growth of new abnormal vessels, abnormality in vessels splitting, loops in vessels and crossings also plays an important role in abnormalities in eye.
During acquisition process, due to the curved shape of the retina, the illumination of retina region will be difficult, and hence the fundus regions are not uniformly illuminated. This leads to variations in the color of retina images. This makes the A/V classification difficult. Improved results can be obtained by adding the features such as shape, texture, and color.
Most of the tortuosity measurement algorithms require manual intervention to avoid the errors, and they were tested only with small dataset.
-
B. Segmentation and Localization of Optic Disc
Different approaches for finding location of optic disc can be categorized as techniques based on: brightest region [63], template matching [64] and vasculature convergence point [65 - 67]. Some of the important research in these categories are those by Aquino et al. [63], Youssif et al. [64], Hoover et al. [65], Mahfouz and Fasmy [66], and Yu et al. [67]. The performance figures obtained and the techniques employed by these researchers in optic disc segmentation and localization are tabulated in Table 2. Lacunae/ issues of existing optic disc detection approaches are presented in the following discussion.
Discussions
The approaches based on machine learning and blood vessels tracing need long processing time. Moreover, the simple application of the blood vessels tracing does not enable to detect the optic disc radius or the boundary. Also, machine learning requires huge number of training samples. Lack of common data set is the main problem faced during testing. The Hough transform, typically used for detecting lines and circles in images, has problem of the optic disc not being a perfect circle but singly elliptic. Though, it can be adapted to detect ellipses, it becomes computationally too heavy. Moreover, techniques based on specific round shape and high brightness fail on pathological images.
-
C. Fovea Detection/ Macula Region Extraction Algorithms
Some of the important work in this category are those by Chin et al. [69] using anatomical priors and vessel density, by Sai and Jayanthi [11] employing motion pattern generation, and by Sinthanayothin et al. [34] using template matching, and classifier based approach proposed by Akram et al. [70]. Performance figures reported in these works are listed in Table 3. Issues involved in these fovea detection techniques are presented in the following.
Discussions
Automatic detection of fovea and macular region extraction becomes complicated when the retina is affected by diseases and also due to non-uniform illumination while imaging retina. Other methods require prior knowledge, and thus complex and time consuming.
Table 2. Performance comparison of various optic disc segmentation and localization methods reviewed
|
Researchers |
Year |
Techniques used |
Number of images used. |
Database used |
Accuracy in Percent |
|
Aquino et al. [63] |
2010 |
Circular Hough transform |
1200 |
MESSIDOR |
86 |
|
Youssif et al. [64] |
2008 |
Vessel direction matched filter |
81 |
STARE/ DRIVE |
98.77/100 within 60 pixels |
|
Hoover et al. [65] |
2003 |
Fuzzy convergence |
81 |
--- |
89 within 60 pixels |
|
Mahfouz and Fasmy AS [66] |
2011 |
Horizontal and vertical edge mapping |
81 |
STARE |
97within 60 pixels |
|
Yu et al.[67] |
2011 |
Gabor filter vessel detection |
1200 |
MESSIDOR |
98.3 within ONH |
|
Neelam Sinha and Venkatesh Babu [68] |
2015 |
Sparse dictionary |
259 |
DRIVE, DIRECTDB1, DIRECTDB0 |
97.6 |
Table 3. Performance comparison of various fovea and macula extraction/detection algorithms reviewed.
|
Researchers |
Year |
Techniques used |
Database used |
Accuracy in Percent |
|
Sai Deepak and Jayanthi Shivaswami [11] |
2012 |
Generation of motion patterns |
MESSIDOR |
Accuracy = 75 |
|
Sinthanayothin et al.[34] |
1999 |
Template matching |
Local dataset |
84.5 for images with fovea within the image. 62.1 for images with fovea at edge of the image. 0 for images with no fovea or less than half of the foveal area is presented. |
|
Chin et al.[69] |
2013 |
Anatomical priors and vessel density |
MESSIDOR |
80 for images without macular edema 59 for images affected by macular edema. |
|
Akram et al. [70] |
2014 |
Classifier based |
HEI-MED/ MESSIDOR |
Acc.= 98.22/ 97.2 |
Table 4. Performance comparison of various lesion detection algorithms reviewed.
|
Researcher |
Techniques |
Lesion |
Number of images used. |
Lesion based (%) |
Image based (%) |
||||||
|
Year |
used |
detected |
Sen. |
Sp. |
PPV |
Sen. |
Sp. |
Acc. |
AROC |
||
|
Philips et al. [71] |
1993 |
Thresholding |
EX |
14 |
87 |
- |
- |
- |
- |
||
|
Sopharak et al. [72] |
2011 |
Morphology |
MA |
15 |
85.68 |
99.99 |
- |
- |
- |
||
|
Sinthanayothi n et al. [73] |
2002 |
Region growing |
EX HMA |
30 |
88.5 77.5 |
99.7 88.7 |
- |
- |
- |
||
|
Walter et al. [74] |
2002 |
Morphological reconstruction |
EX |
15 |
92.8 |
92.4 |
100 |
86.7 |
- |
||
|
Sopharak et al. [75] |
2008 |
Mathematical morphology |
EX |
40 |
80 |
99.46 |
- |
- |
- |
||
|
Reza et al. [76] |
2011 |
Morphology |
EX |
20 |
94.90 |
100 |
- |
- |
- |
||
|
Giancardo et al. [77] |
2011 |
Thresholding |
EX |
HEI-MED |
82 |
- |
- |
- |
|||
|
Osareh et al. [78] |
2001 |
FCM and NN classifier |
EX |
42 |
92 |
82 |
- |
- |
- |
||
|
Niemeijer et al. [79] |
2007 |
Machine learning |
EX CW |
300 |
- |
- |
95 70 |
86 93 |
- |
||
|
Fang et al. [80] |
2010 |
Boosted soft segmentation |
HE |
83 |
88.54 |
85.61 |
100 |
88.57 |
- |
||
|
Sopharak et al [81] |
2011 |
Naive Bayes SVM |
EX |
39 |
- |
93.38 92.28 |
98.14 98.52 |
- |
|||
|
Sanchez et al. [82] |
2009 |
GMM |
EX |
80 |
92 |
- |
- |
100 |
100 |
- |
|
|
Garcia et al. [83] |
2009 |
NN classifier MLP RBF SVM |
HE |
67 |
88.14 88.49 87.61 |
- |
- |
100 100 100 |
92.59 81.48 77.78 |
- |
|
|
Sopharak et al. [84] |
2008 |
Naive Bayes |
EX |
39 |
93.38 |
98.14 |
- |
- |
- |
- |
|
|
Osareh et al. [85] |
2009 |
FCM and NN |
EX |
300 |
93.5 |
92.1 |
- |
96.1 |
94.6 |
- |
|
|
Gardner et al [86] |
1996 |
NN |
HMA |
301 |
73.80 |
- |
- |
- |
- |
- |
|
|
Sopharak et al. [87] |
2012 |
MM and Bayes |
MA |
15 |
85.68 |
99.99 |
- |
- |
- |
- |
|
|
Lee et al. [88] |
2003 |
Morphology |
MA |
20 |
56 |
- |
- |
- |
- |
- |
|
|
Quellec et al. [89] |
2008 |
Template matching |
MA |
120 |
89.2 |
89.5 |
- |
- |
- |
- |
|
|
Zhang et al. [90] |
2014 |
Morphology |
EX |
e-ophtha DIRECTDB1 Messsidor HEI-MED |
- |
- |
- |
- |
- |
0.95 0.95 0.93 0.94 |
|
|
Harangi et al. [91] |
2014 |
Active contours and Bayes Classifier |
EX |
DIRECTDB1 HEI-MED |
86 |
- |
84 |
92 87 |
68 86 |
0.82 0.86 |
-- |
|
Tjandrasa et al. [92] |
2015 |
K-means clustering with SVM, multilayer perception and RBF |
EX |
Messidor |
112 |
- |
- |
89.29 91.07 85.71 |
- |
- |
- |
|
Amel et al. [93] |
2012 |
K-means clustering and morphology |
EX |
Messidor |
50 |
95.92 |
99.78 |
99.7 |
- |
- |
- |
HE: Hard Exudates, EX: Exudates, MA: Microaneurysms, CW: Cotton Wool spots, HMA: Hemorrhages.
-
III. Research Related to Computer Aided Lesion Detection In DR
Retinal lesions may be broadly classified into bright lesions and dark lesions. Exudates are included in the category of bright lesions. These may be of types hard or soft/cotton wool spots. Exudates have bright yellowish color and can be easily discriminated from retina background. Dark lesions include hemorrhages and microaneurysms, and are of deep red color. Microaneurysms are very tiny lesions, whereas hemorrhages are usually much larger. They are difficult to distinguish because of their color similarity with the background.
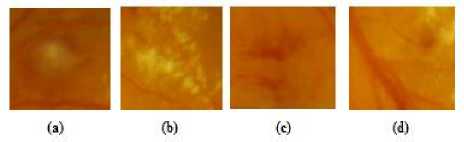
Fig. 3. Different types of lesions of DR: (a) cotton wool spots, (b) hard exudates, (c) hemorrhages, (d) microaneurysms.
Fig. 3 shows different types of lesions of DR. In Fig. 3, (a) – (b) show bright lesions and (c) - (d) show dark lesions. The review given below briefly presents the bright and dark lesion detection techniques and their comparative performance study and discussions.
The bright lesion detection approaches can be grouped into four different categories based on Thresholding [71 -77], region growing [73], morphology [74 – 76, 90, 93], and classification [78, 79, 81 – 85, 91 - 92]. An issue with exudates detection is the similar properties of exudates and optic disc. Hence, most of the methods first eliminate optic disc to achieve better segmentation of exudates.
Dark lesion detection methods are divided into supervised [86 - 87], recursive growing [73], morphology based [72, 88] and template matching [89]. Performance figures reported by various researchers in Lesion detection are tabulated along with the methods/ approaches employed as in Table 4. Remarks about the performances and the issues involved in existing lesion detection research are presented in the following discussion.
Discussions
Most of the existing algorithms detect dark lesions that include both microaneurysms and hemorrhages, and bright lesion detection that include both hard and soft exudates. There is no differentiation between two bright lesions and between two dark lesions. The main difficulty in exudates detection is due to lack of uniformity in illumination and the interference with other objects of similar nature.
In the case of dark lesions, wide variations occur in microaneurysms and background color. Further complications arise because of hemorrhages, retinal vessels and other DR related abnormalities. Automatic detection of hemorrhages is difficult because it can be often confused with the presence of other dark areas in the image. For example, the colors of fovea, blood vessels, and microaneurysms are all dark. Mostly, false detection arises when blood vessels and hemorrhages are very close or overlapping.
Supervised approach requires a set of hand labeled retinal Image to train the model; this is a laborious task. Processing time and necessary resources required to implement the model are more, compared to unsupervised approaches. Also, creation of dataset with hand labeled ground truth requires more time. Systems designed with datasets of limited features will be usage limited to those types of images and may fail to detect other types of retina images. Most of the existing systems, designed with a set of assumptions such as specific characteristics of resolution and field of view, fail to provide acceptable results for real time applications and other datasets. Many algorithms used independent datasets which complicates the comparison of existing works. Most of these algorithms are prone to lack of uniformity in illumination. Existing algorithms for lesion detection are not that useful for practical application because of the wide variations in the color of retina images arising out of reasons such as variations in the degree of pigmentation and presence of choroid. Thus, there arises need for a good model for automatic lesion detection that works with different dataset without much constraints/ assumptions such as field of view and parameter settings or recalibration.
-
IV. Conclusion
Abnormalities in retina are symptoms of various diseases in human body, and the most adversely affected part is the vision system of patients, and the disease is known as diabetic retinopathy (DR). As DR exhibits no early symptoms, early detection and screening of diseases help effective medication and can reduce the progress of DR. This paper presented a review of various existing research in detection of anatomical structures in retina and detection of lesions of diabetic retinopathy. The research works in the detection and extraction of structures of retina and lesions of diabetic retinopathy are categorized into: vessel segmentation and vessel centerline extraction, optic disc segmentation and localization, and fovea/ macula detection and extraction. Research works dealing with these four categories are reviewed with respect to the techniques employed, performance figures reported, and advantages and deficiencies/ issues of the approaches. The outcome of the review under each category of works is presented. The observations made out of the review may be briefly summarized as follows:
Most of the vessel detection algorithms fail to extract small thin vessels having low contrast. It is difficult to detect vessels at regions where close vessels are merged, missing small vessels, at optic disc regions, and at regions of pathology. Machine learning based approaches for blood vessel tracing requires long processing time. It is difficult to detect optic disc radius or boundary with simple application of the blood vessel tracing. Automatic detection of fovea and macular region extraction becomes complicated due to pathologies and non-uniform illumination. Some of the other methods are complex due to the requirement of prior knowledge. Performances of existing lesion detection algorithms are poor due to wide variations in the color of fundus images arising out of imaging process.
The prevalence of diabetic patients is continually increasing. The task of detecting and evaluating the severity of DR in populations with diabetes is enormous. An automated system will be useful for ophthalmologist to easily manage the screening for early detection of DR. This enables the patients in rural areas to get consultation on time at low cost. Thus, based on the issues brought out of this review of current research, it is evident that a good amount of further research is required in this area to fulfill the requirements for developing a useful automated system.
References A Review of Computer Aided Detection of Anatomical Structures and Lesions of DR from Color Retina Images
- Kanski J J. Clinical Ophthalmology: A Systemic Approach. 3rd ed. Oxford: Butterworth-Heinemann, 1994
- Scanlon, P. H., S. J. Aldington, and I. M. Stratton. Delay in diabetic retinopathy screening increases the rate of detection of referable diabetic retinopathy, Diabetic Medicine 31.4 (2014): 439-442.
- National Eye Institute, National Institute of Health, [online]: http://www.nei.nih.gov/health/
- DIARETDB1 - Standard Diabetic Retinopathy Database Calibration level 1. [Online]: http://www2.it.lut.fi/project/imageret/diaretdb1/index.html
- DRIVE dataset [Online]: http://www.isi.uu.nl/Research/Databases/DRIVE/
- STARE: Structured Analysis of the Retina, [Online]: http://www.ces.c1emson.edul-ahoover/stare/
- L. Giancardo, F. Meriaudeau, T. P. Karnowski, Y. Li, K. W. Tobin and E. Chaum, Automatic retina exudates segmentation without a manually labelled training set, Proc. of the 8th IEEE Int. Symp. Biomed. Imag: From Nano to Macro, ISBI 2011, Chicago, USA, pp. 1396 –1400.
- MESSIDOR: Methods for evaluating segmentation and indexing techniques dedicated to retinal ophthalmology. [Online]. Available: http://messidor.crihan.fr/index-en.php
- Decencière, E., Cazuguel G., Zhang TeleOphta: Machine learning and image processing methods for teleophthalmology, IRBM 34.2 (2013): 196-203.
- The VICAVR database, http://www.varpa.es/vicavr.html, 2010.
- Deepak, K. Sai, and Jayanthi Sivaswamy. Automatic assessment of macular edema from color retinal images, Medical Imaging, IEEE Transactions on 31.3 (2012): 766-776.
- Sreejini K S and V K Govindan. Severity Grading of DME from Retina Images: A Combination of PSO and FCM with Bayes Classifier, International Journal of Computer Applications 81(16):11-17, November 2013
- H. Leung, J.J. Wang, E. Rochtchina, T.Y. Wong, R. Klein, P. Mitchell, Impact of current and past blood pressure on retinal arteriolar diameter in older population, Journal of Hypertension (22) (2004) 1543–1549.
- P. Mitchell, H. Leung, J.J. Wang, E. Rochtchina, A.J. Lee, T.Y. Wong, R. Klein, Retinal vessel diameter and open-angle glaucoma: the Blue Mountains eye study, Ophthalmology (112) (2005) 245–250
- J.J. Wang, B. Taylor, T.Y. Wong, B. Chua, E. Rochtchina, R. Klein, P. Mitchell, Retinal vessel diameters and obesity: a population-based study in older persons, Obesity Research (14) (2006) 206–214.
- Nguyen, Thanh Tan. Relationship of Retinal Vascular Caliber with Diabetes and Retinopathy The Multi-Ethnic Study of Atherosclerosis (MESA), Diabetes Care 31.3 (2008): 544-549.
- K. Akita, H. Kuga, A computer method of understanding ocular fundus images, Pattern Recognition 15 (1982) 431–443
- S. Chaudhuri, S. Chatterjee, N. Katz, M. Nelson, M. Goldbaum, Detection of blood vessels in retinal images using two-dimensional matched filters, IEEE Transactions on Medical Imaging 8 (1989) 263–269.
- Zolfagharnasab and Naghsh-Nilchi: Cauchy based matched filter for retinal vessels detection, Journal of Medical Signals & Sensors, Vol 4, Issue 1, 2014.
- Zolfagharnasab H, Naghsh-Nilchi AR. Retinal vessels detection based on matched filter using student distribution function. Journal of Medical and Biomedical Engineering 2013; Manuscript No. JMBE 1745- Manuscript submitted for publication.
- Mohammed Al-Rawi, Munib Qutaishat, and Mohammed Arrar. An improved matched filter for blood vessel detection of digital retinal images. Computers in Biology and Medicine, 37(2):262-267, 2007.
- Mohammed Al-Rawi and Huda Karajeh. Genetic algorithm matched filter optimization for automated detection of blood vessels from digital retinal images. Computer Methods and Programs in Biomedicine, 87(3):248-253, 2007.
- M. G. Cinsdikici and D. Aydin. Detection of blood vessels in ophthalmoscope images using MF/ant (matched filter/ant colony) algorithm. Computer methods and programs in biomedicine, 96(2):85-95, 2009.
- Chanwimaluang, Thitiporn, and Guoliang Fan. An efficient blood vessel detection algorithm for retinal images using local entropy thresholding, Circuits and Systems, 2003. ISCAS'03. Proceedings of the 2003 International Symposium on. Vol. 5. IEEE, 2003.
- A. Hoover, V. Kouznetsova, and M. Goldbaum. Locating blood vessels in retinal images by piecewise threshold probing of a matched filter response, IEEE Trans. Med. Imag., vol. 19, pp. 203–210, Mar. 2000.
- B. Zhang, L. Zhang, L. Zhang, F. Karray, Retinal vessel extraction by matched filter with first-order derivative of Gaussian, Computers in Biology and Medicine 40 (2010) 438–445.
- C. Yao, H.-j. Chen, Automated retinal blood vessels segmentation based on simplified PCNN and fast 2D-Otsu algorithm, Journal of Central South University of Technology 16 (2009) 640–646.
- Sofka, Michal, and Charles V. Stewart. Retinal vessel centerline extraction using multiscale matched filters, confidence and edge measures, Medical Imaging, IEEE Transactions on 25.12 (2006): 1531-1546.
- Qin Li, Jane You, and David Zhang. Vessel segmentation and width estimation in retinal images using multiscale production of matched filter responses. Expert Systems with Applications, 39(9):7600-7610, 2012.
- Bob Zhang, Fakhri Karray, Qin Li, Lei Zhang, Sparse Representation Classifier for microaneurysm detection and retinal blood vessel extraction, Information Sciences, 2012, pp. 78–90.
- A. M. Mendon?a and A. Campilho. Segmentation of retinal blood vessels by combining the detection of centerlines and morphological reconstruction, IEEE Trans. Med. Imag., vol. 25, no. 9, pp. 1200–1213, Sep. 2006.
- Amin, M. Ashraful Amin, Hong Yan, High speed detection of retinal blood vessels in fundus image using phase congruency, Soft Comput. (2011) 15:1217–1230.
- Vlachos, Marios, and Evangelos Dermatas. Multi-scale retinal vessel segmentation using line tracking, Computerized Medical Imaging and Graphics34.3 (2010): 213-227.
- C. Sinthanayothin, J. Boyce, H. Cook, and T. Williamson. Automated localization of the optic disc, fovea, and retinal blood vessels from digital colour fundus images, British Journal of Ophthalmology, vol. 83, no. 11, pp. 902–910, 1999.
- J. Staal, M. D. Abràmoff, M. Niemeijer, M. A. Viergever, and B. V. Ginneken. Ridge based vessel segmentation in color images of the retina, IEEE Trans. Med. Imag., vol. 23, no, pp: 501–509, Apr. 2004.
- X. Jiang and D. Mojon. Adaptive local thresholding by verification-based multithreshold probing with application to vessel detection in retinal images, IEEE Transaction on pattern analysis and machine intelligence, Vol. 25, No. 1, January 2003.
- M.M. Fraz, P. Remagnino, A. Hoppe, Sergio Velastin, B. Uyyanonvara and S. A .Barman. A Supervised Method for Retinal Blood Vessel Segmentation Using Line Strength, Multiscale Gabor and Morphological Features, in ICSIPA 2011.
- M.M. Fraz, S.A. Barman, P. Remagnino, A. Hoppe, A. Basit, B. Uyyanonvara, A.R. Rudnicka, C.G. Owen. An approach to localize the retinal blood vessels using bit planes and centerline detection, Computer methods and programs in biomedicine 108.2 (2012): 600-616.
- Diego Marín, Arturo Aquino, Manuel Emilio Gegúndez-Arias, and José Manuel Bravo, A New Supervised Method for Blood Vessel Segmentation in Retinal Images by Using Gray-Level and Moment Invariants-Based Features, IEEE Transactions on Medical Imaging, 2010.
- Orlando, José Ignacio, and Matthew Blaschko. Learning fully-connected CRFs for blood vessel segmentation in retinal images, Medical Image Computing and Computer-Assisted Intervention–MICCAI 2014. Springer International Publishing, 2014. 634-641.
- Giri Babu Kande, T.Satya Savithri, and P.V.Subbaiah, Segmentation of Vessels in Fundus Images using Spatially Weighted Fuzzy c-Means Clustering Algorithm, International Journal of Computer Science and Network Security, VOL.7 No.12, December 2007
- Lam and Yan, A Novel Vessel Segmentation Algorithm for Pathological Retina Images, IEEE Transactions on Medical Imaging, Vol. 27, No. 2, February 2008.
- Saffarzadeh, Vahid Mohammadi, Alireza Osareh, and Bita Shadgar. Vessel segmentation in retinal images using multi-scale line operator and K-means clustering, Journal of medical signals and sensors 4.2 (2014): 122.
- Uyen T.V.Nguyen, Alauddin Bhuiyan, Laurence, A.F.Park, Kotagiri Ramamohanarao, An effective retinal blood vessel segmentation method using multi-scale line detection, Pattern Recognition 46 (2013) 703–715
- Lam, Benson SY, Yongsheng Gao, and AW-C. Liew. General retinal vessel segmentation using regularization-based multiconcavity modelling, Medical Imaging, IEEE Transactions on 29.7 (2010): 1369-1381.
- Ganjee, Razieh, Reza Azmi, and Behrouz Gholizadeh. An Improved Retinal Vessel Segmentation Method Based on High Level Features for Pathological Images, Journal of medical systems 38.9 (2014): 1-9.
- Osareh and Shadgar, Automatic Blood Vessel Segmentation in Color Images of Retina, Iranian Journal of Science & Technology, Transaction B, Engineering, Vol. 33, No. B2, pp 191-206, 2009.
- A. Fathi, A.R. Naghsh-Nilchi , Automatic wavelet-based retinal blood vessels segmentation and vessel diameter estimation, Biomedical Signal Processing and Control 8 (2013) 71– 80
- Imani, Elaheh, Malihe Javidi, and Hamid-Reza Pourreza. Improvement of retinal blood vessel detection using morphological component analysis, Computer methods and programs in biomedicine 118.3 (2015): 263-279.
- Wihandika, Randy Cahya, and Nanik Suciati. Retinal Blood Vessel Segmentation with Optic Disc Pixels Exclusion, International Journal of Image, Graphics and Signal Processing (IJIGSP) 5.7 (2013): 26.
- Sakiko Teramoto, Kyoko Ohno-Matsui, Takashi Tokoro and Seiji Ohno. Bilateral Large Peripapillary Venous and Arterial Loops, Jpn J Ophthalmol 43, pp: 422–425 (1999).
- Franklin, S. Wilfred, and S. Edward Rajan. Computerized screening of diabetic retinopathy employing blood vessel segmentation in retinal images, Biocybernetics and Biomedical Engineering 34.2 (2014): 117-124.
- Keith A. Goatman, Alan D. Fleming, Sam Philip, Graeme J. Williams, John A. Olson, and Peter F. Sharp, Detection of New Vessels on the Optic Disc Using Retinal Photographs, IEEE Transactions on Medical Imaging, Vol. 30, No. 4, April 2011
- Dashtbozorg, Behdad, Ana Maria Mendon?a, and Aurélio Campilho. An automatic graph-based approach for artery/vein classification in retinal images, Image Processing, IEEE Transactions on 23.3 (2014): 1073-1083.
- Qazaleh Mirsharif, Farshad Tajeripour, Hamidreza pourreza. Automated classification of blood vessels as arteries and veins in retinal images, computerized Meical imaging and graphics, 37(2013), pp: 607-617.
- Grisan, Enrico, and Alfredo Ruggeri. A divide et impera strategy for automatic classification of retinal vessels into arteries and veins, Engineering in Medicine and Biology Society, 2003. Proceedings of the 25th Annual International Conference of the IEEE. Vol. 1. IEEE, 2003.
- W. Lotmar, A. Freiburghaus, D. Bracher, Measurement of vessel tortuosity on fundus photographs, GraeJe 's Arch. Clin. Exp. Ophthalmol., VoI.211,pp. 49-57, 1979.
- Heneghan C., Flynn J., Michael O'Keefe and Mark Cahill. Characterization of changes in blood vessel width and tortuosity in retinopathy of prematurity using image analysis, Medical image analysis 6.4 (2002): 407-429.
- Onkaew D, Turior R, Uyyanonvara B, Akinori N, Sinthanayothin C. Automatic retinal vessel tortuosity measurement using curvature of improved chain code. In Proceedings of the International Conference on Electrical, Control and Computer Engineering (In- ECCE 2011), pp 183–6.
- Vinayak Shivkumar Joshi, Michael D. Abramoff. Analysis of retinal vessel networks using quantitative descriptors of vascular morphology, (2012).
- Turior Rashmi, Danu Onkaew, Bunyarit Uyyanonvara, Pornthep Chutinantvarodom. Quantification and classification of retinal vessel tortuosity, Science Asia 39 (2013): 265-277.
- Trucco, Emanuele, Hind Azegrouz, and Baljean Dhillon. Modeling the tortuosity of retinal vessels: does caliber play a role?, Biomedical Engineering, IEEE Transactions on 57.9 (2010): 2239-2247.
- A. Aquino, M.E. Gegundez-Arias, and D. Marin. Detecting the optic disc boundary in digital fundus images using morphological, edge detection and feature extraction techniques, IEEE transactions on medical imaging, 29(10), pp: 1860-1869, 2010
- A. A. H. A. R. Youssif, A. Z. Ghalwash, and A. R. Ghoneim. Optic disc detection from normalized digital fundus images by means of a vessels' direction matched filter, IEEE Trans. Med. Imag., vol. 27, pp: 11–18, 2008
- A. Hoover and M. Goldbaum. Locating the optic nerve in retinal image using the fuzzy convergence of the blood vessels, IEEE Transactions on Medical Imaging, 22(8), pp: 951–958, 2003.
- Mahfouz A, Fahmy AS. Fast localization of the optic disc using projection of image features. IEEE Transactions on Image Processing 2010;19: 3285–9.
- Yu H, Barriga S, Agurto C, Echegaray S, Pattichis M, Zamora G, et al. Fast localization of optic disc and fovea in retinal images for eye disease screening. In: Proceedings of SPIE conference on medical imaging 2011: computer-aided diagnosis. 2011.
- Sinha, Neelam, and R. Venkatesh Babu. Optic disk localization using L1 minimization, Image Processing (ICIP), 2012 19th IEEE International Conference on. IEEE, 2012.
- Chin K S, Trucco E, Tan L and Wilson P J. Automatic fovea location in retinal images using anatomical priors and vessel density, Pattern Recognition Letters 34.10 (2013): 1152-1158.
- R. Philips, J. Forrester, and P. Sharp. Automated detection and quantification of retinal exudates, Graefe's Arch. Clin. Exp. Ophthalmol., vol. 231, pp: 90–94, 1993
- Akara Sopharak, Bunyarit Uyyanonvara and Sarah Barman. Automatic Microaneurysm Detection from Non-dilated Diabetic Retinopathy Retinal Images Using Mathematical Morphology Methods, IAENG International Journal of Computer Science, 38: 3, August 2011.
- C. Sinthanayothin, J. F. Boyce, T. H. Williamson, H. L. Cook, E. Mensah, S. Lal and D. Usher. Automated detection of DR on digital fundus image, Journal of Diabet. Med., 19, pp: 105-112, 2002.
- Walter, T., Klein, J. C., Massin and P., Erginay. A contribution of image processing to the diagnosis of diabetic retinopathy-Detection of exudates in color fundus images of the human retina, IEEE Transactions on Medical Imaging,Volume 21, Issue 10, pp: 1236 – 1243, Oct. 2002.
- Akara Sopharak , Bunyarit Uyyanonvara, Sarah Barman and Tom Williamson. Automatic detection of diabetic retinopathy exudates from non-dilated retinal images using mathematical morphology methods, Journal of Computerized Medical Imaging and Graphics, pp: 720 – 727, 2008.
- Ahmed wasif Reza, C. Eswaran and Kaharudin Dimyati, Diagnosis of Diabetic Retinopathy: Automatic Extraction of optic disc and exudates from retinal images using marker controlled watershed transformation, Springer, J Med. Syst., 2011, Vol. 35, pp. 1491-1501.
- L. Giancardo, F. Meriaudeau, T. P. Karnowski, Y. Li, K. W. Tobin and E. Chaum, Automatic retina exudates segmentation without a manually labeling training set, In Proc. of IEEE International Symposium on Biomedical Imaging, 2011.
- S. T. Lim, W. M. D. W. Zaki, A. Hussain, S. L. Lim and S. Kusalavan. Automatic Classification of Diabetic Macular Edema in Digital Fundus Images, In CHUSER 2011, Dec, Penag, 2011.
- A. Osareh, M. Mirmehdi, B. Thomas and Richard Markham. Automatic recognition of exudative maculopathy using fuzzy c - means clustering and neural networks, Proceedings of Medical Image Understanding and Analysis, UK, pp: 49–52, July 2001.
- M. Niemeijer, B. van Ginneken, S R Russell, M. S. Suttorp-Schulten and M. D. Abràmoff. Automated detection and differentiation of drusen, exudates, and cotton-wool spots in digital color fundus photographs for diabetic retinopathy diagnosis, Invest. Ophthalmol. Vis. Sci., Vol. 48, pp: 2260-7, May 2007.
- Guoliang Fang. Nan Yang, Huchuan Lu and Kaisong Li. Automatic segmentation of hard exudates in fundus images based boosted soft segmentation, in proc. Int. conference on intelligent control and information processing, pp: 633-638, August 2010.
- Akara Sopharak, Mathew N dailey, Bunyarit Uyyanonvara, Sarah Barman, Tom Williamson and Yin Aye Moe. Machine learning approach to automatic exudate detection in retinal image from diabetic patients, Journal of Modern optics, Vol. 57, No.2, pp: 124 – 135, Nov 2011.
- C. I. Sánchez, María García, Agustín Mayo, María I. López and Roberto Hornero. Retinal image analysis based on mixture models to detect hard exudate, Medical Image Analysis, Vol. 13, pp: 650–658, 2009.
- M. Garcia, C. I. Sanchez, M.I. Lopez, D. Abasolo and R. Hornero. Neural network based detection of hard exudates in retinal images, Computer methods and Programs in Biomedicine, vol. 93, pp. 9-19, 2009.
- Sopharak, A, Nwe, K. T, Moe, Y. A, Dailey, M. N and Uyyanonvara B. Automatic exudate detection with a naive Bayes classifier, In International Conference on Embedded Systems and Intelligent Technology, pp: 139–142, 2008.
- Osareh A., Shadgar B. and Markham R. A Computational-Intelligence-Based Approach for Detection of exudates in Diabetic Retinopathy Images, IEEE transaction on Information Technology in biomedicine, Volume 13, Issue 4, pp: 535 – 545, July 2009
- G. Gardner, D. Keating, T. Williamson, and A. Elliot, Detection of diabetic retinopathy using neural network analysis of fundus images, British Journal of Ophthalmology, vol. 80, no. 11, pp: 937–948, 1996.
- Akara Sopharak, Bunyarit Uyyanonvara and Sarah Barman. Fine Microaneurysm Detection from Non-dilated Diabetic Retinopathy Retinal Images Using a Hybrid Approach, Proceedings of the World Congress on Engineering, Vol II, 2012.
- Lee Streeter and Michael J. Cree. Microaneurysms detection in colour fundus images, Image and Vision Computing, 280 - 284, Nov-2003.
- Gwénolé Quellec, Mathieu Lamard, Pierre Marie Josselin, Guy Cazuguel, Béatrice Cochener, and Christian Roux. Optimal wavelet transform for the detection of microaneurysms in retina photographs, Medical Imaging, IEEE Transactions on 27.9 (2008): 1230-1241.
- Zhang, X., Thibault G., Decenciere, E., Lay B., Danno, R., Ali Ergginay. Exudate detection in color retinal images for mass screening of diabetic retinopathy, Medical image analysis 18.7 (2014): 1026-1043.
- Harangi, Balazs, and Andras Hajdu. Automatic exudate detection by fusing multiple active contours and regionwise classification, Computers in biology and medicine 54 (2014): 156-171.
- Handayani Tjandrasa, Isye Arieshanti, Radityo Anggoro. Classification of non-proliferative diabetic retinopathy based on segmented exudates using K-Means clustering, I.J. Image, Graphics and Signal Processing 1 (2015): 1-8.
- Amel, Feroui, Messadi Mohammed and Bessaid Abdelhafid, Improvement of the hard exudates detection method used for computer- aided diagnosis of diabetic retinopathy, I.J. Image, Graphics and Signal Processing 4.4 (2012): 19-27.
