A review on student attrition in higher education using big data analytics and data mining techniques

Author: Syaidatus Syahira Ahmad Tarmizi, Sofianita Mutalib, Nurzeatul Hamimah Abdul Hamid, Shuzlina Abdul Rahman
Journal: International Journal of Modern Education and Computer Science @ijmecs
Article in issue: 8 vol.11, 2019.
Free access
Student attrition among undergraduate students is among the most concerned issues in higher educational institutions in Malaysia and abroad. This problem arises when these students unable to complete their studies within the stipulated period when there are majoring in the Science, Technology, Engineering, and Mathematics (STEM) fields. Research findings highlight numerous factors contribute to the student attrition. These findings also suggest that the factors differ from one case to another case. Effects of student attrition not only for the student itself but also to the institutions and community. It is challenging to classify the factors based on general assumptions. Moreover, increasing students’ information makes the problem more complicated. This student information can provide a useful database for analytical analysis. Methods such as big data analytics and data mining techniques can be deployed to gain insights and pattern that related to student attrition problem. The objective of this paper (i) review the student attrition in higher education (HE) and the contributing factors; and (ii) review the existing computational model to analyze and predict student attrition in HE.
Student attrition, higher education, big data analytics, data mining
Short address: https://sciup.org/15016868
IDR: 15016868 | DOI: 10.5815/ijmecs.2019.08.01
Text of the scientific article A review on student attrition in higher education using big data analytics and data mining techniques
Published Online August 2019 in MECS DOI: 10.5815/ijmecs.2019.08.01
Education has an important role in our life because with proper education we can gain knowledge, skills, and competitiveness between each other. Aims of Malaysia government is to transform Malaysia’s higher education (HE) to meet new challenges at the same time to produce next generation of leaders and managers with the quality of leadership skills [1]. One of the transformations of Malaysia’s HE is to prepare Malaysian people especially graduate students with a professional career that focusing on science, technology, engineering and mathematics
(STEM) fields. It because Malaysia needs to produce at least 5000 of STEM graduate students annually to make Malaysia is known as one of the top 20 countries of the world in economic, social development and innovation [2]. However, to get a sufficient number of graduates in STEM fields might be possible when the interest of students in secondary school toward STEM subjects is decline. This scenario also occurs in tertiary education but in the different aspect which is attrition problem among undergraduate students who enrolled in the STEM fields in both public and private institutions in HE [3].
Attrition problem is an ongoing challenge and among most concerned issues in higher educational institutions (HEIs) because this situation also occurring in abroad besides Malaysia. In Malaysia, there are 17.5% of students who attrition during their studies in the HEIs [4]. Even the number of student attrition is in the smallest percentage but it could affect the number of students to graduate on time as well as for the institutions to allocate the resources for their students to study. However, there are positive reasons behind that for students to leave their course for a better outcome [5]. It because these particular of students stills can get benefits from skills that had been developed when participated in the course even in the first semester enrollment of study. Institutions in HE are dealing with the increase of students’ information in their daily operation. Based on this situation, a suitable analytical analysis can be used as a guideline to support decision making. This analytical analysis can help for the process of analyzing become easier and meaningful pattern can be found through mine information from the institutions' database.
Research on data mining especially in educational fields has been proposed by many researchers. Educational data mining (EDM) is one of the popular data mining techniques used for discovering the hidden knowledge from the educational systems [6]. It was the alternative for traditional measures of student attrition that ignored the students who are postponing their study and return in next semester or students who continue their studies but transferring to another institution [5]. Besides, the effectiveness of the teaching and learning process, the quality issues toward to student selection and admission process also are not included in the traditional measures. Study in EDM shows an early identification profile of students which has a tendency to attrition can be done and number of the student attrition in HE can be reduced. It important for HEIs in order to help them to conduct research in improving the quality of education to assist the high-risk students, giving good services and to help HEIs to increase the revenue by increasing the number of students to graduate annually.
The main purpose of this paper is to review the student attrition in HE, the contributing factors to attrition and the existing computational model to analyze and predict student attrition in HE. The remainder of the paper is organizing as follows: section 2 discusses an overview of HEIs in Malaysia. Section 3 gives a brief on student attrition can be defined and factors that can contribute to the reason for attrition in HE. In section 4, big data analytics is described and the category of analytics used to analyze the data is presented. Section 5, data mining is explained by defining data mining techniques, categories of data mining, application of data mining in the educational sector and tools used for mining the data. Section 6, discussed supervised data mining to validate the results for attrition datasets. Finally, section 7 draws a conclusion about the study.
-
II. Overview Of Higher Educational Institutions In Malaysia
The educational system in Malaysia has been through a transformation over a decade. Factors that contributed to the transformations of HEIs are globalization, internationalization and world university ranking [7]. Globalization had influenced the HEIs with the growth of the Malaysia economy to compete in the global market. Then, internalization is the collaboration between Malaysia and international institutions in international research collaboration, distance learning, and joint program. The aim of this collaboration is to realize the Malaysia government for making Malaysia as a regional education hub. Malaysia institutions also involved in the world university ranking such as QS World University Rankings and the Times Higher Education World University Rankings [1]. The university ranking is the international measure of quality based on the outcome that has been achieved by institutions, especially through research and innovations.
In Malaysia, there are two categories of institutions in the HE sector which are private and public. However, most of the institution in Malaysia is private sector because it can be seen that there are 410 private colleges, 70 private universities and 34 private university colleges compare to public institute that comprises of 20 public universities, 94 community colleges and 34 polytechnics [1]. Ministry of Higher Education (MoHE) has established the Malaysian Qualifications Agency (MQA)
with a responsibility to controls institutional accreditation status in both institutions. It helps to maintain the HE standards, lead, develop and extend the boundaries of quality assurance in Malaysian institutions [8]. Malaysian institutions could have their own different academic policies and practices on how to meet the academic trends, choose qualified educators, enhance the quality of education and to survival in the competitive world [9]. Besides, Academic Quality Assurance (AQA) also had been introduced in HE [10]. There have five components of quality assurance in which it consists of program for monitoring and review, curriculum design, curriculum delivery, assessment, and continuous quality improvement.
Malaysia Government has been the main financial provider in the educational sector especially for HE. However, there is a problem with the limitation on resources mostly in finance due to the increase in demand for the management of institutions and budget for sponsored students who are studying abroad [11]. The government had taking initiative and working on restructuring strategies under the University Transformation Programme (UniTP) to enhance the educational system and Economic Transformation Programme (ETP) to raise Malaysia income especially in the educational sector such as encourage the foreign students to choose Malaysia as a destination to further their studies. Sijil Pelajaran Malaysia (SPM) is one of the minimum qualifications for Malaysian students for academic school qualifications. Most of them are more careful in choosing their institutions to further studies in tertiary education. They believed that when they are graduates from a reputable university, the chance for them to get hired easily compare to others and it can guarantee them to obtain well-paid jobs based on the specialization they have during their studies. Additionally, the distance from the location of the institution to study from home, courses offering to them, facilities that were provided and costs that will be used to pay for their study also can influence them to make a decision. These problems also can lead to the attrition in HE becomes a serious problem because of their negative perception towards the HEIs.
-
III. Student Attrition In Higher Education
Students can be defined as attrition when those person is withdrawing from course by canceling their programmed, fail to continue in the next semester, accepting the offer but do not register or enroll the program, failed to attend classes and failed in the examination for multiple times [12,13]. Discontinuation of study cycle by student attrition can be considered as complex social components because it can give negative impacts towards academic, economic and social [14]. Student attrition can be identified when there is reducing the number of students who enrolled in courses per semester. It could be unpredictable challenges for institutions because the attrition issues for this year may not the same as the next year.
The attrition can be categorized into three modes such as voluntary attrition, incurred attrition and potential attrition [15]. Voluntary attrition is when students are no longer want to continue their study within a study plan. Incurred attrition is when students are trying to breaches the rules and regulation that had been set up by the institution. Next, potential attrition is high risk students who have a possibility to attrite when they are longer be able to perform any academic process for the current and next semester of their studies [16]. Attrition students also have the possibility to return to the same institution but with a different mode of study from full time to part time students and enroll the same courses or to switch to other courses. [17], defined the groups of student attrition that are low risk students, medium risk students and high risk students. Low risk students are students who have a high possibility of success in their study. Medium risk students are students who could succeed due to the initiative that had been taken by HEIs and high risk students, who have a high probability of attrition or failing.

Fig.1. Student’s Academic Process
Figure 1 shows the student’s academic process in HE. It has four process includes pre-enrolment, enrolment, insemester and end of the semester. First, pre-enrollment is a process where it focusing on the student’s information before they enrolment in any undergraduate program. [14] stated that before candidate entered HEIs, there are certain institutions that may require the candidates to come for the interview first. During this session, institutions will evaluate the knowledge and performance of the candidate that was acquired during high schools. The potential candidate who had been selected could be offered to study in institutions suitable to their major. Second, in the enrolment process, student’s information such as mode of study, fields of study, credit hours and etc. would be collected. Third, in-semester is the process for identifying the students who are taking at least one course during that semester and students participating in the learning process such as accessing the materials of study and submitting the assessment [18]. Lastly, the end of the semester is the process to measure the academic performance of students at the end of the semester in the form of student’s grade. From these results, educators or institutions can identify who is possible at risk students that need helps in their study in order to ensure they are able to complete their study based on study plans. Next section is to describe the factors of student attrition.
-
A. Factors of Student Attrition
Several studies on attrition issues in Malaysia and abroad had provided the factors of attrition that may influence the student to attrite in HE. These researches had been collected from trusted sources such as Google Scholar, IEEE Xplore digital library and Science Direct. Reasons for attrition among undergraduate students from one person to another could be different because every student had their own personal reasons for them to make the right decision.
■Age
■ Grade in high school
■ Program code
■ Admission type
■ Family income
■ Parents' education
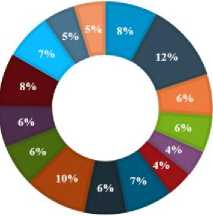
Fig.2. Factors of student attrition
-
■ Gender
-
■ City (address)
-
■ Marital status
-
■ .lob status
-
■ Study mode
-
■ GPA
-
■ Parents' occupation
Figure 2 shows the factors of student attrition that had been collected from 25 different research articles in years from range 2014 to 2018. These data collections contain information includes students’ information, academic information and family information. After reviewing the article, there are 28 different attributes that had been identified are reduced into 15 main attributes. From the pie charts, we can see that the highest percentage of the attribute is 12% for gender. The second highest is 10% for program code which is the major of student enrollment and the third highest 8% for age and Grade Point Average (GPA). The fourth highest is 7% for family income and loan which is additional financial support for students. Then, another 6% for race that presents the major or minor populations of ethnicity in Malaysia, city where location from student’s home and university, job status to identify students who are working or not, mode of study whether in full time or part time students, and admission type which is the qualification for student to further their study. Remaining of the percentage is 5% for parents’ education and parents’ occupations and remaining 4% for a grade in high school and marital status.
Besides that, there are other factors that had been identified could result to attrition which is due to the ability of student to study, failed to maintain academic performance and adaptation to the course enrolled, lack of appropriate qualification for the course, professional opportunities and the course offered may not suitable with their capabilities [19,20]. Personal reasons such as poor self-esteem, depression, dissatisfactions with course enrolled or institution, felt isolated likes does not have a sense of belonging, lack of social support and health problems also can be the reason to attrition [21,22]. Transfer to another institution because that institution is more suitable with the student career path or it was the student’s choice but turned out to be the best fit based on student qualification [4,5]. Financial reason like an inability to pay fees in time also might encourage a student to transfer to the institution with non-subsidized to a public or private subsidy. Employment issues may be the main reason for a part-time student who gets promotion from their company that needs them to transfer to another location or country. It same goes to a full-time student primarily working as part-time during studies to fund their studies and monthly expenses. It because when they are working with many hours or multiple jobs at one time, it could affect their studies and they becoming stress [23].
The online course can lead to the increasing number of attrition because they cannot cope with the lecturers taught and more prefer traditional lesson face to face interaction on the university [24]. It is difficult to ensure them being active and engaged with their online course all the time. In addition, there are some of the lecturers were still unable to integrate the technology in their teaching that may cause the learners are failed to understand the information have been given [25]. Then, lack of support from family to continue the study and family issues especially for those who are married, pregnancy and away from their family members. Another factor is when students were not ready for studying in HE [26]. They did not realize that they are actually unprepared but it can be identified when they are unable to learn independently, lack of time management and experience in HE including campus life activities, assessment and method of teaching that much different from their previous high school.
As a result, the rate of student attrition could be damaging the reputation level and financial of the HEIs because this is a key performance on how the institution will arrange the funding for their enrolled and graduate students [19]. [27] stated that this attrition issues could waste of taxpayers’ money that was used to sponsor their studies and at the same time it can lower the employment opportunity for qualifying positions. This issues could affect the students because if they are unable to earn a diploma or degree in the undergraduate program it could be a barrier for them to improve their economic status [4]. Based on the discussed factors, it shows that the attrition becomes a difficult problem and the factors might be vast. With the advance of big data analytics and data mining technology, it is expected that attrition can be analyzed better and it can help these institutions to solve their problem with better decision making.
-
IV. Big Data Analytics
Big data analytics (BDA) is a new method that was used to overcome the traditional method of big data for the process of collecting data and to process it to be meaningful ways with advanced analytic techniques [28]. Advanced analytics techniques are required for the realtime data that too complex and need to keep updated all the time. This analysis is incorporating with data science, business intelligence and business analytics. A term for BDA is coming from the extraction of knowledge and understanding in big data [29,30]. Determined the definition of BDA by a question “why” rather than “what”. The similarity of BDA and big data is the capability to collect and process variations of structured, semi-structured or unstructured data in real time for analytics task [31,32].
Big data analytics is not only used to find the unseen facts but it can rank or classify the data based on how important the information it is [30,33]. This analysis is important for business purpose and society to get better results with smart decision making for solving inaccurate data analysis as well as to reduce risk and cost. The main concerns that need to be considered while implementing of BDA for the business are interoperability, reusability, manageability, security and maturity [34]. BDA could lead to innovation in education especially in HE because it can help this institution to transform the existing process such as administration, academic work, teaching and learning process to be more effective. In BDA, there are three categories of analytics that had been identified including descriptive, predictive and prescriptive analytics. Every each of these analytics has its own advantages and related to each other. This type of analytics is represented in Table 1.
Table 1. Category of big data analytics
|
Descriptive Analytics |
Predictive Analytics |
Prescriptive Analytics |
|
|
Purpose |
Understand the real situation and take the opportunity |
Getting to know about the future |
Provide advice to the user on what decision can make |
|
Question |
What happen in the past? |
What will happen in the future? |
How to respond towards the future events? |
|
Techniques |
Data aggregation and data mining |
Statistical models, data mining, machine learning |
Simulation, optimization and evaluation |
|
Type of data |
Structured data with table format |
Structured or unstructured data |
Unstructured data with unstructured format |
A. Descriptive Analytics
Descriptive analytics also is known as diagnostic analytics which is used to analyze and answer on what happened in past and present and why it is happening whether it was success or failure in easily understandable form by using visualization tools and online analytical processing (OLAP) system to support real-time information [28,35]. These analytics has advantages including to view the data in the real world context, identify relevant information from the data, produces the quality of data and recognize the assumptions or limitation of the findings. A statistical descriptive approach can be used in this analytics are univariate, bivariate or multivariate analysis [36]. Descriptive analytics begins with a static view of the past but when the data are increasing in data sources, some algorithms can be applied when performs data classification, clustering and categorization time by time. It only can use for another step of analytics which is predictive analytics when all the data is almost analyzed.
-
B. Predictive Analytics
Predictive analytics has the capability to construct and evaluate a model with a goal to generate an accurate prediction for new observation on what environment can do in the future by looking for historical or past and current data as input or training set and then to analyze the relationship between them [32,37]. However, to predict the outcome with 100% certainty could be impossible by using statistical algorithms [28]. Predictive analytics also a task to predict the value of the dependent attribute from the value of the independent attribute [38]. The basis for this analytics is based on probability. There are various techniques such statistical models, machine learning, data mining and data modeling can be implemented by organizations to discover the pattern and its relations in data for forecasting and as a weapon for a business competitive race [35,36].
-
C. Prescriptive Analytics
Prescriptive analytics is used for forecasting but focuses on impact in future actions before responding to the outcome about what might happen with the organization’s action based on consideration of descriptive and predictive analytics to make it more efficient [28,35]. It one of the most complex and advanced forms of analytics compare to another. There are three main components of prescriptive analytics such as simulation, optimization and evaluation [39]. The process begins with simulation components where all possible scenarios from predictive analytics were processed to produce a list of actionable recommendations. Then, the optimization unit will retrieve and select the optimized scenarios and sent them to the evaluation unit to validate the results with the best solutions in term of action sequences. These analytics will recommend or guidance the organization by provides them with automated, adaptive and time-dependent sequences of actions. The characteristics of the prescriptive analytic are it can provide the enterprise with actionable outcomes and gives feedback like a suggestion about the occurrence events in systems lifetime.
From the description of these three analytics methods, it can be used for constructed to produce the descriptive, predictive or prescriptive analysis. The techniques for each of analytics can be adapted for data mining. Next section describes data mining in details.
V. Data Mining
Data mining is known as Knowledge Discovery in Databases (KDD) that were used for discovering new and useful information from various kind of databases includes relational, transactional, spatial and active databases [40,41]. Data mining is better to compare to statistical methods due to the huge size of data and difficulty to process large datasets [42]. The iterative process including in knowledge discovery including data cleaning, data integration, data selection, data transformation, data mining, pattern evaluation and knowledge representation [43]. However, there is a certain process such as data cleansing and data integration can combine together to become data preprocessing phase in a data warehouse. Then, data selection and data transformation also can be combined where transformed data as the result of the selection process.
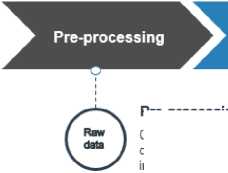
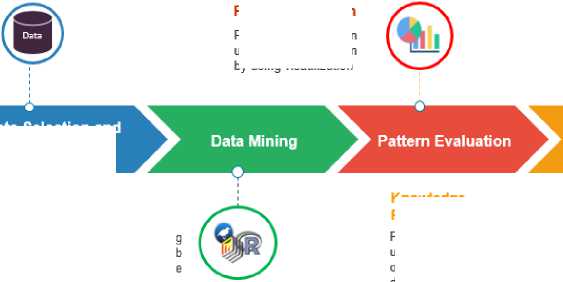
Figure 3 shows the process included in the knowledge discovery process. In pre-processing steps, raw data in any file formats will be processed through data cleansing. So, incomplete or missing data will be eliminated and combined together under the integration process. After data had been selected and transformed into structured formats in forms databases it then undergoes to the data mining steps where the selected algorithms with suitable tools will be used for mining the data. Pattern evaluation is the steps to present the data into the understandable form of visualization representation. The last step is knowledge representation. After the transformation of data into valuable knowledge, it will be used for that particular organizations for having a better understanding of the business process to support decision making.
Selected suitable method to mining the data and transform it.
Pre-processing
Combination of data cleaning and data integration
Pattern Evaluation
Present data in understandable form by using visualization
Data selection and Transformation
Data Selection and
Transformation
Knowledge Representation
Present knowledge for better understanding of business operation to make smart decision making
Data Mining
Mining data by usinc open source wet application or software data mining tool
Fig.3. Knowledge Discovery Process
'ЧУ'
Knowledge Representation

Data mining can be used for multi purposes such as descriptive, predictive and prescriptive analytics [43,44]. Descriptive analytics referred as unsupervised data mining is used data in a database to finds patterns and to present it to the user whereas predictive analytics referred as supervised data mining is used to produce inference from student database to make a prediction in the future. Prescriptive analytics is referring to the combination of data mining techniques with aims to optimize the data to achieve the best outcomes. Data mining only can make inferences from complete datasets. Therefore, data mining with data cleansing process has the capability to manage incomplete, correct inconsistent or remove noise replace the missing values of the attribute before running the data mining algorithm [45,46]. Problem with missing values for one or more could happen because of incorrect measurement, lost and human errors. This technique can produce various kind of pattern based on the expectation of the user. It becoming more interesting when patterns are in the form that easily understandable by human, useful and novel.
Data-driven decision making in data mining can be categorized as supervised, semi-supervised and unsupervised data mining [37,47]. Training dataset that will be used depends on the category of data mining [48].
It because supervised data mining will use a dataset that has labeled data, semi-supervised uses a dataset with both labeled and unlabeled data and unsupervised works with unlabeled data [43]. Supervised data mining consists of classification and regression technique. Semi-supervised data mining is hybrid techniques by combining supervised and unsupervised data mining with a goal to utilize both of them [49]. Then, unsupervised data mining consists of clustering and association technique. Performance of the classifier in this data mining techniques can be improved by using the instance in Instance-based learning [44]. Figure 4 presents the taxonomy of data mining techniques that consists of supervised, semi-supervised and unsupervised data mining.
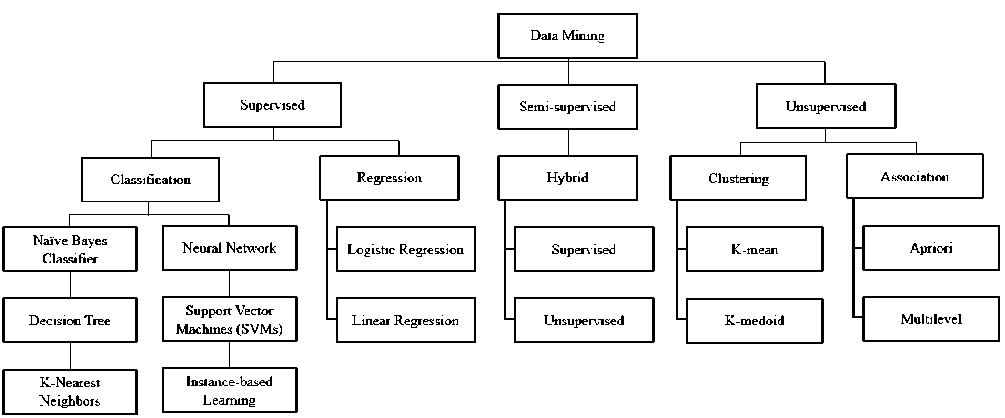
Fig.4. Taxonomy of data mining techniques
-
A. Supervised Data Mining
Supervised data mining is used when users have specific labeled data that needs to predict [50]. It like machine learning algorithms where it needs supervision on how to learns from example. Supervised is a process to find concept descriptions for classes with a preclassified example. In supervised data mining, it has two algorithms which are classification and regression. Classification is supervised data mining algorithms that mostly used for a process of classifying and predicting values from training dataset based on previous learned classes to build a model that can be used to classify new values [41]. A successful rate for these algorithms depends on how this variety of data is provided. There are many classifiers in classification algorithms that can produce the accurate results such as Naïve Bayes (NB), K -Nearest Neighbors (KNN), Decision Tree (DT), neural network (NN), Support Vector Machines (SVMs) and instance-based learning.
Naïve Bayes is a Bayesian network algorithm. This algorithm is a conditional probabilistic classifier technique based on Bayesian rule or Bayesian theorem where all the attributes in a dataset are independent of one another [51,52]. K-Nearest Neighbors classifier can be categorized as instance-based learning or lazy learning [51,53]. This classifier is used to utilize both classification and regression data mining technique in real time. KNN used to find the nearest group of k instances in training set with the instance in the new dataset or training set [46,54].. Problem with KNN is when dealing with a large size of data where there is a lot of calculation process need to perform [55]. A neural network is a computational or mathematical model that used to model the relationship between input and output to finds patterns in a dataset [56,57]. A NN also a model that used to simulate the functionalities of biological neural networks. The main idea of these networks is to create new structures to process data and information to learn and create a knowledge [58]. Support Vector Machines classifier is based on the statistical learning theory in which with the goals to achieve the structural risk minimization. Mainly there are two class labels such as +1 and -1 values. An SVM estimates the optimal separating hyperplane by maximizing the margin between hyper-plane and closest points of the classes [59]. SVM is a universal classifier that use of an appropriate kernel function to learn the polynomial and radial basic function (RBF) networks [22].
A decision tree is a top-down tree model from given dataset attributes [52,60]. The structures of the tree that have internal node, branch node and leaf node. The internal node denotes a test to the attribute, the branch node is the result of the test and the leaf node holds labeled class [38,43]. A decision tree is one the fastest classifier and there is no calculation that needs to perform [55]. There are four DT algorithms such as C4.5 DT, Iterative Dichotomiser 3 (ID3), Classification and Regression Tree (CART), Chi-squared Automatic Interaction Detection (CHAID) and Random Forest (RF). A decision tree is mostly used because it can provide a straightforward explanation [61]. Instance-based learning processes by using instances to improve the performance of the classifier [44]. This learning can either be single instance based learners or multi-instance based learners. Supervised data mining can be considered as single instance based and unsupervised data mining is considering as multi-instance based learners.
Regression is used to predict the same range of input from the training model by using statistical analysis. It can be categorized as linear regression and non-linear regression. Linear regression is a classical method that also known as superior analytics because of ease of interpretation [59,62]. Regression requires tedious, iterative model building and selection procedure to ensure the transformation is made on predictors and their interaction. The classifier for regression is logistic regression and it was used to make a prediction on the outcome of predictor variables and to measure the correlation between the categorical variable and dependent variable to change the probability score [57,63]. Probability score can be considered a success when the value is greater than a given numerical cutoff but it can be considered a failure when the value is lower than a given numerical cutoff [48].
-
B. Semi-supervised Data Mining
Semi-supervised data mining is a technique for finding a better classifier by learning from the labeled training dataset and exploit the structural information in available unlabeled data. It has a different type of methods such as self-training, co-training, transductive support vector machine (TSVMs) and graph-based method [48]. For self-training, the classifier must be able to produce the correct output before instances can be classified. TSVMs is used both labeled and unlabeled data training phase to search reliable separate hyperplane. The graph-based method consists of nodes and edges to model dataset as a graph. Nodes are represented as labeled and unlabeled datasets and the edge is used to define the similarity between points. Semi-supervised data mining is useful when there is a limited amount of labeled data exists for each class. The process for semi-supervised only can be valid when unlabeled data can assume an intrinsic geometric structure [64]. However, a problem with semisupervised is unlabeled data that were used is unknown, so it could difficult to estimate the overall error rate.
-
C. Unsupervised Data Mining
Unsupervised data mining does not have any training example at all and depends on a number of prior assumptions. It has two algorithms which are clustering and association. Clustering is based on the concept of hidden data that used to examine the information to identify clusters by use common attribute from the same or different classification whether it has a similarity or not at all [65]. It based on the principle where maximizing the similarity between attributes in the same classification is called as an intra-class similarity and for minimizing the similarity between attributes in different classification is called as inter-class similarity. Clustering can be classified as hard clustering and soft clustering [66,67]. Hard clustering is each data belonging of one cluster and soft clustering is each data is belonging by multiple clusters. Clustering can group data together to form a structure opinion [41]. Traditional clustering can be divided into hierarchical and partitioning [68]. Hierarchical clustering is clusters that have a hierarchy between them. Partitioned clustering refers to data that partitioned into a separate cluster.
Association used two or more items that usually have the same type dataset used to identify the patterns. Apriori which is association algorithm is used to find relations between two or more entities in certain data environment such as mathematics and database [72,73]. Association using the support and confidence parameter to allow the association rule can be recognized. A single level association rule only has one threshold for support and confidence [29]. So, with the multilevel association rule, there will be many support and confidence threshold as there are levels of abstraction except level 0. In this multilevel, support and confidence are called as minimum support and minimum confidence like the concept of hierarchy [59].
-
D. Educational Data Mining
Application of Data mining had widely used in various fields includes education, medical, business, insurance, telecommunication and many more. Most of these fields used data mining techniques in order to help their business grow and gain competitive advantage. However, it depends on them for what purpose data mining will be used. There are many organizations are combining data mining with statistical analysis to find the patterns and connections that was difficult for them to find from their business operation to make smart decision making to enhance the services provided for their customer. Here, in this paper, it will be focusing on data mining in the educational sector which known as educational data mining (EDM).
Educational data mining is a new technique in data mining, machine learning and KDD to extract the meaning from data or on students learning activities for gains useful information in the educational environment [40,65]. In this case, EDM can assist stakeholders in HEIs by helping educators to improve the performance of teaching to help students to have better understanding on what they have learned and to make prediction on their student’s performances throughout of semester with the hope the attrition problem can be solved, researchers for better understanding of educational structures and for administrators to organize the institutions and making decisions [74,75].
Educational Data Mining can be used to identify what are the factors that could affect the student’s success when enrolling in HEIs and to determine the relationship between academic success and student participant in extracurricular activities [76]. EDM has four phases of the process [6]. The first phase of EDM is where the statistical techniques in supervised, semi-supervised or unsupervised data mining are used to discover the relationships between data. The second phase is to validate the relationships of data. In the third phase, the validated relationship is used for predictions in future learning contexts and in the last phase, that predictions will be used to support the decision making with the purpose to improve student outcomes and to reduce the rate of attrition among undergraduate students.
-
E. Data Mining Tools
Data mining tools are could be an open source web application or software that used to conduct the traditional or modern statistical analyses for big data. A process to transform raw data into meaningful ways is becoming a major challenge for organization especially for HE to ensures the available data is accurate and able to support for decision making. Although these tools can support any data mining technique for data analysis, it still has a few limitations on how these tools represent the results. There are certain tools require additional libraries to be installed together before tools can be functioning effectively. Modeling dataset can be in any form of databases structure or files format and then use to validate the results. In this paper, Table II is used to present and compare the features of data mining tools. Explanation in details of data mining tools is discussed in the next section.
-
1) Waikato Environment for Knowledge Analysis (WEKA)
Weka is Java-based free software had been developed at the University of Waikato in New Zealand. Weka has data mining algorithms includes supervised and unsupervised that can be used in isolation or combination such as bagging, boosting and stacking where can be applied to data or use for another java application [41,77]. There four option of Weka for data mining including Command Line Interface (CLI), Explorer, Experimenter, Workbench and knowledge flow [21,77]. CLI has a simple interface with a function to execute the command and explorer is a graphical interface to perform the data mining task. The experimenter used to make a distinction on the results from the different algorithm on the same dataset. Workbench has the capability to combine all GUI interface in WEKA into one. Then, knowledge flow processes were used to enhance the previous results. Weka can support evaluation procedures and metrics, but the problem is a lack of data visualization techniques. Output for Weka is in terms of the mathematical models or in predictive modeling markup language (PMML) files that can be used to run new dataset.
-
2) Rapid Miner
Rapid Miner is a Java-based open source tool for predictive analysis and creating models [41,78]. Now, Rapid Miner is known as Rapid Miner Studio and it can be used for supervised and unsupervised data mining algorithms. The installer is easy to run on Windows compare to Mac OS because it depends on the Java version installing by users. It used the Batch Cross Validation operator to conduct cross-validation for multiple levels such as for student level and lesson level [77]. It focused on a process that may contain sub-process. Rapid Miner can make real-time data becomes valuable and allow users to structure the data in visualization form. The process can be done based on the specific goal that determines by the user. It used to drag and drop operations and then to connect both input and output that corresponding to that operator. The output for Rapid Miner can be in term of the mathematical models or XML files format that will be used to run new data by using Rapid Miner code. The tasks that cannot be done in rapid miner can be performed through a programming application program interface (API) that integrated into a program written in Java or Python. However, it consumes a lot of random access memory (RAM) that cause user computer not work very well and a vast amount of data can produce an error.
-
3) Orange
Orange is a Python-based software for data mining that easier to understand by the users. This software can be used through Python scripting as a Python plug-in or visual programming [78]. The Orange library is like a hierarchically organized toolbox. Before can have API functionality, the additional libraries need to be downloaded. Orange is based on the classical machine learning technique that focuses on symbolic methods. A data structure in orange combine string and numerical attributes, symbolic and metadata information. This tool has a variety of visualization and toolbox that more than 100 widgets [41]. Widgets in Orange can categories as data, visualize, classify, regression, evaluate and association. Programming is performing by including widgets on the Orange canvas and connecting both of input and output together. This software can run a variety of statistical test and produces the results in the form of charts and graphs. However, Orange can work with the limited scale of data compare to Excel [77]. Orange is better tool especially for beginners and for smaller projects.
-
4) Tableau
A tableau is an interactive tool used visualization and analyzing the data [77]. It can support business intelligence and educational purpose to analyze student data and enhance the teaching process. The user of tableau did not need to have any programming skills to analyze the huge amount of data from various resources for the visualization process. Tableau does not implement any data mining algorithms but it can support any file format to connect or import data for data storing. Tableau is low-cost software, use less of the capacity of memory and easy to upgrade [79]. This tools can be used in web and mobile devices. However, the problem with Tableau is it does not support predictive analytics or relational data mining and also cannot integrates with other software platforms.
-
5) R programming
R programming is a scripting language same like a programming language. Open source tool with GNU package for data mining tasks specifically for statistical analysis to manage big data. The source code is written in C++, Fortran and R programming language. A tool that has a simple GUI and command line shell as input [78]. Not user-friendly tool due to command that will be used must be in R language. There is no restriction for R license [79]. Users can run the R tool at any platform includes UNIX, Windows and Mac OS. However, users must have knowledge on how to write the R source code to allow them to use this tool effectively. Having the perfect results could be impossible because it depends on the available package supported in R language. Most of the R commands have a problem in term of memory management because when users want to write the command is supposed to be not larger than 10 to 20 of RAM [31]. If more than that they will need any available memory quickly to performs the task.
Table 2. Category of big data analytics
|
Feature |
Developer |
Programming Language |
GUI or command line |
Main purpose |
Advantage |
Disadvantage |
|
WEKA |
University of Waikato, New Zealand |
Java |
Both |
Supervised and unsupervised data mining |
Read files from numerous different database |
Does not support much visualization |
|
Rapid Miner |
Rapid Miner, Germany |
Java |
GUI |
Supervised and unsupervised data mining |
Offers numerous procedures for selection of attribute and outlier detection. |
Consume lots of RAM user computer, a large amount of data can produce an error |
|
Orange |
University of Ljubljana, Slovenia |
Python |
Both |
Supervised and unsupervised data mining |
Used for data visualization with mining technique. |
Working with a limited scale of data, additional libraries need to download |
|
Tableau |
Software company, Seattle, Washington, United States |
No |
GUI |
Visualization |
Low cost, less capacity of memory and easy to upgrade |
Not support statistical features and need to integrate with other software platforms |
|
R programming |
R Development Core Team |
C++, Fortran, R |
Both |
Supervised and unsupervised data mining |
No restriction for R license and compatible across platforms |
Lack of memory management because any available memory is needed quickly to performs the task. |
|
KNIME |
University of Konstanz |
Java |
GUI |
Supervised and unsupervised data mining |
Capability to process massive data that only can be limited on the available computer hard disk space. |
Update to the latest version not working unless user installing the software again. |
-
6) Konstanz Information Miner (KNIME)
KNIME is a data mining tool that can support any data mining algorithms. It based on the data pipeline concept for visual programming on GUI based workflow [78]. Written in Java based language on Eclipse. For having a visual program, building blocks that called as nodes in KNIME tool are puts on canvas and connected. It has more than 1000 available nodes are organized in the form of hierarchy structure and search name through the interface. Every each of node is documented with detail.
The documentation is automatically shown when the specific node had been selected. KNIME can create a report and export to any document format such as doc, pdf, xls and others. The architecture of KNIME that capable to process massive data only can be limited depends on the available computer hard disk space. Problem with KNIME is when users want to update the latest version of the software, they need to reinstall the software again because this software cannot work after updating.
Table 3. Comparison of supervised data mining techniques
|
Author |
Techniques |
Variables |
Tool |
Significances |
|
[41] |
SVM, DT, rule induction. |
Sociodemographic, enrolment and social |
Rapid Miner |
The finding shows that the accuracy of data set for Linear SVM 89.84%, decision tree 86.32% and for rule induction is 81.98%. |
|
[37] |
DT |
Sociodemographic, enrolment and social |
R |
Three decision tree includes CART tree, C4.5 and C5.0 are used to trained data sets. The result shows the accuracy for CART tree 79.29%, C4.5 74.51% and C5.0 78.86%. |
|
[80] |
DT |
Sociodemographic, enrolment, social and physiological |
WEKA |
Introduced improved DT by using a combination of Renyi entropy, Information gain and Association Function. Both ID3 and improved DT had shown the accuracy of 92.50% and 97.50%. |
|
[42] |
NB |
Sociodemographic, enrolment and social |
WEKA, R |
The result on the evaluation of the dataset shows the accuracy measure for Navïe Bayes classifier is 72% correctly. |
|
[14] |
KNN, DT, NB, RF, C5.0 |
Sociodemographic, enrolment and social |
R |
The result shows that the RF algorithm had a higher accuracy measure with 89.24% after the comparison with other algorithms. |
|
[10] |
DT |
Sociodemographic and enrolment |
R |
The finding shows that the accuracy measure for DT includes RF and CART tree is 87.9% and 87.4%. |
|
[45] |
KNN, DT, NB, SVM and RF |
Sociodemographic and enrolment |
Weka |
The accuracy result of classifiers for KNN 81.6%, DT 76.4%, NB 78.2%, SVM 82.6% and RF 81.1%. |
|
[28] |
KNN, DT, NB, NN |
Sociodemographic, enrolment, social and physiological |
R |
The result of evaluation shown that KNN had a higher accuracy measure with 87% compared to DT 79.7%, NN 76.8% and NB 73.9%. |
-
VI. Discussion
Supervised classifications algorithms are the most popular algorithms in data mining were used for analyzing the attritions issues in HE. It can be seen after reviewed several research articles, most of the research paper presented the success of implementing the supervised classification algorithms such as Naïve Bayes, Decision Tree (DT), K-Nearest Neighbors (KNN), Neural Network (NN), Support Vector Machine (SVM), Rule Induction and Instance-based learning are being used to produce the high accuracy results.
Table 3 clearly stated, supervised classification algorithms provide varying accuracy based on the varying dataset was used in the evaluation process. Before the classification algorithms are being applied in a dataset, these datasets are being tested in the training phase by applying the cross-validation and percentage split methods. The datasets can be categorized as sociodemographic, enrollment, social and psychological.
In sociodemographic, variables that had been included consists of age, gender, ethnicity, the location from home and university, marital status, family education, parent occupation, family size, date of birth, high school results, family income, job status, sponsorships. For enrollments are program code, cumulative grade point average (CGPA), grade point average (GPA), semester enrolled, credits hours, study mode, attendance, student status (active, complete, attrition). Variables for social such as physical activities, hobbies and socializing with friends. Then, for psychological are includes student personal traits and satisfaction with the enrolled course.
Choosing suitable data mining tools is important to process the datasets. R programming is the most popular open source tool had been chosen by researchers in their experiments because these tools can validate the results fast compare to other tools. Besides, R programming is currently had been used widely in the industry. One of the supervised data classification algorithms is mostly used for classifying student attrition is a Decision Tree. A DT classifier is easy to understand by a human with a straightforward explanation. In DT algorithms, the highest accuracy measure had been shown by the improved decision tree where it based on combination Renyi entropy, Information gain and Association Function with value 97.50% most accurate.
-
VII. Conclusion
This paper presented a reviewed on student attrition issues among undergraduate students in HE. Multiple research papers had been analyzed to identify the reasons behind students’ attrition to leave their studies and to highlight the research gaps between the current research with previous research that had been done by the researcher. Identifying attrition students is a challenging task for stakeholders in HEIs because they need to examine the information of undergraduate students group from a vast amount of data in their daily operation. From the study, attrition problem can be solved when these institutions are applying advanced analytical techniques such as big data analytics and data mining techniques in their management process. Both of these techniques have many advantages especially for educational purpose in providing the solutions to support smart decision making. At the end of the study, we can conclude that the supervised data classification algorithm namely Decision Tree classifiers is the most popular of algorithms can be used as experiments setting to produce highly accurate results. It same goes to the R programming that had been used widely in the industry includes educational fields.
Acknowledgments
Our utmost gratitude goes to Universiti Teknologi MARA (UiTM) who has sponsored this research work under the Research Entity Initiative (REI), 600-RMI/DANA 5/3/REI (3/2015).
References A review on student attrition in higher education using big data analytics and data mining techniques
- “Kementerian Pendidikan Malaysia. Malaysia Education Blueprint 2015-2025 (Higher Education)”, 2015. Retrieved from http://www.mohe.gov.my/en/download/awam/penerbitan/p ppm-2015-2025-pt/5-malaysia-education-blueprint-2015- 2025-higher-education/file
- “Tackling lack of interest in STEM subjects”. (2017). Malaysia Education Hub. Retrieved from http://www.edumsia.my/article/tackling-lack-of-interest-in- stem-subjects
- Chen, Y., Johri, A., & Rangwala, H., “Running out of STEM: A Comparative Study across STEM Majors of College Students At-Risk of Dropping Out Early”, In Proceedings of the 8th International Conference on Learning Analytics and Knowledge, pp. 270–279, 2018.
- Sangodiah, A., Beleya, P., Muniandy, M., Heng, L. E., & Spr, C. R., “Minimizing Student Attrition in Higher Learning Institutions in Malaysia Using Support Vector Machine”, Journal of Theoretical and Applied Information Technology, Vol. 71, No. 3, pp. 377–385, 2015.
- Ryan, P., & Greig, G., “Student Attrition and Completion: What is it that we are Actually Trying to Measure?”, pp. 1– 7, 2017.
- Alom, B. M. M., & Courtney, M., “Educational Data Mining: A Case Study Perspectives from Primary to University Education in Australia”, International Journal of Information Technology and Computer Science, Vol. 10, No.2, pp. 1–9, 2018. https://doi.org/10.5815/ijitcs.2018.02.01
- Shariffuddin, S. A., Razali, J. R., Ghani, M. A., Shaaidi, W. R. W., & Ibrahim, I. S. A., “Transformation of Higher Education Institutions in Malaysia: A Review”, Journal of Global Business and Social Entrepreneurship (GBSE), Vol. 1, No. 2, pp. 126–136, 2017.
- Crosling, G., “Quality Assurance and Quality Enhancement in Malaysian Higher Education”, The Rise of Quality Assurance in Asian Higher Education, pp. 127–141, 2017. DOI:10.1016/b978-0-08-100553-8.00004-5
- Azman, N., Omar, I. C., Yunus, A. S. M., & Zain, N. M., “Academic Promotion in Malaysian Public Universities: A Critical Look at Issues and Challenges”, Oxford Review of Education, Vol. 42, No. 1, pp. 71–88, 2016. DOI:10.1080/03054985.2015.1135114
- Mokhtar, R., Abdul Rahman, A., & Othman, S. H., “Academic Quality Assurance Metamodel Knowledge Repository as a Quality Monitoring Mediator”, 2016 IEEE Conference on E-Learning, E-Management and E-Services (IC3e), pp. 176–181, 2016.
- Migin, M. W., Falahat, M., Yajid, M. S. A., & Khatibi, A., “Impacts of Institutional Characteristics on International Students’ Choice of Private Higher Education Institutions in Malaysia”, Higher Education Studies, Vol. 5, No. 1, pp. 31–42, 2015. DOI:10.5539/hes.v5n1p31
- Adusei-asante, K., & Doh, D., “Students’ Attrition and Retention in Higher Education: A Conceptual Discussion”, pp. 1–10, 2016.
- Beer, C., & Lawson, C., “The Problem of Student Attrition in Higher Education: An Alternative Perspective”, Journal of Further and Higher Education, Vol. 41, No. 6, pp. 773– 784, 2016. DOI:10.1080/0309877X.2016.1177171
- Martins, L. C. B., Carvalho, R. N., Carvalho, R. S., Victoria, M. C., & Holanda, M., “Early Prediction of College Attrition Using Data Mining”, In Machine Learning and Applications (ICMLA), pp. 1075–1078, 2017. DOI:10.1109/ICMLA.2017.000-6
- Viale Tudela, E. H., “A Theoretical Approach to The College Student Drop Out”, Revista Digital de Investigación En Docencia Universitaria (RIDU), Vol. 8, No. 1, pp. 59– 74, 2014.
- Chai, K. E., & Gibson, D., “Predicting The Risk of Attrition for Undergraduate Students with Time Based Modelling”, International Association for Development of the Information Society, pp. 109–116, 2015.
- Hoffait, A., & Schyns, M., “Early detection of university students with potential difficulties”, Decision Support Systems, pp. 1–37, 2017. DOI:10.1016/j.dss.2017.05.003
- Kang, K., & Wang, S., “Analyze and Predict Student Dropout from Online Programs”, In Proceedings of the 2nd International Conference on Compute and Data Analysis, pp. 6–12, 2018.
- Mansour, E. A., Gemeay, E. M., Behilak, S., & Albarrak, M., “Factors Affecting Attrition Rate Among Nursing Students College of Health Sciences, Taibah University, Saudi Arabia”, International Journal of Nursing, Vol. 3, No. 1, pp. 65–72, 2016. DOI:10.15640/ijn.v3n1a8
- Taipe, M. A., & Mauricio, D., “Predicting University Dropout through Data Mining: A Systematic Literature”, Indian Journal of Science and Technology, Vol. 12, No. 4, pp. 1–12, 2019. DOI:10.17485/ijst/2019/v12i4/139729
- Almarabeh, H., “Analysis of Students’ Performance by Using Different Data Mining Classifiers”, International Journal of Modern Education and Computer Science, Vol. 9, No. 8, pp. 9–15, 2017. DOI:10.5815/ijmecs.2017.08.02
- Chatterjee, S., & Jose, P. G., “Text Classification Using SVM Enhanced by Multithreading and CUDA”, International Journal of Modern Education and Computer Science, Vol. 11, No. 1, pp. 11–23, 2019. DOI:10.5815/ijmecs.2019.01.02
- Christo, Z., & Oyinlade, A. O., “Factors of Student Attrition at an Urban University”, International Journal of Humanities and Social Science, Vol. 5, No. 9, pp. 9–22, 2015.
- Yukselturk, E., Ozekes, S., & Turel, Y. K., “Predicting Dropout Student: An Application of Data Mining Methods in an Online Education Program”, European Journal of Open, Distance and E-Learning, Vol. 17, No. 1, pp. 118–133, 2014.
- Boton, E. C., & Gregory, S., “Minimizing Attrition in Online Degree Courses”, Journal of Educators Online, Vol. 12, No. 1, pp. 62–90, 2015.
- Mortagy, Y., Boghikian-Whitby, S., & Helou, I., An “Analytical Investigation of the Characteristics of the Dropout Students in Higher Education”, Issues in Informing Science and Information Technology Education, Vol. 15, pp. 249–278, 2018.
- Paura, L., & Arhipova, I., “Cause Analysis of Students’ Dropout Rate in Higher Education Study Program”, Procedia - Socail and Bahavioral Sciences, Vol. 109, pp. 1282–1286, 2014. DOI:10.1016/j.sbspro.2013.12.625
- Tiwari, S., Wee, H. M., & Daryanto, Y., “Big Data Analytics in Supply Chain Management Between 2010 And 2016: Insights to industries”, Computers & Industrial Engineering, Vol. 115, pp. 319–330, 2018.
- El-mouadib, F. A., & El-majressi, A. O., “A Study of Multilevel Association Rule Mining”, pp. 1–6, 2014.
- Sandeep, Chauhan, S. K., Reema, & Sangwan, S., “Big data analytics”, International Journal on Recent and Innovation Trends in Computing and Communication, Vol. 5, No. 4, pp. 407–410, 2017.
- Oussous, A., Benjelloun, F.-Z., Lahcen, A. A., & Belfkih, S., “Big Data Technologies: A survey”, Journal of King Saud University – Computer and Information Sciences, Vol. 30, No. 4, pp. 431–448, 2018.
- Wang, Y., Kung, L., & Anthony, T., “Big data Analytics: Understanding its Capabilities and Potential Benefits for Healthcare Organizations”, Technological Forecasting & Social Change, pp. 1–11, 2016.
- Shoro, A. G., & Soomro, T. R., “Big Data Analysis: Ap Spark Perspective”, Global Journal of Computer Science and Technology: C Software & Data Engineering, Vol. 15, No. 1, pp. 1–9, 2015.
- Das, N., Das, L., Rautaray, S. S., & Pandey, M., “Big Data Analytics for Medical Applications”, International Journal of Modern Education and Computer Science, Vol. 10, No. 2, pp. 35–42, 2018. DOI:10.5815/ijmecs.2018.02.04
- Vassakis, K., Petrakis, E., & Kopanakis, I., “Big Data Analytics: Applications, prospects and challenges”, In Mobile Big Data, pp. 3–20, 2018.
- Kaur, H., & Phutela, A., “Commentary Upon Descriptive Data Analytics”, In 2018 2nd International Conference on Inventive Systems and Control (ICISC), pp. 678–683, 2018.
- Gandomi, A., & Haider, M., “Beyond the hype: Big Data Concepts, Methods, and Analytics”, International Journal of Information Management, Vol. 35, pp. 137–144, 2015. DOI:10.1016/j.ijinfomgt.2014.10.007
- Radha, D., Jayaparvathy, R., & Jyothirmayi Bhargavi, A., “A Novel Approach to Analyze Students’ Expectation from Colleges Using Data Mining Technique”, International Journal of Computer Applications, Vol. 137, pp. 25–28, 2016.
- Soltanpoor, R., & Sellis, T., “Prescriptive Analytics for Big Data”, Database Theory and Applications, pp. 245–256, 2016. DOI:10.1007/978-3-319-46922-5
- Kaur, P., Singh, M., & Josan, G. S., “Classification and Prediction Based Data Mining Algorithms to Predict Slow Learners in Education Sector”, Procedia - Procedia Computer Science, Vol. 57, pp. 500–508, 2015. DOI:10.1016/j.procs.2015.07.372
- Rehman, N., “Data Mining Techniques Methods Algorithms and Tools”, International Journal of Computer Science and Mobile Computing, Vol. 6, No. 7, pp. 227–231, 2017.
- Gulati, H., “Predictive Analytics Using Data Mining Technique”, In Computing for Sustainable Global Development (INDIACom), pp. 713–716, 2015.
- Asif, R., Merceron, A., & Pathan, M. K., “Predicting Student Academic Performance at Degree Level: A Case Study”, International Journal Intelligent Systems and Applications, Vol. 7, No. 1, pp. 49–61, 2015. DOI:10.5815/ijisa.2015.01.05
- Kumar, S. A., & Vijayalakshmi, M. N., “Efficiency of Multi-Instance Learning in Educational Data Mining”, Knowledge Computing and Its Applications, pp. 47–64, 2018. DOI:10.1007/978-981-10- 8258-0_3
- Houari, R., Bounceur, A., Tari, A., & Kechadi, M., “Handling Missing Data Problems with Sampling Methods”, 2014 International Conference on Advanced Networking Distributed Systems and Applications, pp. 1–6, 2014. DOI:10.1109/INDS.2014.25
- Sumantri, R. B. B., & Utami, E., “Determination of Status of Family Stage Prosperous of Sidareja District Using Data Mining Techniques”, International Journal Intelligent Systems and Applications, Vol. 10, No. 10, pp. 1–10, 2018. DOI:10.5815/ijisa.2018.10.01
- Yusof, N. N., Mohamed, A., & Abdul rahman, S., “Reviewing Classification Approaches in Sentiment Analysis”, In International Conference on Soft Computing in Data Science, pp. 43–53, 2015. DOI:10.1007/978-981-287-936-3
- Satı, N. U., “Semi-Supervised Classification in Educational Data Mining: Students’ Performance Case Study”, International Journal of Computer Applications, Vol. 179, No. 26, pp. 13–17, 2018. DOI:10.5120/ijca2018916549
- Khedr, A. E., Salama, S. E., & Yaseen, N., “Predicting Stock Market Behavior Using Data Mining Technique and News Sentiment Analysis”, International Journal Intelligent Systems and Applications, Vol. 9, No. 7, pp. 22–30, 2017. DOI:10.5815/ijisa.2017.07.03
- Najdi, L., & Er-Raha, B., “A Novel Predictive Modeling System to Analyze Students at Risk of Academic Failure”, International Journal of Computer Applications, Vol. 156, No. 6, pp. 25–30, 2016.
- Gavrilovski, A., Jimenez, H., Mavris, D., Rao, A., Shin, S.- H., Hwang, I., & Marais, K., “Challenges and Opportunities in Flight Data Mining: A Review of the State of the Art”, In AIAA Infotech@ Aerospace, pp. 1–18, 2016. https://doi.org/10.2514/6.2016-0923
- Saa, A. A., “Educational Data Mining & Students’ Performance Prediction”, International Journal of Advanced Computer Science and Applications, Vol. 7, No. 5, pp. 212–220, 2016.
- Dey, L., Chakraborty, S., Biswas, A., Bose, B., & Tiwari, S., “Sentiment Analysis of Review Datasets using Naïve Bayes’ and K-NN Classifier”, International Journal of Information Engineering and Electronic Business, Vol. 8, No. 4, pp. 54–62, 2016. DOI:10.5815/ijieeb.2016.04.07
- Adeniyi, D. A., Wei, Z., & Yongquan, Y., Automated Web Usage Data Mining and Recommendation System using K- Nearest Neighbor (KNN) Classification Method. Applied Computing and Informatics, Vol. 12, pp. 90–108, 2016.
- Bilal, M., Israr, H., Shahid, M., & Khan, A., “Sentiment classification of Roman-Urdu opinions using Naïve Bayesian, Decision Tree and KNN classification techniques”, Journal of King Saud University – Computer and Information Sciences, Vol. 28, No. 3, pp. 330–344, 2016.
- Oyedotun, O. K., Tackie, S. N., Olaniyi, E. O., & Khashman, A., “Data Mining of Students’ Performance: Turkish Students as a Case Study”, International Journal Intelligent Systems and Applications, Vol. 7, No. 9, pp. 20– 27, 2015. DOI:10.5815/ijisa.2015.09.03
- Rahman, N. A. A., Tan, K. L., & Lim, C. K., “Supervised and Unsupervised Learning in Data Mining for Employment Prediction of Fresh Graduate Students”, Journal of Telecommunication, Electronic and Computer Engineering, Vol. 9, No. 2, pp. 155–161, 2017.
- Zavvar, M., Rezaei, M., & Garavand, S., “Email Spam Detection Using Combination of Particle Swarm Optimization and Artificial Neural Network and Support Vector Machine”, International Journal of Modern Education and Computer Science, Vol. 8, No. 7, pp. 68–74, 2016. DOI:10.5815/ijmecs.2016.07.08
- Najafabadi, M. K., Mohamed, A., & Mahrin, M. N., “A Survey on Data Mining Techniques in Recommender Systems”, Soft Computing, pp. 1–28, 2017. DOI:10.1007/s00500-017-2918-7
- Mehrotra, D., Srivastava, R., Nagpal, R., & Nagpal, D., “Multiclass Classification of Mobile Applications as per Energy Consumption”, Journal of King Saud University – Computer and Information Sciences, pp. 1–9, 2018.
- Hasbun, T., Araya, A., & Villalon, J., “Extracurricular Activities as Dropout Prediction Factors in Higher Education using Decision Trees”, 2016 IEEE 16th International Conference on Advanced Learning Technologies (ICALT), pp. 242–244, 2016. DOI:10.1109/ICALT.2016.66
- He, L., Levine, R. A., Fan, J., Beemer, J., & Stronach, J., “Random Forest as a Predictive Analytics Alternative to Regression in Institutional Research”, Practical Assessment, Research & Evaluation, Vol. 23, No. 1, pp. 1–16, 2018.
- Shariff, S. S. R., Mohd Rodzi, N. A., Abdul Rahman, K., Zahari, S. M., & Mohd Deni, S., “Predicting the “Graduate on Time (GOT)” Of PhD Students Using Binary Logistics Regression Model”, The 4th International Conference on Quantitative Sciences and Its Applications (ICOQSIA 2016), pp. 1–8, 2016. DOI:10.1063/1.4966105
- Hussain, A., & Cambria, E., “Semi-supervised Learning for Big Social Data Analysis”, Neurocomputing, Vol. 275, pp. 1662–1673, 2018.
- Zacharis, N. Z., “Classification and regression trees (CART) for predictive modeling in blended learning”, International Journal Intelligent Systems and Applications, Vol. 10, No. 3, pp. 1–9, 2018. DOI:10.5815/ijisa.2018.03.01
- Ramadas, M., Abraham, A., & Kumar, S., “FSDE-Forced Strategy Differential Evolution used for Data Clustering”, Journal of King Saud University – Computer and Information Sciences, pp. 1–11, 2016.
- Rawat, B., “Analyzing the Performance of Various Clustering Algorithms”, International Journal of Modern Education and Computer Science, Vol. 11, No. 1, pp. 45– 53, 2019. DOI:10.5815/ijmecs.2019.01.06.
- Ahuja, R., Jha, A., Maurya, R., & Srivastava, R., “Analysis of Educational Data Mining”, In Harmony Search and Nature Inspired Optimization Algorithms, pp. 897–907, 2019.
- Anand, V. K., Rahiman, S K, A., Ben George, E., & Huda, A. S., “Recursive Clustering Technique for Students’ Performance Evaluation in Programming Courses”, 2018 Majan International Conference (MIC), pp. 1–5, 2018.
- Alsmadi, I., & Alhami, I., “Clustering and Classification of Email Contents”, Journal of King Saud University – Computer and Information Sciences, Vol. 27, No. 1, pp. 46–57, 2015.
- Oeda, S., & Hashimoto, G., “Log-Data Clustering Clustering Analysis Analysis for Dropout Prediction in Beginner Programming Classes”, Procedia Computer Science, Vol. 112, pp. 614–621, 2017.
- Karkhanis, S. P., & Dumbre, S. S., “A Study of Application of Data Mining and Analytics in Education Domain”, International Journal of Computer Application, Vol. 120, No. 22, pp. 23–29, 2015.
- Mohd Yakop, M. A., Mutalib, S., & Abdul Rahman, S., “Review of Frequent Itemsets Mining in High Dimensional Dataset”, International Conference on Artificial Intelligence with Applications in Engineering and Technology, pp. 57–62, 2014. DOI:10.1109/ICAIET.2014.19
- Bakhshinategh, B., Zaiane, O. R., Elatia, S., & Ipperciel, D., “Educational Data Mining Applications and Tasks: A Survey of the Last 10 Years”, Education and Information Technologies, Vol. 23, No. 1, pp. 537–553, 2017. DOI:10.1007/s10639-017-9616-z
- Hegde, V., & Prageeth, P. P., “Higher Education Student Dropout Prediction and Analysis through Educational Data Mining”, Proceedings of the Second International Conference on Inventive Systems and Control (ICISC 2018), pp. 694–699, 2018.
- Mittal, V., & Anuradha., “A Real Time Data Mining Model to Predict Academic Attrition”, International Journal for Research in Science Engineering & Technology, Vol. 4, No. 7, pp. 46–54, 2017.
- Slater, S., Joksimovic, S., Kavanovic, V., Baker, R. S., & Gasevic, D., “Tools for Educational Data Mining: A Review”, Journal of Educational and Behavioral Statistics, Vol. 42, No. 1, pp. 85–106, 2016. DOI:10.3102/1076998616666808
- Jovic, A., Brkic, K., & Bogunovic, N., “An Overview of Free Software Tools for General Data Mining”, 2014 37th International Convention on Information and Communication Technology, Electronics and Microelectronics (MIPRO), No. 1112-1117, pp. 26–30, 2014.
- Rajeswari, C., Basu, D., & Maurya, N., “Comparative Study of Big Data Analytics Tools: R and Tableau”, In IOP Conference Series: Materials Science and Engineering, Vol. 263, No. 4, pp. 1–9, 2017. DOI:10.1088/1757-899X/263/4/042052
- Sivakumar, S., Venkataraman, S., & Selvaraj, R., “Predictive Modeling of Student Dropout Indicators in Educational Data Mining Using Improved Decision Tree”, Indian Journal of Science and Technology, Vol. 9, No. 4, pp. 1–5, 2016. DOI:10.17485/ijst/2016/v9i4/87032
