A Robust Approach for R-Peak Detection

Author: Amana Yadav, Naresh Grover
Journal: International Journal of Information Engineering and Electronic Business(IJIEEB) @ijieeb
Article in issue: 6 vol.9, 2017.
Free access
Electrocardiogram (ECG) is very crucial and important tool to detect the cardiac problems. For ECG analysis, it is essential to measure ECG parameter accurately. It is very critical in all types of ECG application. The accurate R Peaks detection is starting step in extracting ECG features which is necessary for the other ECG performance stages. It is very essential to detect these R-peaks accurately and efficiently to detect heart diseases or anomalies which create primary source of death in the universe. Hence automatic R-peaks detection in a lengthy duration ECG signal is very meaningful to diagnose the cardiac disorders. Here a latest R-peak exposure algorithm depended on Shannon energy envelope estimator and logic to find peaks has been proposed which uses the simple threshold of Shannon energy.
ECG, R-peak detection, QRS complex, P-QRS-T waves, sampling frequency, Cardiac arrhythmia, MATLAB
Short address: https://sciup.org/15013552
IDR: 15013552
Text of the scientific article A Robust Approach for R-Peak Detection
Published Online November 2017 in MECS DOI: 10.5815/ijieeb.2017.06.06
The ECG is widely used to find out the cardiac problems, since it measures the contractile electrical activity of the heart developed over the cardiac rhythm through different electrodes placed at different places on the human body [1]. ECG is an exclusive signal which is based on the physical composition especially chest of a particular person. Therefore ECG can be used to distinguish any individuals [2].
A normal ECG signals characterized by a P wave, a T wave and a QRS complex are shown in figure 1. R wave has the highest amplitude in heart signal than the other portions.
The performance of R Peak detection systems depends on how accurate the R-peak detector is. Therefore it is very essential to identify the R-peaks in QRS complex accurately and efficiently. Automatic R-peaks detection in a large duration ECG signal is very meaningful to diagnose the cardiac disorders [3]. R Peaks are pointed towards the positive side ever and hence can’t have negative values [4].
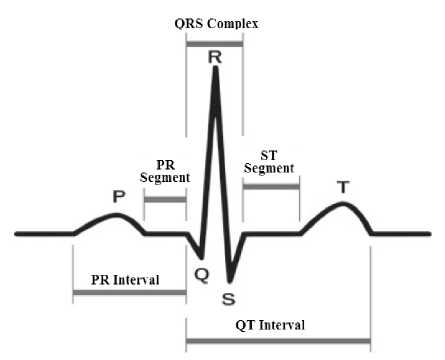
Fig.1. ECG signal made of a P wave, a QRS complex and a T wave [5]
During last few years, many systems have been designed for QRS detection. Numerous QRS detection algorithms based on the derivatives [6], filtering techniques [7-10], wavelet transform [11-13], mathematical morphology [14,15], empirical mode decomposition (EMD) [16], geometrical matching [17], artificial neural networks [18] and hybrid approach [19], genetic algorithms [20], syntactic methods [21], Hilbert transform [22], Markov models [23] etc. reported in literature have been developed for R-peaks detection. The filtering techniques and decision rules based methods are very efficient so best for all ECG analysis [9]. Many approaches comprise of a preprocessing or extraction of features and then a decision block [24]. To accentuate the QRS complex various signal processing techniques are applied in preprocessing stage which also suppresses the noises but they have some drawbacks. In [7], there is a tradeoff between absence and false identification of peaks based on the choice of filter’s bandwidth and capacity of the moving-window integrator. The Empirical mode decomposition in [16] can defeated the selection problem of mother wavelet of Wavelet based QRS detector but under noisy environments it is very difficult to select the set of intrinsic mode functions (IMF). By introducing further useful filtering technique and threshold alteration method performance can be improved [16]. To study the ECG, a faithful approach to detect QRS which depends on the highest slope identification was introduced [25]. In subsequent years many changes have been done on the method of Pan Tompkins. Baseline correction is required to get the complete details of QRS complex, so instead of using adaptive thresholding a fixed thresholding is required [26]. Instead of using the HPF and differentiator in Pan Tompkins’ algorithm a novel Pan Tompkins algorithm by adopting a Savitzky-Golay filter is generated [27].
In this paper, an advanced preprocessor depending on the Shannon energy envelope estimator and logic to detect peaks using simple threshold of Shannon energy has been proposed which is straightforward with better accuracy and takes minimum computation time. The threshold T can be evaluated by using universal threshold suggested by Donoho.
The major purpose of proposed work is to check this technique on ECG of human being who is not well; hence ECG signal is a personal recognition of different patients.
Algorithm is implemented with the help of MATLAB. Almost all the R peak recovering techniques utilizes the standard Massachusetts Institute of Technology-Beth Israel Hospital (MIT-BIH) record from physionet.org for the analysis of an ECG signal [8]. The arrhythmia displays the irregularities of heart which are observed as Tachycardia and Bradycardia can be simply obtained. The proposed R-peak detector has 99.60% accuracy, 99.84% sensitivity and 99.75% positive predictivity. The results prove that the given R Peak detector works better than other conventional techniques for pathological or noisy signals.
The paper is arranged in such a way:
In Section 2, the five-stage technique to obtain the R-peak is explained precisely. This section introduces proposed preprocessor and a new automatic technique to find peaks in detail. Section 3, shows the empirical results to present the standard of the proposed technique. Finally, Section 4 concludes our study and also present future scope.
-
II. Proposed methodology
The target of this paper is to propose a new algorithm to detect R-peak using a novel approach [28]. All existing R-peak detection methods are suffered from the noise. Therefore to analyze the ECG signals, firstly we have to remove the noise from the signals in preprocessing stage.
The architecture to obtain R Peak is represented in Fig. 2 which includes five stages, as preprocessing and filtering (band pass filter), first-order forward difference operation to highlight the QRS complex, an amplitude normalization, Shannon energy envelope withdrawal stage, peak-detection logic stage and exact R-peak finder. Filter is used to pre-process and filter the signal. Once the signal is free from the noise then Shannon energy envelope (SEE) estimator is used to find the R Peak position and their amplitude. In this stage to find Shannon energy (SE) envelope, this method uses Shannon energy assessment and zero-phase filtering which plays an important role. It can be observed that in the SE envelope major local maxima detect the approximate R-peaks locations in ECG. Then we applied a peak finding logic where the proposed technique is developed based on simple threshold of Shannon energy. Actual positions of the local maxima are identified using the proposed technique. Finally, to find accurate R peak locations in ECG signal, these positions of local maxima are used as guides. The architecture of proposed methodology is represented in Fig 2.
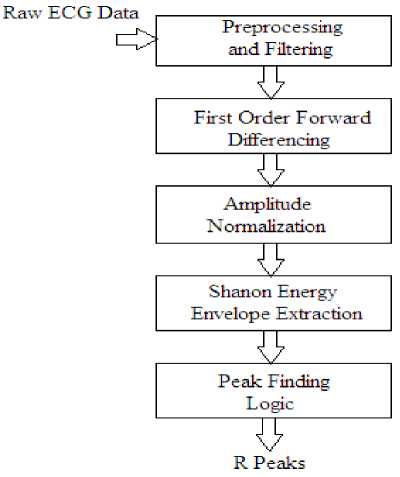
Fig.2. R-peak Detection Technique
The detailed discussions of each stage are as follows:
-
A. Preprocessing and Filtering Stage
In the realistic environments the ECG signal obtain from the patient gets corrupted by external noises; hence to make ECG signal proper noise free is essential. Various types of noise are frequency interference, power line interference, polarization noise, baseline drift, muscle noise, muscle contraction, electrode contact noise, internal amplifier noise, and motion artifacts and have large T and P waves. In ECG signal, Artifacts are the noises which induced due to movements of electrodes. Useful information from the ECG signal can be extracted after the processing of raw ECG signal. Therefore, Band pass filter stage and first-order differentiation stage are used for accentuating the QRS complex. This will also reduces the noise and the effect of T and P waves. To avoid the phase distortion the filter is enforced in two directions i.e. forward as well as reverse.
-
B. First Order Forward Differencing (FOFD)
After preprocessing and filtering stage, data of the ramp of the QRS complexes can be finding by differentiating the output signal of filter, f[n]. Filtered ECG signal is differentiated by implementing
diM = f1[n+1]-f1[n] (1)
This works as a HPF [4]. This step minimizes the big T and P-waves interferences. A bipolar signal is obtained from this differentiator so to facilitate the adverse R-peaks detection it is essential to rectify it.
-
C. Amplitude Normalization:-
- After differentiation, the signal is normalized, by
~d 1 [n] = d 1 [n]maxNn = 1(|d 1 [n]|) (2)
Where N= total samples in ECG segment.
-
D. Smooth SE envelope extraction:-
- This block includes Shannon Energy Computation as well as Zero Phase Filtering [29]. To find positive peaks by neglecting the polarity of QRS complexes, differentiated signal then passed through a nonlinear transformation [30]. The prime purpose of this transformation is single-sided threshold structure is to be used and upgrade the QRS complexes [31]. The following equation will be used for computation of Shannon energy envelope of the ˜d[n] i.e. normalized signal.
S[n] =—d 2 [n]log(~d 2 [n]) (3)
After finding Shannon energy, the peaks analogous to the QRS-complex regions are obtained using the zero phases filtering which gives sharp peaks and free from spikes.
The Shannon energy envelogram (SEE) approach results in minor deviations among the continuous peaks and minimizes the effects of noise components having low-value. Hence R Peak can be better identified using SE approach.
The result of the smooth Shannon energy envelope, represented by s 1 [n] is represented in Fig. 2. In the envelope major local maxima represents the approximate R peak locations in ECG signal, so the output of this stage is further handled to find the peaks.
-
E. Peak-finding logic:-
- To determine the threshold, same approach is used in most of the methods for R-peak detection. The thresholds to find R Peaks are used depending on the duration, amplitude of previously obtained R-peaks and R to R intervals. The achievement in these cases is highly dependent on the exact assessment of starting parameters. Additional decision rules are used by most of these methods to reduce false-positive disclosure after those secondary thresholds are introduced for lost R-peaks detection. Here a new peak-finding logic has been introduced in which threshold T can be evaluated by using universal threshold suggested by Donoho, which can be mathematically given as,
T = a^ZlogN(4)
N= Total samples.
a = median(lx - median(x)l)(5)
Hard threshold is applied on Shannon energy. The hard threshold operation can be mathematically given as,
№ = (l X 2 T}(6)
We get pulse for every QRS complex and centre position of this pulse is location of R-peak [10].
-
III. Result and discussion
The database of MIT-BIH arrhythmia is used to calculate the R-peak detection method. The ECG signals have sampling frequency 360 Hz. The ECG signals obtain from this database have tall and sharp P along with T waves, small, negative and wider QRS complex, baseline drift, abrupt shift in the amplitudes of QRS and morphology and irregular heart rhythms. The planned method adopted MATLAB version 8.2 and verified on different ECG signals. We measured TP (true-positive), when an R-peak is correctly obtained using the given technique.
To find the overall achievement of the proposed technique, following parameter is used.
Detection accuracy is
TP ._
Accuracy = (FP + FN + Tp) x 100%(7)
Sensitivity is
Sensitivity = (pNTpTp) x 100%(8)
Positive Predictivity is
Positive Predictivity = (ррTPTp) x 100%(9)
The proposed algorithm provides an improved R-peak detection method under various noises and artifacts and time-varying QRS complex morphology.
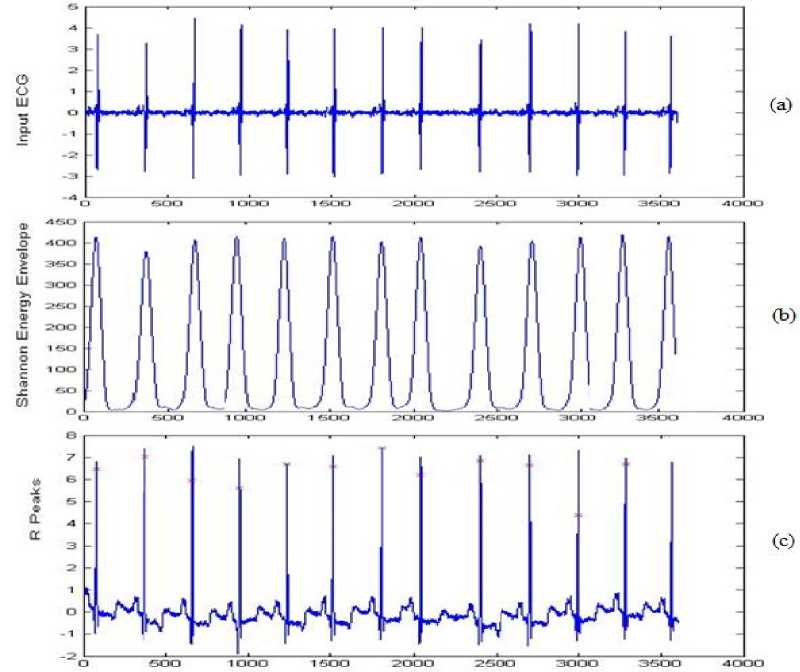
The waveforms after each stage of given technique using five ECG recordings of the MIT/BIH database are presented in Figure 3, 4, 5, 6 and 7, where waveform (a) shows the original Input ECG signal, (b) represents the SEE envelope and (c) shows the final obtained R-peaks from the given method.
Number of Samples
Fig.3. R peaks detector for record 100: (a) the actual input ECG signal. (b) Output of SEE envelope. (c) Output of obtained R-peaks.
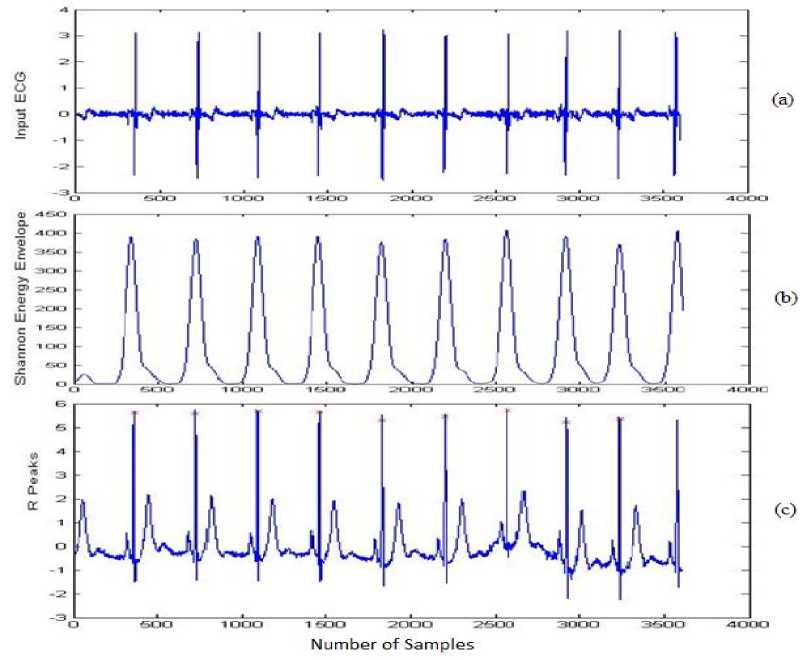
Fig.4. R peaks detector for record 106: (a) the actual input ECG signal. (b) Output of SEE envelope. (c) Output of obtained R-peaks.
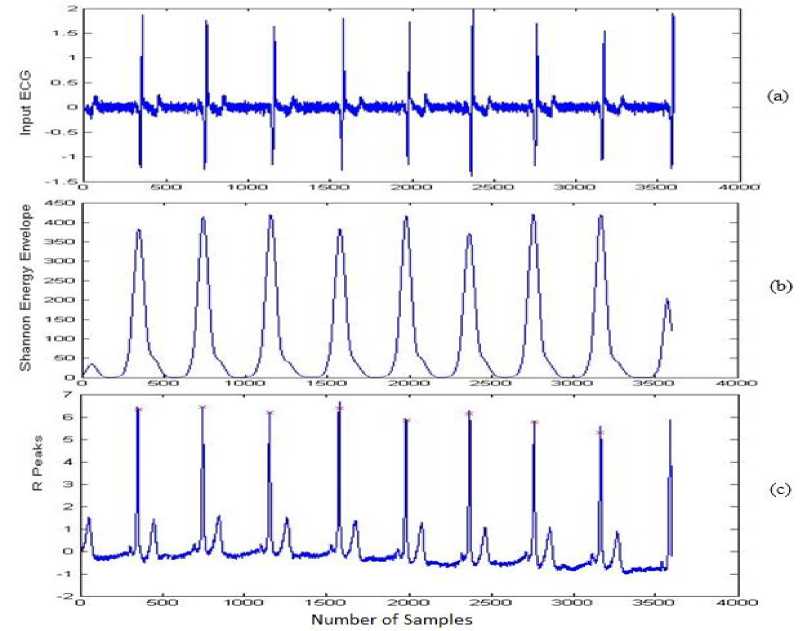
Fig.5. R peaks detector for record 202: (a) the actual input ECG signal. (b) Output of SEE envelope. (c) Output of obtained R-peaks.
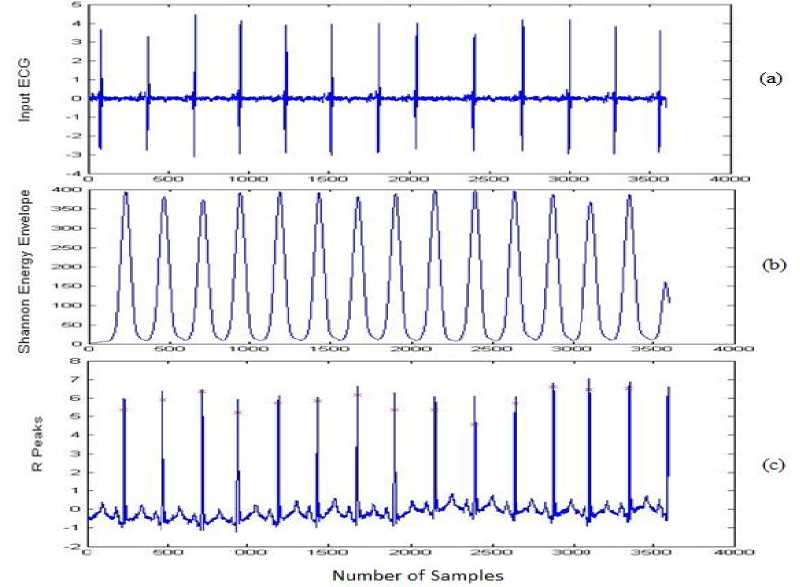
Fig.6. R peaks detector for record 205: (a) the actual input ECG signal. (b) Output of SEE envelope. (c) Output of obtained R-peaks.
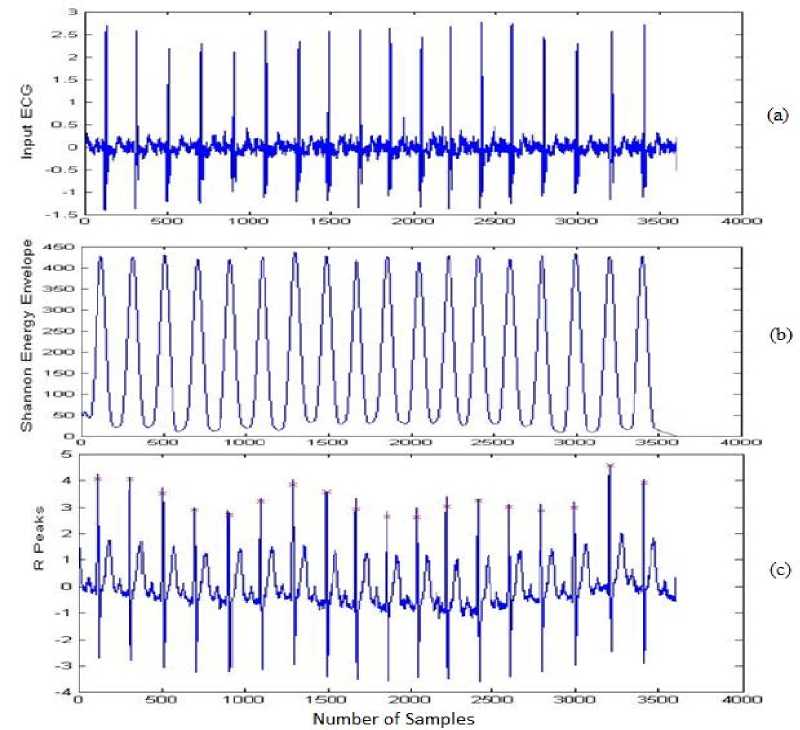
Fig.7. R peaks detector for record 215: (a) the actual input ECG signal. (b) Output of SEE envelope. (c) Output of obtained R-peaks.
Table 1. Performance Assessment of Given R-Peak Detection Method using MIT-BIH Arrhythmia Records
|
ECG Record No. |
Total (Beats) |
False Positive (Beats) |
False Negative (Beats) |
DER (%) |
Sensitivity (%) |
Positive Preditivity (%) |
Accuracy (%) |
|
100 |
2273 |
0 |
12 |
0.527 |
99.47 |
100 |
99.47 |
|
102 |
2187 |
6 |
3 |
0.410 |
99.86 |
99.73 |
99.59 |
|
103 |
2084 |
7 |
2 |
0.430 |
99.9 |
99.67 |
99.57 |
|
106 |
2027 |
7 |
2 |
0.429 |
99.9 |
99.66 |
99.57 |
|
109 |
2532 |
7 |
2 |
0.355 |
99.92 |
99.72 |
99.65 |
|
111 |
2124 |
7 |
2 |
0.422 |
99.91 |
99.67 |
99.58 |
|
113 |
1795 |
9 |
0 |
0.501 |
100 |
99.5 |
99.5 |
|
118 |
2278 |
5 |
4 |
0.391 |
99.83 |
99.78 |
99.61 |
|
202 |
2136 |
1 |
8 |
0.419 |
99.62 |
99.95 |
99.58 |
|
205 |
2656 |
6 |
3 |
0.337 |
99.88 |
99.77 |
99.66 |
|
208 |
2955 |
3 |
6 |
0.296 |
99.8 |
99.9 |
99.7 |
|
215 |
3363 |
4 |
5 |
0.264 |
99.85 |
99.88 |
99.74 |
|
217 |
2208 |
6 |
3 |
0.394 |
99.87 |
99.74 |
99.61 |
|
221 |
2427 |
8 |
1 |
0.365 |
99.96 |
99.68 |
99.64 |
|
231 |
1571 |
7 |
2 |
0.447 |
99.9 |
99.65 |
99.55 |
Performance parameter are also calculated using 15 samples of database of MIT–BIH and shown them in table no. 1.
From the table it can be seen that the standard accuracy of 99.60%, a positive predictivity (+P) of 99.75% and a sensitivity of 99.84% are obtained from our method. The
Performance obtained from the proposed method is quite better than the other methods of R peak detection.
-
IV. Conclusion and Future Scope
The computation of the ECG parameters is essential for diagnosing heart related diseases and for the study of ECG signal it is very critical to find R peak efficiently because data obtained about the R peak is most helpful in ECG analysis, classification and for finding the arrhythmia i.e. Tachycardia and Bradycardia and can also be used as an input to a structure which permits automatic cardiac diagnosis.
Hence for automated R peak detection from ECG signal, a modelled, an effective and five stages methodology has been designed in this paper. This technique provides the best possible R- peak locations. R to R distance can simply be calculated from the position of obtained R-peak which will give best possible heart beats for humans.
The proposed pre-processor depends on a preprocessing, filtering first-order forward differencing, amplitude normalization followed by SEE extraction and logic to obtain peaks. The peak detection technique based on simple threshold simplifies the determination of the R peaks locations.
The results obtained from the planned technique have been shown and discussed. The efficiency of the given method have been proved by applying the standard MIT-BIH arrhythmia records and total achievement was calculated in terms of total true positives (TP), false positives (FP) and false negatives (FN) for every samples. The proposed R-peak detector has 99.60% accuracy, 99.84% sensitivity and 99.75% positive predictivity. It has proven from the results that the given R Peak detector puts better efforts than other conventional methods in case of pathological or noisy signals.
At the output for automatic calculation of overall ECG constants, this technique can be further modified. Hence using this real time ECG signals can be processed in future.
References A Robust Approach for R-Peak Detection
- Trivedi P., Ayub S., “Detection of R Peak in Electrocardiogram”, International Journal of Computer Applications (0975 – 8887) Volume 97 – No.20, July 2014, pp 10-14.
- Nandi S. et.al. “Cellular Automata based Encrypted ECG-hash Code Generation: An Application in Inter -human Biometric Authentication System” International Journal of Computer Network and Information Security, October 2014, pp.1-12.
- Manikandan M. S., Soman K.P. “A novel method for detecting R-peaks in electrocardiogram (ECG) signal”, Biomedical Signal Processing and Control (2012) pp.118– 128.
- Ardhapurkar S., Manthalkar R., Gajre S., “Interpretation of Normal and Pathological ECG Beats using Multiresolution Wavelet Analysis”, International Journal of Information Technology and Computer Science, January 2013, pp.1-14.
- Prasad S.T., Dr. Varadarajan S., “Heart Rate Detection using Hilbert Transform”, International Journal of Research in Engineering and Technology, Volume 02, Issue 08, Aug-2013, pages 508-513.
- Yeha Y.C., Wanga W.J., “QRS complexes detection for ECG signal: the difference operation method”, Compute. Methods Prog. Biomed. (2008) 245–254.
- Pan J., Tompkins W.J., “A real time QRS detection algorithm”, IEEE Trans. Biomed. Eng. (1985) 230–236.
- Hamilton P.S., Tompkins W.J., “Quantitative investigation of QRS detection rules using the MIT/BIH arrhythmia database”, IEEE Trans. Biomed. Eng. (1986) 1157–1165.
- Arzeno N.M., Deng Z.D., Poon C.S., “Analysis of first-derivative based QRS detection algorithms”, IEEE Trans. Biomed. Eng. 55 (2) (2008) 478–484.
- Benitez S., Gaydecki P.A., Zaidi A., Fitzpatrick A.P., “The use of the Hilbert transform in ECG signal analysis”, Comput. Biol. Med. 31 (2001) 399–406.
- Romero L., Addison P.S., Grubb N., “R-wave detection using continuous wavelet modulus maxima”, IEEE Proc. Comp. Cardiol. 30 (2003) 565–568.
- Abdelliche F., Charef A., “R-peak detection using a complex fractional wavelet”, International Conference on Electrical and Electronics Engineering, Bursa, 2009, pp. 267–270.
- Elgendi M., Jonkman M., De Boer F., “R wave detection using Coiflets wavelets”, IEEE 35th Annual Northeast Bioengineering Conference, Boston, MA, 2009, pp. 1–2.
- Chen Y.L., Duan H.L., “A QRS complex detection algorithm based on mathematical morphology and envelope”, International Conference of the IEEE EMBS, Shanghai, China, 2005, pp. 4654–4657.
- Zhang F., Lian Y., “QRS detection based on multi-scale mathematical morphology for wearable ECG devices in body area networks”, IEEE Trans. Biomed. Circuits Syst. 3 (2009) 220–228.
- Hongyan X., Minsong H., “A new QRS detection algorithm based on empirical mode decomposition”, International Conference on Bioinformatics and Biomedical Engineering, 2008, pp. 693–696.
- Suárez K.V., Silva J.C., Berthoumieu Y., Gomis P., Najim M., “ECG beat detection using a geometrical matching approach”, IEEE Trans. Biomed. Eng. 54 (4) (2007) 485–489.
- Abibullaev B., Seo H.D., “A New QRS detection method using wavelets and artificial neural networks”, J. Med. Syst. (2010).
- Meyer C., Gavela J.F., Harris M., “Combining algorithms in automatic detection of QRS complexes in ECG signals”, IEEE Trans. Inf. Technol. Biomed. (2006) 468–475.
- Poli R., Cagnoni S., and Valli G., “Genetic design of optimum linear and nonlinear QRS detectors”, IEEE Trans. Biomed. Eng., 1995, vol. 42, pp. 1137- 1141.
- Skordalakis E., “Syntactic ECG processing: a review”, Pattern Recognition, vol. 19, no. 4, pp. 305–313, 1986.
- Zhou S. K., Wang J.T. and Xu J.R., “The real-time detection of QRScomplex using the envelop of ECG”, IEEE Engineering in Medicine and Biology Society, New Orleans, LA, 1988, p. 38.
- Andreao R. V., Dorizzi B., and Boudy J., “ECG signal analysis through hidden Markov models”, IEEE Transactions on Biomedical Engineering, 2006,vol. 53, no. 8, pp. 1541–1549.
- Kohler B. U., "The principles of software QRS detection", IEEE Engineering in Medicine and Biology Magazine, 2002.
- So H. H. and Chan K. L., 1997, “Development Of QRS Detection Method for Real Time Ambulatory Cardiac Monitor”, Int Conf IEEE/EMBS, Chicago, USA, 289-292.
- Debbabi N., Elasmi S., Arfa H., “Correction of ECG baseline wander Application to the Pan & Tompkins QRS detection algorithm”, 5th international symposium on Communication and mobile network, 2010, pp. 1-4.
- Das, Shreya and Chakraborty, Monisha, “QRS Detection Algorithm Using Savitzky-Golay Filter”, ACEEE Int. J on Signal and Image Processing, Vol. 03, No. 01, Jan 2012.
- Nouira I., Ben Abdallah A., Mohamed Bedoui H., and Mohamed Dogui, “A Robust R Peak Detection Algorithm Using Wavelet Transform for Heart Rate Variability Studies”, International Journal on Electrical Engineering and Informatics, Volume 5, Number 3, September 2013, pp 270-284.
- Anigraphy D. P., Rakshit M., Sahu P.K., “FPGA Implementation of Heart Rate Monitoring System”, Journal of Medical Systems, Volume 40 Issue 3, March 2016, Page 1-12.
- Krishna Chaitanva N. S. V., Radhakrishan A., Reddy G. R., Manikandan M. S., “A simple and robust QRS detection algorithm for wireless medical body area network” International Conference on Emerging Trends in Networks and Computer Communications (ETNCC), 2011/4/22, pages 153-158.
- Pahlm O., Sörnmo L., “Software QRS detection in ambulatory monitoring—a review”, Med. Biol. Eng. Comput. 22 (1984) 289–297.
