A Robust Image Steganography using DWT Difference Modulation (DWTDM)
")
Author: Souvik Bhattacharyya, Gautam Sanyal
Journal: International Journal of Computer Network and Information Security(IJCNIS) @ijcnis
Article in issue: 7 vol.4, 2012.
Free access
Maintaining the secrecy of information is of great concern today.Steganography is the art and science that hides the information in an appropriate cover carrier like image, text, audio and video media. Considerable amount of work has been carried out by different researchers on steganography. In this work a new transform domain image stenographic technique DWTDM is presented where secret data is embedded in adjacent DWT coefficient differences. The dynamic range of the DWT difference considered while extraction of data which results an efficient and robust stenographic technique which can avoid various image attacks and works perfectly well for both uncompressed and compressed domain. Experimental results demonstrate the effectiveness and accuracy of the proposed technique in terms of security of hidden data and various image similarity metrics.
Networked Control System, MAC protocol, priority, real-time, fairness
Short address: https://sciup.org/15011100
IDR: 15011100
Text of the scientific article A Robust Image Steganography using DWT Difference Modulation (DWTDM)
Published Online July 2012 in MECS
Steganography is the art and science of hiding information by embedding messages with in other seemingly harmless messages. Steganography means “covered writing” in Greek. As the goal of steganography is to hide the presence of a message and to create a covert channel, it can be seen as the complement of cryptography, whose goal is to hide the content of a message. Another form of information hiding is digital watermarking, which is the process that embeds data called a watermark, tag or label into a multimedia object such that watermark can be detected or extracted later to make an assertion about the object. The object may be an image, audio, video or text only. A famous illustration of steganography is Simmons’ Prisoners’ Problem [1].An assumption can be made based on this model is that if both the sender and receiver share some common secret information then the corresponding steganography protocol is known as then the secret key steganography where as pure steganography means that there is none prior information shared by sender and receiver. If the public key of the receiver is known to the sender, the steganographic protocol is called public key steganography [2], [3] and [4].For a more thorough knowledge of steganography methodology the reader is advised to see [5-6].Some Steganographic model with high security features has been presented in [7-9]. Almost all digital file formats can be used for steganography, but the image and audio files are more suitable because of their high degree of redundancy [6]. Fig. 1 below shows the different categories of steganography techniques.

Figure 1. Types of Steganography
-
A. Image Steganography Framework
A block diagram of a generic image steganographic system is given in Fig. 2.
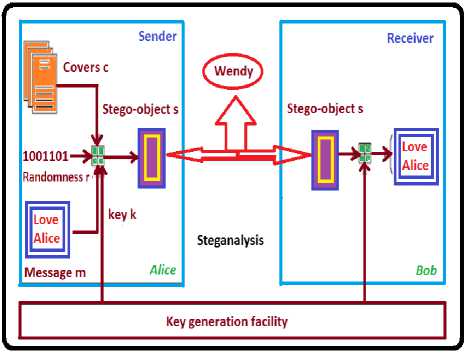
Figure 2. Generic form of Image Steganography
A message is embedded in a digital image (cover image) through an embedding algorithm, with the help of a secret key. The resulting stego image is transmitted over a channel to the receiver where it is processed by the extraction algorithm using the same key. During transmission the stego image, it can be monitored by unauthenticated viewers who will only notice the transmission of an image without discovering the existence of the hidden message.
-
B. Image Steganography Techniques
The various image steganography techniques are: (i) Substitution technique in Spatial Domain: In this technique only the least significant bits of the cover object is replaced without modifying the complete cover object. It is a simplest method for data hiding but it is very weak in resisting even simple attacks such as compression, transforms, etc. (ii) Transform domain technique: The various transform domains techniques are Discrete Cosine Transform (DCT), Discrete Wavelet Transform (DWT) and Fast Fourier Transform (FFT) are used to hide information in transform coefficients of the cover images that makes much more robust to attacks such as compression, filtering, etc. (iii) Spread spectrum technique: The message is spread over a wide frequency bandwidth than the minimum required bandwidth to send the information. The SNR in every frequency band is small. Hence without destroying the cover image it is very difficult to remove message completely.(iv) Statistical technique: The cover is divided into blocks and the message bits are hidden in each block. The information is encoded by changing various numerical properties of cover image. The cover blocks remain unchanged if message block is zero. (v) Distortion technique: Information is stored by signal distortion. The encoder adds sequence of changes to the cover and the decoder checks for the various differences between the original cover and the distorted cover to recover the secret message.
-
C. Steganalysis
Steganalysis is the science of detecting hidden information. The main objective of Steganalysis is to break steganography and the detection of stego image is the goal of steganalysis. Almost all steganalysis algorithms rely on the Steganographic algorithms introducing statistical differences between cover and stego image. Steganalysis deals with three important categories: (a) Visual attacks: In these types of attacks with a assistance of a computer or through inspection with a naked eye it reveal the presence of hidden information, which helps to separate the image into bit planes for further more analysis. (b) Statistical attacks: These types of attacks are more powerful and successful, because they reveal the smallest alterations in an images statistical behavior. Statistical attacks can be further divided into (i) Passive attack and (ii) Active attack. Passive attacks involves with identifying presence or absence of a covert message or embedding algorithm used etc. Mean while active attacks is used to investigate embedded message length or hidden message location or secret key used in embedding. (c) Structural attacks: The format of the data files changes as the data to be hidden is embedded; identifying this characteristic structure changes can help us to find the presence of image.
-
D. Problem Formulation
In this work a specific image based steganographic method for hiding information in the transform domain has been proposed. The proposed approach works both on gray scale as well as colour images also. A novel DWT difference based steganographic method has been implemented in this work. The proposed method is the modified work of Bhattacharyya and Sanyal's Transformation [10-11] in DWT domain. This work has been extensively tested on a variety of images with different textures and is robust enough to avoid various image based attack like noise addition, compression. Experimental results demonstrate that the proposed system successfully preserves the quality of the images and stays undetected by the well-known steganalysis methods also.
Rest of the paper has been organized as following sections: Section II describes some related works on image steganography. Section III describes the Bhattacharyya and Sanyal’s Transformation technique. Section IV describes the Wavelet Transform technique. Section V deals with proposed method along with the algorithms. In section VI experimental results are discussed and analyzed. Section VII contains various attacks applied and their results on the proposed methodology. Section VIII describes the results of application of steganalysis technique on stego images. Comparisons with other techniques have been shown in section IX. Section VII contains the computational complexity analysis of the embedding methods. Section X draws the conclusion.
-
II. Related works on IMAGE STEFANOGRAPHY
In this section various steganographic data hiding methods both in spatial domain and transform domain has been discussed.
-
A. Spatial Domain Steganographic Method
Various spatial domain based steganography namely LSB, PVD, GLM and method proposed by Ahmad T et al. has been proposed in this section.
-
1) Data Hiding by LSB
Various techniques about data hiding have been proposed in literatures. One of the common techniques is based on manipulating the least-significant-bit (LSB) [32], [33] and [34], [35] planes by directly replacing the LSBs of the cover-image with the message bits. LSB methods typically achieve high capacity but unfortunately LSB insertion is vulnerable to slight image manipulation such as cropping and compression.
-
2) Data Hiding by PVD
The pixel-value differencing (PVD) method proposed by Wu and Tsai [36] can successfully provide both high embed-ding capacity and outstanding imperceptibility for the stego-image. The pixel-value differencing (PVD) method segments the cover image into non overlapping blocks containing two connecting pixels and modifies the pixel difference in each block (pair) for data embedding. A larger difference in the original pixel values allows a greater modification. In the extraction phase, the original range table is necessary. It is used to partition the stego-image by the same method as used to the cover image. Based on PVD method, various approaches have also been proposed. Among them Chang et al. [37] proposes a new method using tri-way pixel-value differencing which is better than original PVD method with respect to the embedding capacity and PSN R.
-
3) Data Hiding by GLM
In 2004, Potdar et al. [38] proposes GLM (Gray level modification) technique which is used to map data by modifying the gray level of the image pixels. Gray level modification Steganography is a technique to map data (not embed or hide it) by modifying the gray level values of the image pixels. GLM technique uses the concept of odd and even numbers to map data within an image. It is a one-to-one mapping between the binary data and the selected pixels in an image.
-
B. Transform Domain Steganographic Method
Transform Domain methods hides messages in significant areas of cover image which makes them robust against various image processing operations like compression, enhancement etc. Many transform domain methods exist. The widely used transformation functions include Discrete Cosine Transformation (DCT), Fast Fourier Transform (DFT), and Wavelet Transformation. The basic approach to hiding information with DCT, FFT or Wavelet is to transform the cover image, tweak the coefficients, and then invert the transformation. If the choice of coefficients is good and the size of the changes manageable, then the result is pretty close to the original.
-
1) DCT based data hiding used in the JPEG compression algorithm to transform successive 8x8-pixel blocks of the image from spatial domain to 64 DCT coefficients each in frequency domain. The least significant bits of the quantized DCT coefficients are used as redundant bits into which the hidden message is embedded. The modification of a single DCT coefficient affects all 64 image pixels. Because this modification happens in the frequency domain and not the spatial domain, there are no noticeable visual
differences. The advantage DCT has over other transforms is the ability to minimize the block-like appearance resulting when the boundaries between the 8x8 sub-images become visible (known as blocking artifact). The statistical properties of the JPEG files are also preserved. The disadvantage is that this method only works on JPEG files since it assumes a certain statistical distribution of the cover data that is commonly found in JPEG files. Some common DCT based data hiding techniques are JSteg [12], JPHide [13], F5 [14] or OutGuess [15] for UNIX platform. Yet Another Steganographic Scheme (YASS) [16] another technique belongs to JPEG steganography. Some other DCT based steganographic work has been given in [17, 18] and [19].
-
2) Wavelet-based steganography [20-25] is a new idea in the application of wavelets. However, the standard technique of storing in the least significant bits (LSB) of a pixel still applies. The only difference is that the information is stored in the wavelet coefficients of an image, instead of changing bits of the actual pixels. The idea is that storing in the least important coefficients of each 4 x 4 Haar transformed block will not perceptually degrade the image. While this thought process is inherent in most steganographic techniques, the difference here is that by storing information in the wavelet coefficients, the change in the intensities in images will be imperceptible.
-
III. Bhattachayya and Sanyal’S Transformation
Bhattacharyya and Sanyal’s Transformation: Bhattacharyya and Sanyal proposed a new image transformation technique in [10], [11] known as Pixel Mapping Method (PMM), a method for information hiding within the spatial domain of any gray scale image. Embedding pixels are selected based on some mathematical function which depends on the pixel intensity value of the seed pixel and its 8 neighbors are selected in counter clockwise direction. Before embedding a checking has been done to find out whether the selected embedding pixels or its neighbors lies at the boundary of the image or not. Data embedding are done by mapping each two or four bits of the secret message in each of the neighbor pixel based on some features of that pixel. Figure 3 and Figure 4 shows the mapping information for embedding two bits or four bits respectively. Extraction process starts again by selecting the same pixels required during embedding. At the receiver side other different reverse operations has been carried out to get back the original information.
-
IV. wavelet transform
Wavelet domain techniques are becoming very popular because of the developments in the wavelet stream in the recent years. Wavelet transform is used to convert a signal from spatial domain into frequency domain. The use of wavelet in image stenographic model lies in the fact that the wavelet transform clearly separates the high frequency and low frequency information on a pixel by pixel basis.
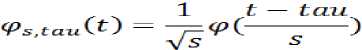
A continuous wavelet transform (CWT) is used to divide a continuous-time function into wavelets. More formally it is written as:
y(s, tau) — I fW SiCQ4ltdt
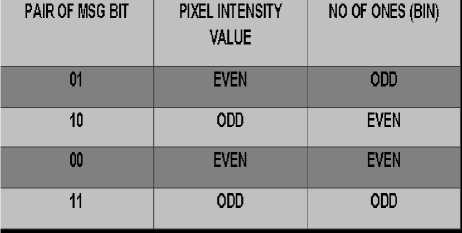
Figure 3. PMM Mapping Technique for embedding of two bits
|
MSG BIT SEQ |
2^d SET _ RESET BIT |
3rd SET - RESET BIT |
PIXEL INTENSITY VALUE |
NO OF ONES(BIN) |
|
0000 |
EVEN |
EVEN |
EVEN |
EVEN |
|
0001 |
EVEN |
EVEN |
EVEN |
ODD |
|
0010 |
EVEN |
EVEN |
ODD |
EVEN |
|
0011 |
EVEN |
EVEN |
ODD |
ODD |
|
0100 |
EVEN |
ODD |
EVEN |
EVEN |
|
0101 |
EVEN |
ODD |
EVEN |
ODD |
|
0110 |
EVEN |
ODD |
ODD |
EVEN |
|
0111 |
EVEN |
ODD |
ODD |
ODD |
|
1000 |
ODD |
EVEN |
EVEN |
EVEN |
|
1001 |
ODD |
EVEN |
EVEN |
ODD |
|
1010 |
ODD |
EVEN |
ODD |
EVEN |
|
1011 |
ODD |
EVEN |
ODD |
ODD |
|
1100 |
ODD |
ODD |
EVEN |
EVEN |
|
1101 |
ODD |
ODD |
EVEN |
ODD |
|
1110 |
ODD |
ODD |
ODD |
EVEN |
|
1111 |
ODD |
ODD |
ODD |
ODD |
Figure 4. PMM Mapping Technique for embedding of four bits where * denotes complex conjugation. This equation shows how a function f (t) is decomposed into a set of basic functions Vs,tau called the wavelets. The variables s and tau, scale and translation, are the new dimensions after the wavelet transform. The wavelets are generated from a single basic wavelet Vt the so-called mother wavelet, by scaling and translation
Discrete Wavelet Transform (DWT) is preferred over Discrete Cosine Transforms (DCT) because image in low frequency at various levels can offer corresponding resolution needed. A one dimensional DWT is a repeated filter bank algorithm, and the input is convolved with high pass filter and a low pass filter.
The result of latter convolution is smoothed version of the input, while the high frequency part is captured by the first convolution. The reconstruction involves a convolution with the synthesis filter and the results of this convolution are added. In two dimensional transform, first apply one step of the one dimensional transform to all rows and then repeat to all columns. This decomposition results into four classes or band coefficients. The Haar Wavelet Transform is the simplest of all wavelet transform. In this the low frequency wavelet coefficient are generated by averaging the two pixel values and high frequency coefficients are generated by taking half of the difference of the same two pixels. The four bands obtained are approximate band (LL), Vertical Band (LH), Horizontal band (HL), and diagonal detail band (HH). The approximation band consists of low frequency wavelet coefficients, which contain significant part of the spatial domain image. The other bands also called as detail bands consists of high frequency coefficients, which contain the edge details of the spatial domain image. This DWT decomposition of the signal continues until the desired scale is achieved .Two-dimensional signals, such as images, are transformed using the two-dimensional DWT. The twodimensional DWT operates in a similar manner, with only slight variations from the one-dimensional transform. Given a two-dimensional array of samples, the rows of the array are processed first with only one level of decomposition. This essentially divides the array into two vertical halves, with the first half storing the average coefficients, while the second vertical half stores the detail coefficients. This process is repeated again with the columns, resulting in four sub bands within the array defined by filter output. Fig 5 shows a one level decomposition using the two-dimensional DWT where LPF1 Represents low-pass filtering of the image rows, HPF1 represents high pass filtering of Image rows, LPF2 represents low-pass filtering of image columns, and HPF2 represents high-pass filtering of image columns. Since the discrete wavelet transform allows independent processing of the resulting components without significant perceptible interaction between them, hence it is expected to make the process of imperceptible embedding more effective .
LL
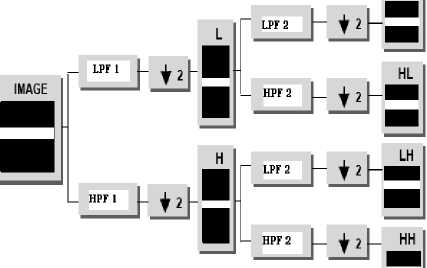
Figure 5. One-level decomposition using the two-dimensional DWT

-
V. THE PROPOSED METHODOLOGY DWTDM STEGANOGRAPHY
This paper presents a novel DWT difference based stenographic method in transform domain which is an enhanced idea of the Bhattacharyya and Sanyal’s Transformation [8], [37] in transform domain. Within a group of 8x8 DWT coefficients four seed pixels are selected and for each seed pixel its 3x3 neighborhood is selected as the valid embedding area. For each seed block the DWT difference between a pair of neighboring pixel is calculated. Arithmetic operation is further applied to map a pair of binary bits depending on the computed difference. The proposed system has been extensively tested on a variety of images with different textures. Experimental results demonstrate that the proposed system successfully preserves the quality of the images and stays undetected by the well-known steganalysis methods. Extraction process is resistant to compression and various image attacks and can be done effectively without the presence of original cover image. Figure 8 and 9 shows the pictorial description of embedding and extraction process respectively.
-
A. Embedding Algorithm
-
1) Get the Cover Image and Secret message.
-
2) Convert the secret message into binary notation so as to obtain individual bits of the message.
-
3) Perform the Discrete Wavelet Transform of the cover image with ‘haar’ wavelet, to obtain the four components, of DWT namely [cA, cD, cH, cV] Where, cA is the approximation coefficients matrix and cH, cV, and cD are the details coefficients matrices along horizontal, vertical, and diagonal, directions respectively, obtained by wavelet decomposition of the cover image matrix.
Thus if the cover image is of size MXN then we get 4 dwt resulting components namely, [cA, cD, cH, cV] each of size M/2 x N/2.
-
4) For each component cA, cD, cH and cV starting with cA: Divide the component into 8X8 block. So there’s going to be [MxN /256] blocks within each of the DWT components.
-
5) Normalize the DWT coefficients.
-
6) Do step 7-12 for each 8x8 block, until the entire secret message characters are embedded successfully.
-
7) Identify 4 seed pixels such that their 3x3 neighbor do not overlap.
X
X
X
X
-
8) Extract a 3 x 3 seed block surrounding each seed pixel
-
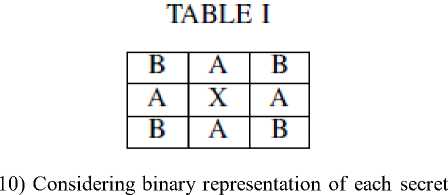
9) Now virtually enumerate the coefficients as given in Table I below:
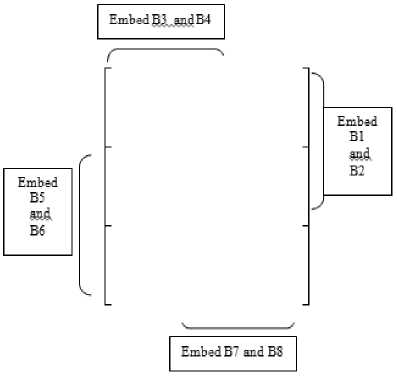
Figure 6. DWT difference table for embedding
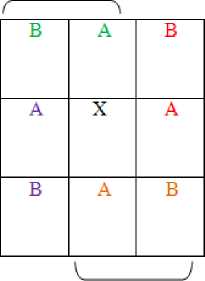
character, 2 bits secret data are mapped in the DWT coefficients as given in the following figure 6 and according to Table II
Table II: Mapping Table for Embedding
|
Message Bit |
Decimal Equivalent |
Sign of DWT difference |
Magnitude of DWT difference |
|
00 |
0 |
Negative |
2 |
|
01 |
1 |
Positive |
7 |
|
10 |
2 |
Negative |
12 |
|
11 |
3 |
Positive |
17 |
-
11) After mapping is complete, restore the fractional components of DWT coefficients.
-
12) Merge the 8X8 blocks back to form the Stego components [cA’, cD’, cH’, cV’].
-
13) Transform back from wavelet domain to spatial domain by inverse DWT of the stego DWT components [cA’, cD’, cH’, cV’] say using the similar ‘haar’ wavelet to get the Stego Image.
-
14) Compress the Stego Image to get the final image.
-
B. Extraction Algorithm
-
1) Get the compressed stego image.
-
2) Divide stego image into 8X8 blocks.
-
3) Get the dct coefficients of each 8X8 block.
-
4) Normalize the DWT coefficients.
-
5) Repeat the remaining steps until all the secret message characters are extracted.
-
6) Identify 4 seed pixels in each block to extract 4 characters from each block.
-
7) For each seed pixel fetch a 3x3 neighborhood around each seed pixel.
-
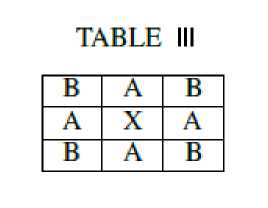
8) Now assume the coefficients to be named as given in Table III .
-
9) From each [A B] combination extract 2 bits of secret binary message stream as given in figure 7 and Table IV.
Extract B3 and B4
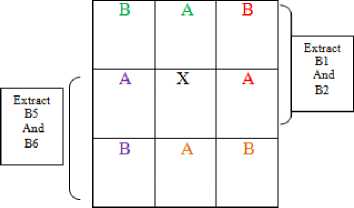
Extract В" and BS
Figure 7. DWT difference table for extraction
-
10) The inverse mapping is done as follows:
Table IV: Mapping Table for Extraction
|
Sign of DWT difference |
Magnitude of DWT difference |
Extracted Message bits |
|
Positive |
0-4 |
00 |
|
Negative |
5-9 |
01 |
|
Negative |
10-14 |
10 |
|
Positive |
15-19 |
11 |
-
VI. EXPERIMENTAL RESULTS
In this section the authors present the experimental results of the proposed method based on two benchmarks techniques to evaluate the hiding performance. First one is the capacity of hiding data and another one is the imperceptibility of the stego image, also called the quality of stego image. The quality of stego image produced by the proposed method has been tested exhaustively based on various image similarity metrics namely MSE, RMSE, PSNR, SSIM, Shannon’s
Entropy, KL divergence distances and Normalized Cross-correlation. Figure 10 shows the color image of Lena as cover and stego image after embedding 16000 characters where as Table V shows the calculated value of various image similarity metrics for various colour stego images and of different dimensions and Table VI shows the shows the calculated value of various image similarity metrics for various gray scale stego images with different dimensions.
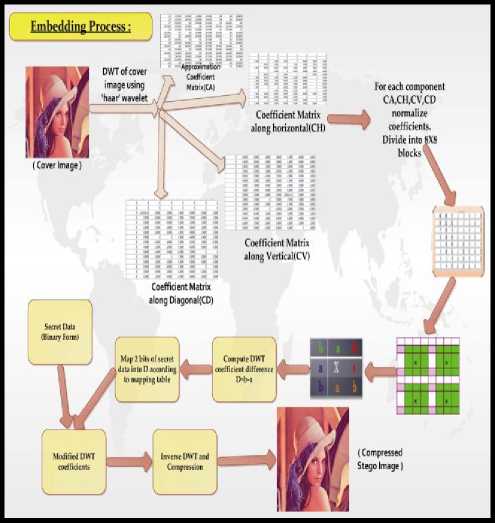
Figure 8. Pictorial Description of embedding algorithm
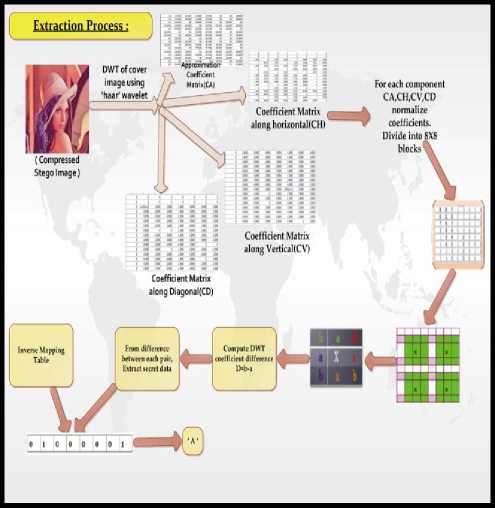
Figure 9.Pictorial Description of extraction algorithm
-
A. Mean Squared Error (MSE), Root Mean Squared Error (RMSE) and Peak Signal to Noise Ratio (PSNR)
The peak signal-to-noise ratio (PSNR) is the ratio between a signal’s maximum power and the power of the signal’s noise. Engineers commonly use the PSNR to measure the quality of reconstructed signals that have been compressed. Signals can have a wide dynamic range, so PSNR is usually expressed in decibels, which is a logarithmic scale. In statistics, the mean squared error (MSE) of an estimator is one of many ways to quantify the difference between values implied by an estimator and the true values of the quantity being estimated. MSE is a risk function, corresponding to the expected value of the squared error loss or quadratic loss. MSE measures the average of the squares of the”errors.” The error is the amount by which the value implied by the estimator differs from the quantity to be estimated. PSNR measures the quality of the image by comparing the original image or cover image with the stego-image, i.e. it measures the percentage of the stego data to the image percentage.
The root-mean-square deviation (RMSD) or rootmean-square error (RMSE) is a frequently used measure of the differences between values predicted by a model or an estimator and the values actually observed from the thing being modeled or estimated. RMSD is a good measure of accuracy. These individual differences are also called residuals, and the RMSD serves to aggregate them into a single measure of predictive power.
The PSNR is used to evaluate the quality of the stego-image after embedding the secret message in the cover. Assume a cover image C (i,j) that contains N by N pixels and a stego image S(i,j) where S is generated by embedding / mapping the message bit stream. Mean squared error (MSE) of the stego image is calculated as equation 3.
MSE = 1 2^ 2^ [ C(i у) S(i У)] 2 (3)
The PSNR is computed using the following formulae given in Equation 4:
PSNR = 10 log 10 255 2 / MSE db. (4)
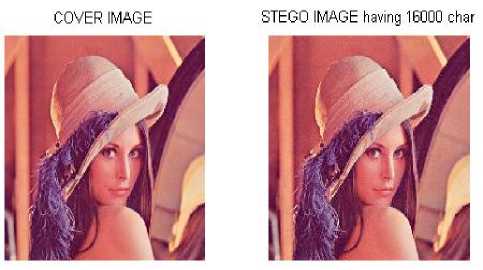
Figure 10. A) Cover Image B) Stego Image of Lena as Color Image after embedding 16000 characters
-
B. Structural Similarity (SSIM)
The structural similarity (SSIM) [27] index is a method for measuring the similarity between two images. The SSIM index is a full reference metric, in other words, the measuring of image quality based on an initial uncompressed or distortion-free image as reference. SSIM is designed to improve on traditional methods like peak signal-to-noise ratio (PSNR) and mean squared error (MSE), which have proved to be inconsistent with human eye perception.
The SSIM metric is calculated on various windows of an image. The measure between two images x and y of common size N x N is:
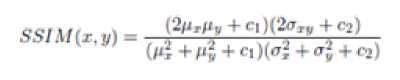
Where ^т the average of Ж, № is the average of у, the variance of 3, Уу the variance of у, O"iy the covariance of X and У,ci = (^i£) , С2=(к2£) two variables to stabilize the division with weak denominator. L is the dynamic range of the pixel-values and ki =0.01 and /1’2=0.03by default.
C. Kullback Leibler Divergence
In probability theory and information theory, the Kullback-Leibler Divergence [26] (also information divergence, information gain, relative entropy, or KLIC) is a non-symmetric measure of the difference between two probability distributions P and Q. KL measures the expected number of extra bits required to code samples from P when using a code based on Q, rather than using a code based on P. Typically P represents the ”true” distribution of data, observations, or a precisely calculated theoretical distribution. The measure Q typically represents a theory, model, description, or approximation of P. Although it is often intuited as a metric or distance, the KL divergence is not a true metric for example, it is not symmetric: the KL from P to Q is generally not the same as the KL from Q to P. For probability distributions P and Q of a discrete random variable their KL divergence is defined to be
D KL ( P || Q ) = ∑ P ( i ) log P ( i ) (6)
In words, it is the average of the logarithmic difference between the probabilities P and Q , where the average is taken using the probabilities P . The K-L divergence is only defined if P and Q both sum to 1 and if Q ( i ) > 0 for any i such that P ( i ) > 0. If the quantity 0log0 appears in the formula, it is interpreted as zero. For distributions P and Q of a continuous random variable, KL-divergence is defined to be the integral
∞
D KL ( P || Q )= ∫ p ( x )log
-∞
p ( x ) dx q ( x )
where p and q denote the densities of P and Q . More generally, if P and Q are probability measures over a set X , and Q is absolutely continuous with respect to P , then the Kullback–Leibler divergence from P to Q is defined as
D kl ( P II Q ) --J log dQdP (8)
x dP where dQ is the Radon–Nikodym dP derivative of Q with respect to P, and provided the expression on the right-hand side exists. Likewise, if P is absolutely continuous with respect to Q, then
, ap , ap ap
D kl ( P II Q ) = J log — "P =J—log — "Q (9)
-
x dQ xdQ dQ
which we recognize as the entropy of P relative to Q . Continuing in this case, if μ is any measure on X for which p = dP and q = dQ exist, then the Kullback- "ц dp
Leibler divergence from P to Q is given as
Dkl ( P || Q ) =f P log p" P (10)
x q
The logarithms in these formulae are taken to base 2 if information is measured in units of bits, or to base e if information is measured in nats.
Steganography Security using Kullback Leibler Divergence: Denoting C the set of all covers c, Cachin’s definition of steganographic security [10] is based on the assumption that the selection of covers from C can be described by a random variable c on C with probability distribution function (pdf) P. A steganographic scheme, S, is a mapping C x M x K → C that assigns a new (stego) object, s ε C, to each triple (c,M,K), where M ε M is a secret message selected from the set of communicable messages, M, and K ε K is the steganographic secret key. Assuming the covers are selected with pdf P and embedded with a message and secret key both randomly (uniformly) chosen from their corresponding sets, the set of all stego images is again a random variable s on C with pdf Q. The measure of statistical detectability is the Kullback Leibler divergence as given in equation 11.
D ( P i Q ^-YP (c ) lg Qc )
Stego system is called ε-secure against passive attackers, if D ( P || Q ) ≤ ε and perfectly secure if ε = 0.
-
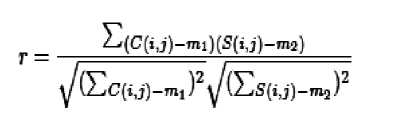
D. Cross Correlation
For comparing the similarity between cover image and the stego image, the normalized cross correlation coefficient (r) has been computed. Cross correlation is a standard method of estimating the degree to which two series are correlated. Consider two series x(i) and y(i) where i = 0,1,2,. . . , N-1. The cross correlation r at delay d is defined as
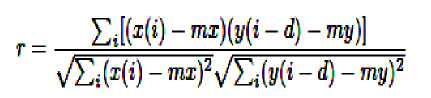
where mx and my are the means of the corresponding series. Similarity measure of two images can be done with the help of normalized cross correlation generated from the above concept using the following formula:
-
E. Entropy
In information theory, Entropy is a measure of the uncertainty associated with a random variable. In this context, the term usually refers to the Shannon Entropy, which quantifies the expected value of the information contained in a message, usually in units such as bits. In this context, a 'message' means a specific realization of the random variable. Equivalently, the Shannon Entropy is a measure of the average information content one is missing when one does not know the value of the random variable. The concept was introduced by Claude E. Shannon [28] in his 1948 paper "A Mathematical Theory of Communication”.
Named after Boltzmann's H-theorem, Shannon denoted the entropy H of discrete random variable X with possible values { x 1 , ... , xn } as,
Here E is the expected value, and I is the information content of X . I ( X ) is itself a random variable. If p denotes the probability mass function of X then the entropy can explicitly be written as
1=1 1 = 1 P^u t=l where b is the base of the logarithm used. Common values of b are 2, Euler's number e, and 10, and the unit of entropy is bit for b = 2, nat for b = e, and dit (or digit) for b = 10.
-
VII. ATTACKS ON STEGO IMAGES
Table V: Calculation of various Image Similarity Metrics for DWTDM Stego Color Images of Different Dimensions
|
Images |
LEN6IH OF 1HEEMBEDDING CHARACTER |
|||||||
|
IW |
500 |
1000 |
ЗШ |
5000 |
10000 |
16000 |
||
|
Lena 511X511 |
P9IR |
60.1077 |
50.1679 |
45.545! |
38.25! |
14.917 |
32.129 |
29.7319 |
|
BE |
M34 |
0.6256 |
15137 |
9.7206 |
10.957 |
36.917 |
69.1511 |
|
|
PICE |
№17 |
03116 |
0.5770 |
2.0210 |
2.1243 |
19193 |
5.0180 |
|
|
SSIM |
№95 |
№8! |
0.9974 |
0.9901 |
0.9534 |
0.9743 |
0.9743 |
|
|
Correlation |
1.0000 |
№9! |
0.9997 |
0.9916 |
0.99 7 0 |
UM |
0.9901 |
|
|
KKIvergence |
Ш |
■6.0126eW |
0.0032 |
0.0166 |
0.0716 |
0.1238 |
0.0188 |
|
|
Enlropv |
7.5943 |
7.5955 |
7.5961 |
7.6029 |
7.6094 |
7.6106 |
7.6197 |
|
|
Compression ratio |
№64 |
0.6077 |
0.6016 |
0.6115 |
0.6154 |
0.6151 |
0.6343 |
|
|
Lena 156X256 |
Р» |
411576 |
37.1680 |
32.972! |
27.761 |
25529 |
№4 |
№4 |
|
USE |
№81 |
12.4820 |
3279» |
101.66 |
169.56 |
№4 |
№4 |
|
|
PIM |
0.4232 |
1.6472 |
25025 |
5.0710 |
5.9919 |
№4 |
№4 |
|
|
Correlation |
№95 |
0.9982 |
0.9954 |
0.9546 |
0.97 59 |
№4 |
№4 |
|
|
KLdlverpence |
■6.M4 |
0.0460 |
0.1579 |
0.6053 |
0.4755 |
№4 |
№4 |
|
|
Enlropv |
7.6320 |
7.6356 |
7.6465 |
7.6506 |
7.6524 |
№4 |
№4 |
|
|
Compression ratio |
№82 |
0.6715 |
0.6755 |
0.6591 |
0.6931 |
№4 |
№4 |
|
|
Lena 128X121 |
PSUff |
36.6622 |
274157 |
23.6694 |
№ |
№4 |
№4 |
№4 |
|
USE |
133923 |
117.8138 |
279.346 |
№ |
№4 |
№4 |
№4 |
|
|
RUSE |
1.5459 |
4.7380 |
6.6663 |
№ |
№4 |
№4 |
№4 |
|
|
Correlation |
№11 |
0.913! |
0.9603 |
№4 |
№4 |
№4 |
||
|
KLdlvergence |
№61 |
0.6284 |
0.1410 |
№ |
№4 |
№4 |
№4 |
|
|
Enlropv |
7.6260 |
7.6823 |
7.6419 |
№ |
№4 |
№4 |
№4 |
|
|
Compression Ratio |
№87 |
0.7151 |
0.7227 |
№ |
№4 |
№4 |
№4 |
|
|
Pepper 512X51! |
PSRR |
175009 |
32.3339 |
310635 |
31.025 |
29.963 |
26.152 |
26.7269 |
|
USE |
1.6789 |
37.9121 |
402001 |
51516 |
65.56! |
97.146 |
115.1911 |
|
|
HIM |
0.4070 |
1.1915 |
1.4371 |
2.2775 |
2.8991 |
3.9694 |
6.1103 |
|
|
SSIM |
№97 |
0.9989 |
0.1975 |
0.9916 |
0.9551 |
0.9764 |
0.9765 |
|
|
Correlation |
№99 |
0.9957 |
0.1954 |
0.9941 |
0.9125 |
0.9139 |
0.9543 |
|
|
KLdlverpence |
MH |
0.9594 |
0.1626 |
1.0148 |
1.115! |
2.6170 |
3.8252 |
|
|
Entepv |
7.4975 |
7.5042 |
7.5062 |
7.5260 |
7.5407 |
7.5657 |
7.5530 |
|
|
Compression Ratio |
0.5456 |
0.6465 |
0.6473 |
0.6509 |
0.65 4 2 |
0.6619 |
0.6706 |
|
|
Pepper 256X255 |
PS№ |
ЗШ71 |
30.4832 |
2ШЙ |
25.051 |
14515 |
№4 |
№4 |
|
USE |
135547 |
51.1751 |
57.7175 |
203.21 |
240.7! |
№4 |
№4 |
|
|
RUSE |
1.2773 |
2.1509 |
3.20# |
5.0115 |
5.5111 |
№4 |
№4 |
|
|
Correlation |
0.9974 |
0.2261 |
0.9901 |
0.9771 |
0.9719 |
№4 |
№4 |
|
|
KLdlvergence |
0.0141 |
0.2261 |
0.4461 |
1.62$ |
1.7344 |
№4 |
№4 |
|
|
Enlropv |
7.5640 |
7.5773 |
0.6319 |
7.6165 |
7.6004 |
№4 |
№4 |
|
|
Compression Ratio |
№83 |
0.6272 |
0.6319 |
0.649! |
0.6516 |
№4 |
№4 |
|
|
Pepper 128X121 |
PSIJF' |
29.0007 |
24.2805 |
217506 |
№ |
№4 |
№4 |
№4 |
|
USE |
115479 |
242.6784 |
434.526 |
№4 |
№4 |
№4 |
||
|
HIM |
2.6760 |
5.0898 |
6.7616 |
№ |
№4 |
№4 |
№4 |
|
|
Correlation |
№10 |
0.9732 |
0.9521 |
Ml |
№4 |
№4 |
№4 |
|
|
KLdlverpence |
0.6296 |
2.1569 |
45491 |
№ |
№4 |
№4 |
№4 |
|
|
Enlropv |
7.6136 |
7.6634 |
7.6421 |
№4 |
№4 |
№4 |
||
|
Compression Ratio |
0.7014 |
0.7161 |
0.7296 |
№4 |
№4 |
№4 |
||
Table VI: Calculation of various Image Similarity Metrics for DWTDM Stego Gray Scale Images of Different Dimensions
|
Images |
LENGTH OF THE EMBEDDING CHARACTER |
|||||||
|
IM |
son |
1000 |
W |
Sill |
toooo |
16000 |
||
|
Lem 512X512 |
PSNR |
54.3471 |
47.1712 |
43.4591 |
36.557 |
33.114 |
30.330 |
27.8647 |
|
MSB |
123* |
UI* |
2.9310 |
14367 |
31.740 |
60.156 |
106.3100 |
|
|
BMSE |
mm |
1.3459 |
0.6191 |
1.4732 |
11690 |
3.0219 |
3.9705 |
|
|
SSIM |
М2 |
1.9970 |
0.9918 |
0.9737 |
0.9546 |
0.9290 |
0.9294 |
|
|
Correlation |
1.9999 |
1.9996 |
O.5I99O |
0.9949 |
0.9818 |
0.9719 |
0.9626 |
|
|
KL divergence |
■2.88371. UM |
■769JM4 |
3.0098 tW |
0145 |
M445 |
0.0820 |
OWi |
|
|
Entropy |
7.0887 |
7.1896 |
7.0913 |
7.0996 |
7.1067 |
7.1211 |
7.122! |
|
|
Compression ratio |
15674 |
1.5724 |
0.5781 |
0.6007 |
06253 |
0.6783 |
0.7215 |
|
|
Una 256X256 |
PSNR |
417941 |
33.3612 |
29.3931 |
24.43! |
12691 |
MA |
MA |
|
MSB |
17144 |
29.9889 |
74.7773 |
2M31I4 |
349.8577 |
MA |
MA |
|
|
BMSE |
13891 |
1.4955 |
2.5481 |
4 5930 |
5.4681 |
MA |
MA |
|
|
SSIM |
19942 |
19573 |
0.9085 |
0.7399 |
11.6418 |
MA |
MA |
|
|
Correlation |
19995 |
1.9945 |
UHM |
0.9574 |
0.9365 |
MA |
MA |
|
|
KL divergence |
ti№ UM |
I №9 |
0.1195 |
0.2313 |
0.0189 |
MA |
MA |
|
|
Entropy |
7.5699 |
7.5754 |
7.5841 |
7.6022 |
7.5938 |
MA |
MA |
|
|
Compression ratio |
1.6957 |
1.7153 |
1.7369 |
1.8130 |
0.8404 |
MA |
MA |
|
|
128X128 |
PSNR |
311(175 |
23.1722 |
19.5901 |
MA |
MA |
MA |
MA |
|
MSB |
MB |
313.1198 |
714601 |
№ |
MA |
MA |
MA |
|
|
IMSE |
1.5581 |
46830 |
6.4915 |
MA |
MA |
MA |
MA |
|
|
SSIM |
1.9617 |
18053 |
0.5695 |
№ |
MA |
MA |
MA |
|
|
Correlation |
19927 |
1.9416 |
0.8697 |
MA |
MA |
MA |
MA |
|
|
KL divergence |
11205 |
1.8739 |
0.1569 |
MA |
MA |
MA |
MA |
|
|
Entropy |
7.5636 |
7.5917 |
7.5865 |
MA |
MA |
MA |
MA |
|
|
Compression Ratio |
18428 |
1.9032 |
0.9341 |
MA |
MA |
MA |
MA |
|
|
Pepper 512X512 |
PSNR |
568493 |
47.1712 |
47.6718 |
38036 |
34472 |
31.537 |
31.0207 |
|
MSB |
11343 |
1.1139 |
1.1115 |
10.219 |
13220 |
45.637 |
514054 |
|
|
IMSE |
11533 |
13439 |
0.2138 |
1.8206 |
1.2397 |
1.6068 |
1.7045 |
|
|
SSIM |
19993 |
19970 |
0.9936 |
09761 |
19554 |
0.9219 |
0.921! |
|
|
Correlation |
LU* |
19996 |
0.9997 |
09977 |
0.9947 |
0.9897 |
0.9814 |
|
|
KL divergence |
■№ IM |
■7.693M4 |
■Ш12 |
■0.0031 |
■0004 |
■0.007 |
■0.0071 |
|
|
Entropv |
69811 |
7.1896 |
69940 |
7.0066 |
7.0116 |
7.0157 |
7.02118 |
|
|
Compression Ratio |
1.3467 |
1.5724 |
0.3771 |
0.4399 |
0.5002 |
16176 |
0.6656 |
|
|
Pepper 256X1=4 |
PSNR |
51.1515 |
33.3612 |
33.4211 |
28860 |
18669 |
MA |
MA |
|
MSB |
1.6280 |
19.9889 |
29.5773 |
14537 |
88332 |
MA |
MA |
|
|
BMSE |
11290 |
1.4955 |
1.6341 |
2.4576 |
15111 |
MA |
MA |
|
|
SSIM |
1.9951 |
1.9573 |
0.9331 |
08418 |
0.0241 |
MA |
MA |
|
|
Correlation |
1.9999 |
19N5 |
0.9931 |
09807 |
0.1798 |
MA |
MA |
|
|
KL divergence |
■5.9lfe. UM |
1.1469 |
0.1195 |
■0.0035 |
■0.103 |
MA |
MA |
|
|
Entropv |
69863 |
7.5754 |
711041 |
7.0147 |
7.0155 |
MA |
MA |
|
|
Compression Ratio |
15543 |
1.7153 |
0.6086 |
0.7012 |
0.7234 |
MA |
MA |
|
|
Pepper 128X128 |
PSNR |
311075 |
240884 |
22.1041 |
MA |
MA |
MA |
MA |
|
MSB |
«252 |
253.6548 |
400.562 |
MA |
MA |
MA |
MA |
|
|
BMSE |
1.5584 |
4.1394 |
5.0831 |
MA |
MA |
MA |
MA |
|
|
SSIM |
1.9754 |
1.7845 |
0.6476 |
MA |
MA |
MA |
MA |
|
|
Correlation |
1.9927 |
1.9410 |
0.9087 |
MA |
MA |
MA |
MA |
|
|
KL divergence |
11205 |
1.1732 |
0.0141 |
MA |
MA |
MA |
MA |
|
|
Entropy |
7.5636 |
7.1334 |
7.0201 |
MA |
MA |
MA |
MA |
|
|
Compression Ratio |
1.8428 |
17907 |
0.8295 |
MA |
MA |
MA |
MA |
|
-
VIII. ANALYSIS ON STEGO IMAGES
To access the security of the steganography algorithms the development of steganalysis attack is necessary. In this work all the stego images produced by DWTDM algorithms has been tested on two types on well known steganalysis attack namely Chi-square Analysis and RS Steganalysis.
Table VII. Noise Attack on DWTDM method for LENA RGB image with embedding length of 16000 char
|
Noise Type |
Noise Scalar value |
Character error rate (in %) |
|
Gaussian |
Mean=0.001, Variance=O. OOOOO1 |
0.4313 |
|
Salt & Pepper |
0.0002 |
0.5125 |
|
Gaussian |
Means 0.005» Variance=O.000005 |
6.1437 |
|
Salt & Pepper |
0.0005 |
1.2875 |
|
Gaussian |
Mean= 0.005, Variance=O.000009 |
15.8938 |
|
Salt & Pepper |
0.0009 |
2.2188 |
|
Gaussian |
Means 0.001, Variance=0.00001 |
17.6875 |
|
Salt & Pepper |
O.0O1 |
1.9875 |
|
Gaussian |
Mean= O.OOI. Variance=0.00002 |
38.5375 |
|
Salt & Pepper |
0.003 |
7.2062 |
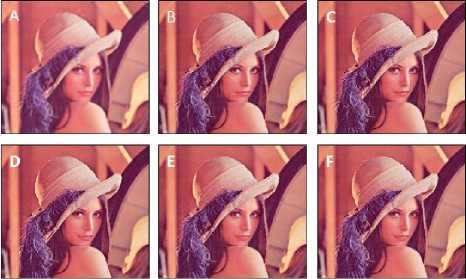
Figure 11. Gaussian Noise attack on DWTDM method for LENA (512x512) images (A-F) having various Scalar values
Table VIII: Image Compression Ratio for DWTDM Stego RGB Image (Pepper 512 x512)
|
Length of Embedding Characters |
Compression Ratio |
Percentage of size reduction |
|
500 |
0.6465 |
35.3462 |
|
1000 |
0.6473 |
35.2653 |
|
3000 |
0.6509 |
34.9107 |
|
5000 |
0.6542 |
34.5829 |
|
10000 |
0.6619 |
33.8140 |
|
16000 |
0.6706 |
32.9445 |
Table IX. Image Compression Ratio for DWTDM Stego RGB Image (Pepper 512 x512)
|
Length of Embedding Characters |
Compression Ratio |
Percentage of size reduction |
|
100 |
0.5674 |
43.2553 |
|
500 |
0.5724 |
42.7646 |
|
1000 |
0.5781 |
42.1864 |
|
3000 |
0.6007 |
39.9256 |
|
5000 |
0.6253 |
37.4685 |
|
1OOOO |
0.6783 |
32.1694 |
|
16000 |
0.7215 |
27.8491 |
-
1) Statistical attack: Chi-Square Analysis:
Andreas Pfitzmann and Andreas Westfield [29] introduced a method based on statistical analysis of Pair of Values (PoVs) that are exchanged during sequential embedding. This attack works on any sequential embedding type of stego-system such as EzStego and JSteg. Sequential embedding makes PoVs in the values embedded in. For example, embedding in the spatial domain makes PoVs (2i, 2i +1) such that 0 ^ > 1, 2 ^ > 3, 4 w 5, , 252 w 253, 254 w 255. This will affect the histogram Y k of the images pixel value k, while the sum of Y 2i + Y 2i+1 will remain unchanged. Thus the expected distribution of the sum of adjacent values given in (16) and the value for the difference between distributions with v -1 degrees of freedom as in (17). From (16) and (17) the χ 2 statistic for the PoVs can be found out as given in (18).
ОД.) = 5 (124 + 1'24+1 )(
-
25^ (F-E^y(17)
^ E^F)
((l'2.)-(5(l'2- + l'2«+i)))2 (12. + 1'2.4 1) ’'
Chi-Square Analysis calculates the average LSB and constructs a table of frequencies and Pair of Values [31]. It takes the data from these two tables and performs a chi-square test. It measures the theoretical vs. calculated population difference. Figure 12 and 13 shows the various results of the Chi Square Analysis based on the DWTDM methods.
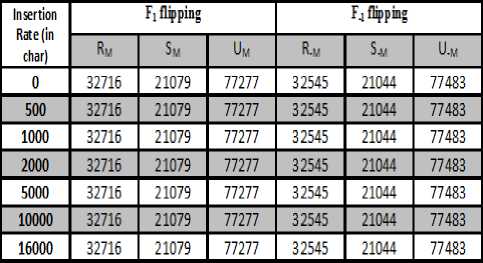
Statistical attack: RS Analysis: Fridrich et al. [30] introduced a powerful, yet complex, steganalytic method that is able to accurately estimate the length of the embedded message on a digital image, for several LSB steganographic methods. The method is based on the fact that the content of each bit plane of an image is correlated with the remaining bit planes. In particular, for an 8-bit image, there is some degree of correlation between the LSB plane and the other seven bit planes. When a message is inserted in the LSB plane, its content is considered to become randomized, and thus the correlation between the LSB planes with the remaining bit planes is reduced or lost. Let I be the image to be analyzed having width W and height H pixels. Each pixel has been denoted as P i.e. for a Gray Scale Image (8 bits per pixel image), value of P = 0, 1,. . . 255. Next step is to divide I into G disjoint groups of n adjacent pixels. For instance n can be = 4 .Next define a discriminant function f which is responsible to give a real number f(x 1 ,….., x n ) ε R for each group of pixels G = (x 1 ,….., x n ). The objective is to capture the smoothness of G using f. Let the discrimination function be
-
71— 1
Furthermore, let F1 be a flipping invertible function F1: 0 ^ > 1, 2 ^ > 3, . . . , 254 ^ >255, and F -1 be a shifting function denoted as F -1 : -1 ^ >0, 1 ^ >2, . . . , 255 ^ >256 over P. For completeness, let F0 be the identity function such as F 0 (x) = x for all x ε P: Define a mask M that represents which function to apply to each element of a group G. The mask M is an n-tuple with values in -1, 0, 1. The value -1 stands for the application of the function F -1 , 1 stands for the function F 1 and 0 stands for the identity function F 0 . Similarly, define -M as M’s compliment. Next step is to apply the discriminant function f with the functions F-1,0,1 defined through a mask M over all G groups to classify them into three categories Regular (R), Singular (S) and Unchanged (U) - depending on how the flipping changes the value of the discrimination function.
-
• Regular groups: GeRm <=> f^F^G^ > /(G) . Singular groups: GeSM ^ f(F(G)) < /(G) • Unusable groups: GeUm <+ /(F(G')') = f(G)
In similar manner R -M , S -M and U -M can be defined for -M such that (R M +S M )/2 ≤T and (R -M +S -M )/2 ≤T, where T is the total number of G groups.
The conclusion of RS Analysis method describes that, for typical images R M ≈ R -M and S M ≈ S -M and no change in R and S value for embedding character of various sizes. Results of RS analysis in various stego images having different embedding capacity have been shown in Table X and figure 14.
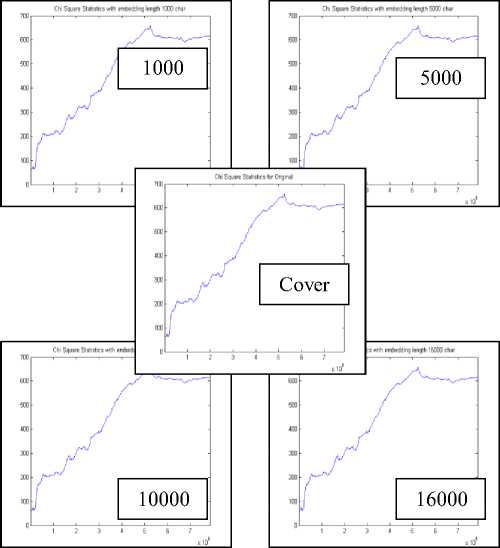
Figure 12. Plot of Chi Square Statistics for DWTDM based LENA image (512x512) as Stego of various embedding capacity (in char)
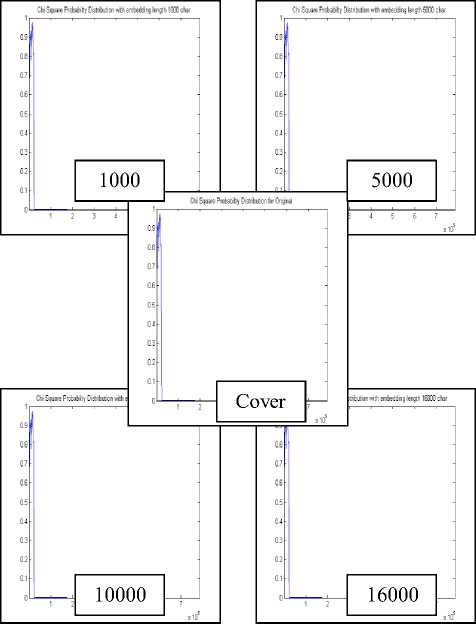
Figure 13. Plot of Chi Square Probability Distribution for DWTDM based LENA image (512x512) as Stego of various embedding capacity (in char)
Table X. RS Parameter at various insertion rates for DWTDM steganographic images (LENA 512x512)
-
IX. COMPARISON WITH OTHER EXISTING METHODS
In this section a comparative study has been taken up with some other existing methods in spatial domain like Least-significant-bit (LSB) [9], [11], PVD method proposed by Wu and Tsai [42], GLM [16] by Potdar et al. and in transform domain like [20], [13]and [28]. From the comparative study it can be concluded that DWTDM method is better in terms of embedding capacity and moderate PSNR. Besides this method can avoid various Image attacks compared to others effectively and works well both in compressed and uncompressed domain. In addition various image similarity metrics has been also calculated in this method which was not taken up in other existing methods. Table XI, XII and XIII shows the comparison of DWTDM Steganography method with other existing methods in various domains.
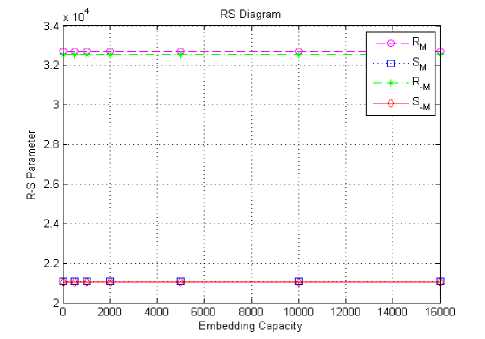
Figure 14. RS Diagram at various insertion rates for DWTDM Steganographic images (LENA 512x512)
Table XI: Comparison of DWTDM with other Spatial Domain Methods
|
LSB[33],PVD[36-37],GLM[38] |
DWTDM |
|
All are spatial domain techniques. Data can be easily tractable from raw pixel intensities and falter from most types of image attacks. Works only on uncompressed image. For evaluating performance only MSE and PSNR has been incorporated. Security of the hidden data not tested. |
Transform domain technique, extraction from wavelet coefficients which is far more complex but robust against any type of image attacks. Works on both uncompressed and compressed image. Except MSE and PSNR various other image similarity metric parameters has been incorporated. Security of the hidden data is very high. |
Table XII: Comparison of DWTDM with other DCT Domain 0.3
|
BLR [18] and works by Danti et al [17] and works by Lin et al [19] on DCT Steganography |
DWTDM |
|
All are transform domain techniques works by modifying the dct coefficients. 1 bit mapping technique means embedding capacity is lower. Works only on uncompressed image. Security of the hidden data not tested. Not tested against various image attacks |
Transform domain technique works by modifying wavelet coefficients. 2 bit mapping technique means embedding capacity is high. Works on both uncompressed image and compressed image. Security of the hidden data is very high. Tested against various image attacks like noise addition, compression etc. |
Table XIII: Comparison of DWTDM with other DWT Domain Methods
|
Ataby et al. [18] and works by Reddy and Raja [25] on DWT Steganography |
DWTDM |
|
All are transform domain techniques works by modifying the wavelet coefficients. 1 bit mapping technique means embedding capacity is lower. Works only on uncompressed image. Security of the hidden data not tested. Not tested against various image attacks |
Transform domain technique works by modifying wavelet coefficients. 2 bit mapping technique means embedding capacity is high. Works on both uncompressed image and compressed image. Security of the hidden data is very high. Tested against various image attacks like noise addition, compression etc. |
-
X. Conclusions
This work dealt with the techniques for steganography in DWT domain as related to image science. A new and efficient steganographic method for embedding secret messages into images without producing any major changes has been proposed. From the comparative study it has been seen this method is better compared to others in terms of various image similarity parameters. Embedding capacity of this method is much better than other exiting methods in transform domain. Beside this method is a robust method which can avoid various image attacks noise addition, compression. From the security aspects the relative entropy distance (KL divergence) is very low between the cover image and stego image which yields a very high security value of the hidden data. The hidden message also stays undetected after application of some well known steganalysis method on it. This method is also capable of extracting the secret message without the cover image.
References A Robust Image Steganography using DWT Difference Modulation (DWTDM)
- Gustavus J. Simmons, The Prisoners' Problem and the Subliminal Channel, Proceedings of CRYPTO ,83(1984) 51-57.
- RJ Anderson, Stretching the Limits of Steganography, Information Hiding, Springer Lecture Notes in Computer Science, 1174 (1996) 39-48.
- Scott. Craver, On Public-key Steganography in the Presence of an Active Warden, Proceedings of 2nd International Workshop on Information Hiding., (1998) 355-368.
- Ross J. Anderson. and Fabien A.P.Petitcolas,On the limits of steganography, IEEE Journal on Selected Areas in Communications (J-SAC), Special Issue on Copyright and Privacy Protection,16(1998) 474-481.
- N.F.Johnson. and S. Jajodia, Steganography: seeing the unseen, in IEEE Computer, 16(1998) 26-34.
- T Mrkel., JHP Eloff and MS Olivier, An Overview of Image Steganography, in Proceedings of the fifth annual Information Security South Africa Conference, (2005).
- Souvik Bhattacharyya and Gautam Sanyal, Study of Secure Steganography model, in Proceedings of International Conference on Advanced Computing and Communication Technologies,(2008).
- Souvik Bhattacharyya and Gautam Sanyal, Implementation and Design of an Image based Steganographic model, in Proceedings of IEEE International Advance Computing Conference,(2009).
- Souvik Bhattacharyya and Gautam Sanyal, An Image based Steganography model for promoting Global Cyber Security, in Proceedings of International Conference on Systemics, Cybernetics and Informatics,(2009).
- Souvik Bhattacharyya. and Gautam Sanyal. Hiding data in images using pixel mapping method (PMM). In Proceedings of 9th annual Conference on Security and Management (SAM) under The 2010 World Congress in Computer Science, Computer Engineering, and Applied Computing(World Comp 2010), Las Vegas, USA, July 12-15,2010.
- Souvik Bhattacharyya, Lalan Kumar and Gautam Sanyal. A novel approach of data hiding using pixel mapping method (PMM). International Journal of Computer Science and Information Security (IJCSIS), 8, 2010
- Derek Upham. Jsteg http://zooid.org/~paul/crypto/jsteg/.
- Allan Latham. Jphide, http://linux01.gwdg.de/~alatham/ stego.html.
- Andrew Westfeld. F5-a steganographic algorithm: high capacity despite better steganalysis. In Proceedings of the 4th Information Hiding Workshop, volume 2137 of LNCS, pages 289{302. Springer, 2001.
- J. Fridrich, M. Goljan, and D. Hogea. Attacking the outguess. In Proceedings of 2002 ACM Workshop on Multimedia and Security, pages 3{6. ACM Press, 2002.
- K. Solanki, A. Sarkar, and B. S. Manjunath. Yass: Yet another steganographic scheme that resists blind steganalysis. In Proceedings of the 9th Information Hiding Workshop, volume 4567 of LNCS, pages 16{31. Springer, 2007.
- Ajit Danti and Preethi Acharya. Randomized embedding scheme based on dct coefficients for image steganography. IJCA Special Issue on Recent Trends in Image Processing and Pattern Recognition, 2010.
- R K Chhotaray K B Shiva Kumar, K B Raja and Sabyasachi Pattanaik. Bit length replacement steganography based on dct coefficients. International Journal of Engineering Science and Technology, 2:3561–3570, 2010.
- Chia-Chen Lin. High capacity data hiding scheme for dct-based images. Journal of Information Hiding and Multimedia Signal Processing, 1, 2010.
- Ali Al-Ataby and Fawzi Al-Naima. A modified high capacity image steganography technique based on wavelet transform. The International Arab Journal of Information Technology, 7:358–364, 2010.
- Bo Yang and Beixing Deng. Steganography in gray images using wavelet. In Proceedings of ISCCSP 2006.
- Po-Yueh Chen and Hung-Ju Lin. A dwt based approach for image steganography. International Journal of Applied Science and Engineering, 4:275–290, 2006.
- Dr. S.T.Gandhe K.T.Talele and Dr. A.G.Keskar. Steganography security for copyright protection of digital images using dwt. (IJCNS) International Journal of Computer and Network Security, 2:21–26, 2010.
- V. Kumar and D. Kumar. Performance evaluation of dwt based image steganography. In Proceedings of Advance Computing Conference (IACC), 2010 IEEE 2nd International, pages 223–228, 2010.
- H S Manjunatha Reddy and K B Raja. High capacity and security steganography using discrete wavelet transform. International Journal of Computer Science and Security (IJCSS), 3:462–472.
- C. Cachin. An information theoretic model for steganography. Proceedings of 2nd Workshop on Information Hiding. D. Aucsmith (Eds.).Lecture Notes in Computer Sciences, Springer-verlag., 1525, 1998.
- IEEE Alan Conrad Bovik Fellow IEEE Hamid Rahim Sheikh Student Member IEEE Zhou Wang, Member and IEEE. Eero P. Simoncelli, Senior Member. Image quality assessment: From error visibility to structural similarity. IEEE TRANSACTIONS ON IMAGE PROCESSING., 3, 2004.
- Claude E. Shannon. A mathematical theory of communication. The Bell System Technical Journal., 27:379–423.
- Andreas Westfield and Andreas Pfitzmann. Attacks on steganographic systems. In Proceedings of the Third Intl. Workshop on Information Hiding, Springer-Verlag., pages 61–76, 1999.
- Patricia R. Pereira. Andr R.S. Maral. A steganographic method for digital images robust to rs steganalysis. Springer Lecture Notes in Computer Science, Vol. 3656., pages 1192–1199, 2005.
- Guillermito. Steganography: A few tools to discover hidden data. 2004.
- J.Y. Hsiao. C.C. Chang. and C.-S. Chan. Finding optimal least significant-bit substitution in image hiding by dynamic programming strategy. Pattern Recognition, 36:1583–1595, 2003.
- C.K. Chan. and L. M.Cheng. Hiding data in images by simple lsb substitution. Pattern Recognition, 37:469–474, 2004.
- Y. K. Lee. and L. H.Chen. High capacity image steganographic model.IEE Proc.-Vision, Image and Signal Processing, 147:288–294, 2000.
- C.F. Lin. R.Z. Wang. and J.C. Lin. Image hiding by optimal lsb substitution and genetic algorithm. Pattern Recognition, 34:671–683, 2001.
- D.C. Wu. and W.H. Tsai. A steganographic method for images by pixel value differencing. Pattern Recognition Letters, 24:1613–1626, 2003
- P Huang. K.C. Chang., C.P Chang. and T.M Tu. A novel image steganography method using tri-way pixel value differencing. Journal of Multimedia, 3, 2008.
- Potdar V.and Chang E. Gray level modification steganography for secret communication. In IEEE International Conference on Industria Informatics., pages 355–368, Berlin, Germany, 2004.
