A Safety Data Model for data analysis and decision making

Author: Ilyasu Anda, Isah Omeiza Rabiu, Enesi Femi Aminu
Journal: International Journal of Information Engineering and Electronic Business(IJIEEB) @ijieeb
Article in issue: 4, 2017.
Free access
The systems related to safety are becoming more and more important and are dependent on complex data both in terms of volume and variety. This is especially of importance in applications demanding data analysis, intensive maintenance and focuses on the potential threats due to possible data errors, such as railway signaling, traffic management etc. Errors in analysis of data could result in loss of many lives and financial loss such as the cases of Annabella container ship- Baltic Sea accident (United Kingdom Merchant Shipping, Regulations 2005 – Regulation 5). Despite these potential errors in data leading to accidents or mishaps, this part of the system has been ignored; this study focuses on the integrity of data in safety critical applications. It did so by developing a method for building metadata through a data chain, mining this metadata and representing it in such a way that a consumer of the data can judge the integrity of the data and factor this into the decision-making aspect of their response. This research proposes a design, implementation and evaluation of a safety data model that helps to ensure integrity of data use for data analysis and decision making to prevent loss of lives and properties. Modern and sophisticated ETL software tools including Microsoft SQL Server 2012 Data Tools and Microsoft SQL Server Management Studio were explored. The data were extracted from Safety Related Condition Reports (SRCRs) dataset and used data mining techniques to transform and filter unsafe and hazardous data from the extracted data and stored the safe data into the Data Warehouses (DWs). The prototype was able to load data into designated DWs. The success of the developed model proved that the prototype was able to extract all datasets, transform and load data into the DWs and moved extracted files to archive folder within 7.406 seconds.
Safety, Big-Data, Data Warehouse, Microsoft SQL Server, Metadata
Short address: https://sciup.org/15013514
IDR: 15013514
Text of the scientific article A Safety Data Model for data analysis and decision making
Published Online July 2017 in MECS
In the era of globalization, lives run at a faster pace which is only possible due to faster communications all over the world. These faster communication processes throughout the internet, 2G / 3G etc. are based on data protocols. So, an immense change has occurred in the world in terms of data with respect to volume, characteristics, types, velocity and complexity. Real time data and its real-time analysis have also come into trends recently because it does not make any delays in providing the information collected through data. Many businesses and organizations rely on real time data to add values to their business. They keep themselves ready to act on the data the moment they receive it in turn, making the business process quicker and hassle-free. Application of this real-time data requires very different types of techniques and underpinnings Example of such an application is Speeding Alert System which analyses realtime data and raises a trigger and relevant data to a database, when the speed of a vehicle exceeds a predefined threshold [1]. Many businesses and organizations rely on real time data to add values to their business. They keep themselves ready to act on the data the moment they receive it in turn, making the business process quicker and hassle-free. Application of this realtime data requires very different types of techniques and underpinnings than the applications that came before [2]. In traditional applications, there is a common platform to capture the business transaction data and software that works through a pipeline to cleanse and captured the data, recently the safety critical applications have also started storing the data into data warehouses. A data warehouse mostly works as the problem solver which reorganizes the data in a very primary manner i.e. without applying any normalization and prepares answers for the expected questions. Suggestions are derived from data processing and analysis. However, the data warehouses also have a feature of manual entry and the suggestions derived can be based on the manual data also. The new emerging class of real time data requires a different technology which closes the loop between the incoming transactions that capture data. Hadoop is commonly used in data analytics as a search engine for searching data and the use of SQL querying techniques for manipulation of data (Turner, 2011). There are two scenarios which can happen. The analytics could result in actions on a realtime basis while the users access the web pages, or it may work through Hadoop to evaluate the web analytics later. Hadoop works as the search engine for data scientists ~+who work on the raw data far more than in traditional data bases and helps to transform this raw data to the new patterns of data supporting the basic rules of analytics Analyzing the data in real-time allows activity to be viewed as it happens. The results are then inserted back into the online real- time database. [3]
The remaining sections of this paper are thus organized as follow. Section II captures an account of some related literatures (studies) of the proposed work; Section III depicts the architectural design and implementation of the proposed system which form the pivot of this paper; Section IV presented and discusses the result and Section V concluded the work and it recommendations.
-
II. Literature Review
This section investigates related works that has been undertaken in ‘Big Data’ data extraction.
-
[4] Investigated a wrapper induction, a technique used to automatically construct wrappers, to address traditional method of data extraction which is tedious and error-prone. In this work, the ability of this new technique to handle actual internet resources was considered and the time it required to learn wrappers in each class. These were achieved using six wrapper classes. The results obtained showed that most of the wrapper classes considered was very useful. However, few of the wrapper classes were extremely slow and safety data model were not used. This made the extracted data vulnerable to attack.
-
[5] Presented a novel algorithm named EXALG used for the extraction of structured data from a series of web pages emanating from a common template. The template was discovered by adopting two concepts namely, equivalence classes and differentiating roles. Experimentation of EXALG on the collection of web pages showed that it is efficient for data extraction from web pages. However, this research did not consider the entire web and the safety of the extracted data was not guaranteed.
-
[6] Proposed IEPAD that automatically generate extraction rules from Web pages. This was achieved using repeated pattern mining and multiple sequence alignment. All the record instances are comprehended
using repeated patterns which is further extended by pattern alignment. The advantage of IEPAD over the traditional method was that it involves no human effort and achieve 97% extraction. The limitation observed in this research was that the integrity of the extracted data was not considered.
-
[7] Implemented a fully automated extraction system that incorporated distinct extraction rule used in the extraction of objects from static as well as dynamic Web pages. The extraction was carried in three phases including preparation of a Web document for extraction, location of objects of interest in a Web page and finally, extracting objects of interest in a page. Two thousand Web pages were used to evaluate the system. It achieved 100% precision. Though, the system was fully automated but the evaluation process was not automated.
-
[8] Proposed an effective method for the extraction of structured data from the Web pages. First and foremost, a tag tree based visual information was built. Then, it used a tree edit distance method and visual cues in the process to carry out a post-order traversal of the tree. Upon the end of the process, data records were found and the data were duly extracted. The evaluation results showed that the extraction method was accurate. However, the safety of the extracted data was not considered.
-
[9] Developed a model for meteorological data through investigative use of data Mining techniques for weather forecasting. This developed model was used to train the classifier algorithms and standard metrics were used to evaluate the performances of the algorithms and their results were compared. Then, the algorithm that gave the best result was used to generate the classification rules. A good data mining techniques was used but this has not really emphasized the safety aspect of the data that can be guaranteed before generating the rules for weather variables.
-
III. Methodology
This chapter describes the methodology that is followed in the development of the Safety Data Model design for Metadata and the use of navigational data. These developments are carried out in stages using the Boehm Spiral Model development life cycle. Also introduced is the Conceptual Logical Design for Data Model layers that includes: Data Source Layer, ETL Layer, Physical Layer, and Logical Layer to X-ray the necessary transformation in each layer.
-
A. Development Approach
Data analysis and decision making application requires a dynamic development approach and not the convectional waterfall methodology, due to the large volume of data integrated from disparate source systems, today data analysis and decision making application development should follow the Boehm Spiral Model based on software engineering design principles. [10].
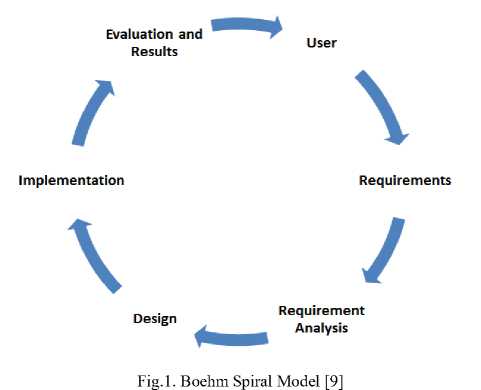
As shown in Fig. 1 above, the first stage is to identify the entirety of the users and the second is identification of each user requirement. These requirements will then undergo a series of analyses to ensure that users are able to achieve their goals. The next stage after requirements analysis is to translate requirements into a design and implement the design using a prototyping approach. The concept of evaluation and result is to test and ensure that the objective of the project has been achieved. Otherwise, the process will start again and it will continue until the objectives are achieved. The Spiral Model has flexibility and the ability to provide iteration at every stage of the software development lifecycle, making it the most popular software development model. We are adopting the Spiral model in this research work due to the aforementioned reason.
The users of the end products from the safety data model we are about to design are the safety organization and end users who use safety data to support decision making. After identifying users and analyzing the requirements in chapter 3, the next stage is the design phase.
-
B. Safety Data Model
The Safety Data Model for this research work is shown in Fig. 2.
From the above figure, it is clear that the data from the different data sources has been extracted. The layer from which the data is extracted is called as the Data Source layer. Extracted data is then passed to the ETL layer which creates the Meta data i.e. data about data and is stored in DWs. The data is stored in the DWs to allow fast retrieval.
As shown in Fig2 above, the data source layer represents Big Data source datasets where many datasets are available for decision makers to analyze. The datasets can be in structured or unstructured format. Structured data such as XML which is made available via APIs call is more preferable as a data source. However, unstructured data in a text, HTML or excel format can also be used as source data as in the case of this research study. ETL
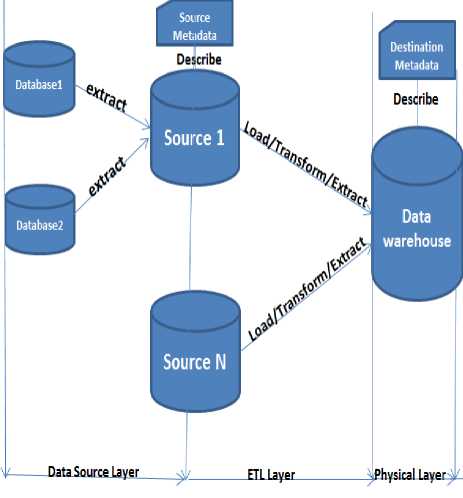
Fig.2. Safety Data model
Layer represents Extract, Transform, and Loading layer. This layer extracts data from the datasets, transforming the data into a format required by the DWs, filtering the unsafe and hazardous data out into a separate database before loading the safe data into the DWs. Detailed information about ETL processes will be discussed in chapter 4.
The Physical Layer is the central data repository of a Safety Data Model where data will be stored in DWs. The Logical Layer represents the logical view of the entire data.
The conceptual logical design of the Safety Data Model can be further divided into five layers: Data Source Layer, ETL Layer, Physical Layer, Logical Layer and Presentation Layer.
-
C. Data Source Layer Design
The Data Source Layer stores day to day business activities of an organization. The datasets on Big Data represents the source of our Safety Data Model design, and these datasets can be formed from structured data from OOS database or XML and can be formed from unstructured data such as a flat file or HTML.
-
D. ETL Layer Design
The ETL Layer begins with identification of the actual data that needs to be extracted, the quality of the data and extra data that can be added to make complete and meaningful information. It is important to check the timeliness of source data before starting the ETL particularly when using external data as in the case of Big Data. The timeliness of SRCRs data used during this research study is on an annual basis because datasets are published only once per year with Big Data. ETL was designed to ensure transformation of extracted data into a format readily available to support hazard free decision.
-
E. Physical Layer Design
The Physical Layer is the data repository center of the Safety Data Model and contains the DWs. When designing DWs, it is necessary to ensure that technical and functional requirements are up to standard.
-
F. Software Tools Used
The SQL Server 2012 Express Edition, SQL Server Management Studio and Visual Studio 2012 Express Edition were installed on window 8 operating system machine with 6GB RAM, 6GHz processor speed and
1TB hard disk space. Installation of these core components come with default installation of the inbuilt IIS server.
A folder named HealthAndSafetyDataset was created and downloaded available source datasets from the URL given below:
The datasets were downloaded between 2002 and 2013 into HealthAndSafetyDataset folder. The Fig. 3 show sample of 2002 dataset as downloaded from Big Data.
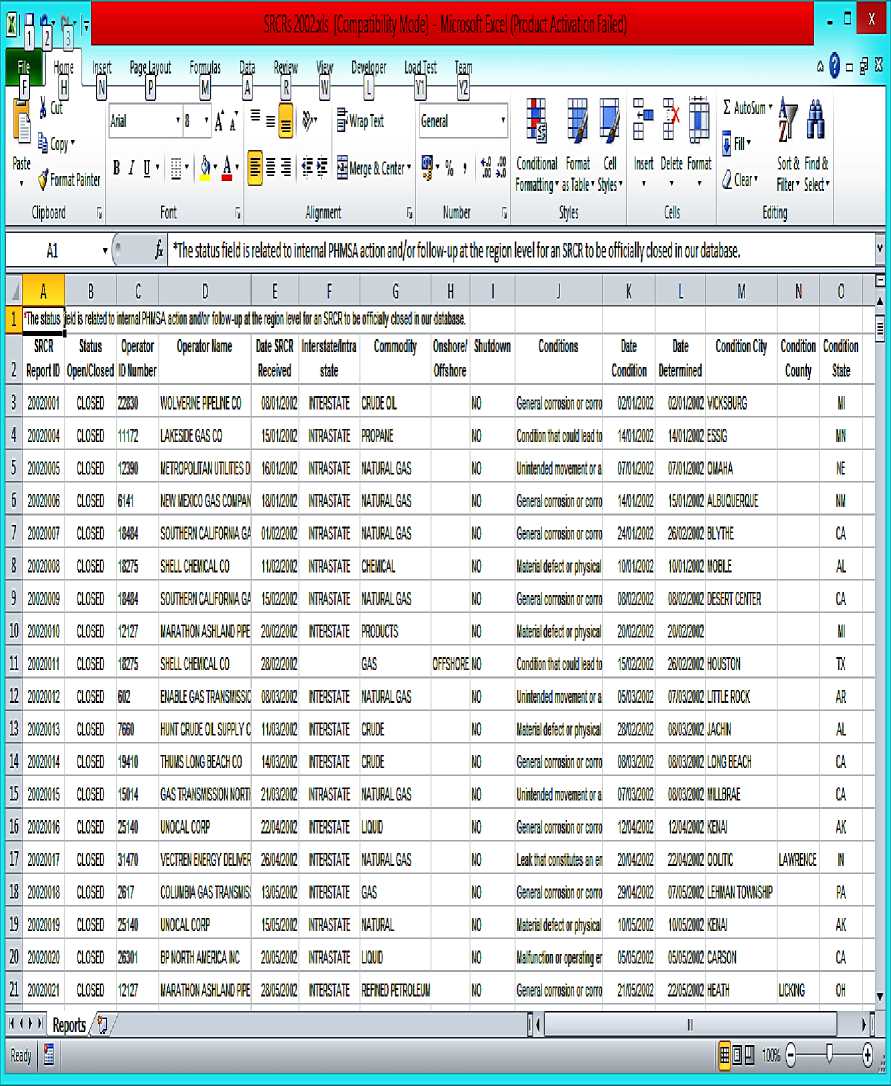
Fig.3. SRCR Sample Data
As you can see from figure 3 above, the excel file contains only one sheet, renamed to a common name to avoid extra processing and reduce load during transformation. For example, “2002 Reports as 03-152013” was renamed as Reports. We also created a sub folder named Archive inside HealthAndSafetyDataset, which is where already extracted excel files will be stored as archive files.
-
G. ETL Layer Implementation
The implementation of ETL started with the creation of a SSIS project. To create an SSIS project, we follow the procedure below:
Click on File, New Project, inside new project interface, choose Business Intelligence under Template and choose Integration Services on the right-hand pane as shown below. Enter the name of the project that is HealthAndSafetyETL. Then click OK to create SSIS project. Figure 4 below shows New SSIS Project using Visual Studio 2012.
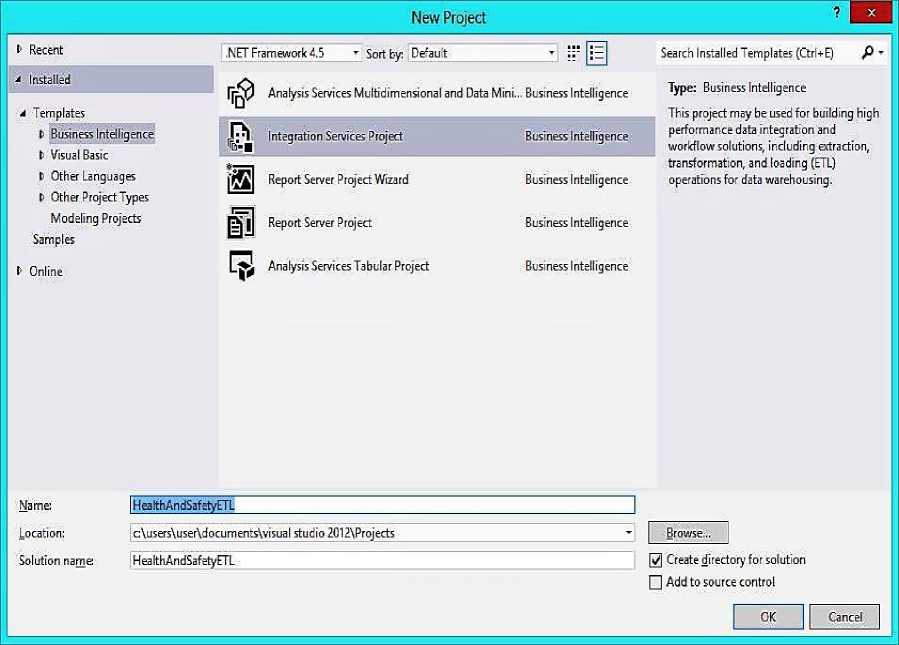
Fig.4. Step for creating SSIS Project
After creating SSIS project, a default package was created and made ready for use with ETL. Next, variables were created named FileName, Archive, XMLData and XMLMetadata for storing the filename of the current excel file, storing the path to the archive folder where extracted excel files will be stored, storing XML data and XML metadata.
The next step is to create a Foreach Loop Container that will loop through each excel file inside HealthAndSafetyDataset folder and extract, transform and load data into DWs and then move the excel file into archive folder. The Fig. 5 shows the Control Flow from Visual Studio 2012 Data Tools with configuration setting.
We first drag the Foreach Loop Container from SSIS Toolbox on the left under the Containers section. We then drag Data Flow Task and File System Task inside the Foreach Loop Container. The purpose of Data Flow Task is to design how data will be extracted from each excel file, transforming the extracted data and loading it into
DWs. The purpose of File System Task is to help in moving the extracted dataset file into the specified archive folder. The Fig. 6 below shows “Extract Data from Datasets (Excel Files)” Data Flow.
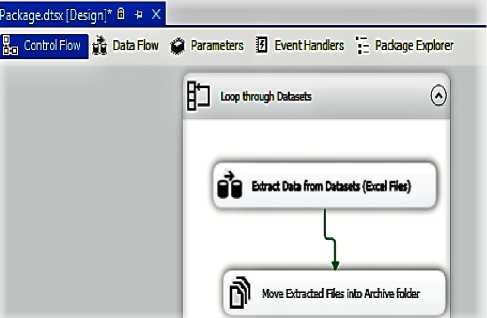
Fig.5. Control Flow
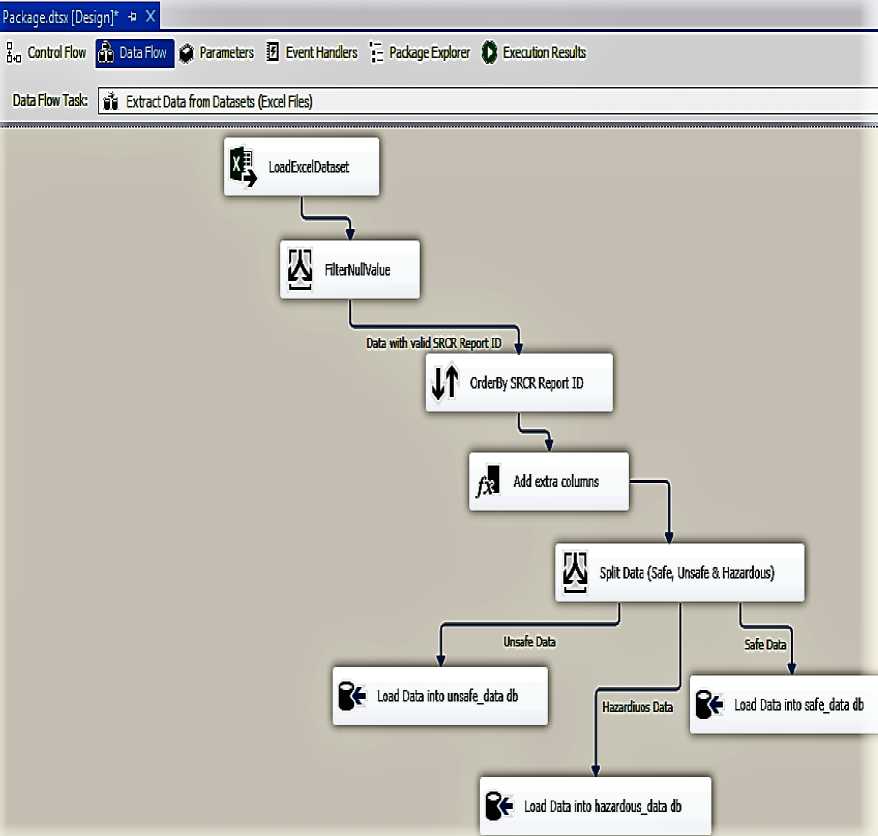
Fig.6. Extract Data from Datasets
SSIS packages have an inbuilt system that handles metadata as data flow from one place to another during transformation. To view metadata, click on Data Flow Design tab and right click the blue arrow linking transformation control together. For example, the metadata that describes the content of an Excel file can be viewed by right clicking the blue arrow linking LoadExcelDataset and FilterNullValue. Click on Edit to open Data Flow Path Editor and click on Metadata tab to view the metadata. Fig. 7 shows the Data Flow Path Editor displaying the implementation of the source metadata.
Fig. 8 below shows Data Flow Path Editor displaying the implementation of the destination metadata. The destination metadata describes data after it has undergone various transformations and is about to be loaded into DWs.
Three extra columns have been added to the metadata as a result of transformation. This is how SSIS projects keep track of changes to data schema during transformation. SSIS project can also implement metadata to capture incremental data from the source, but the scope of our implementation did not cover this due to the nature of the data source. The ETLDate is added to monitor the date and time that the ETL is carried out. TimeTakenToConfirmedExistence is added to get day differences between when a condition is discovered and when it is actually confirmed. TimeTakenToReport is added to get day differences between when a condition is discovered and when it is actually reported. The two added times help us in the process of determining the quality of safe data and thereby allow us to filter out hazardous data. If TimeTakenToConfirmedExistence or TimeTakenToReport has a positive value, it indicates that the condition is truly discovered before confirming the existence and the data can be relied upon. However, if either time has a negative value, it indicates that the date value has been wrongly recorded and is not reliable. Therefore, decisions made from such data could lead to loss of life and properties; hence, we filter this as hazardous data.
Another process we use to filter out safe data is to avoid null values present in the data during transformation. The data containing one or more null values are filtered out as unsafe data due to incompleteness of the data. Unsafe data may be considered useful in some future analysis due to the presence of a value that depends on something other than for the purposes of safety.
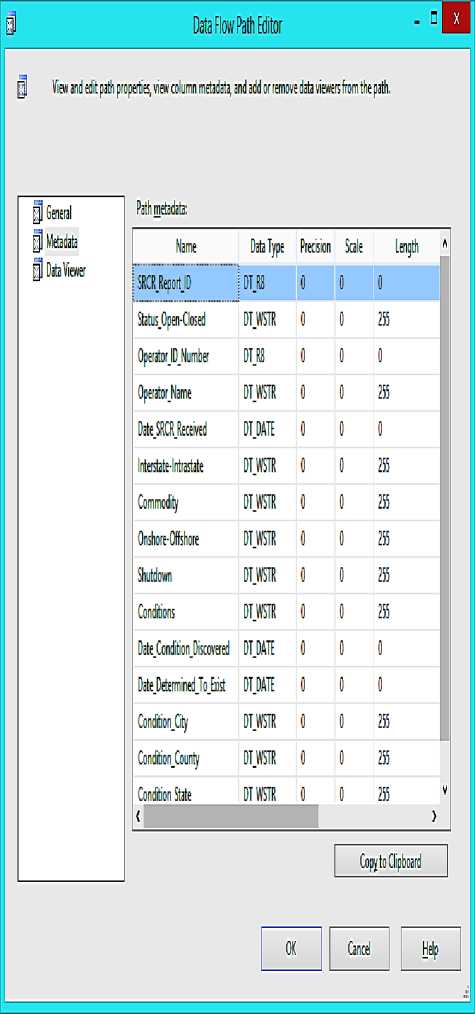
Fig.7. Data Flow Path Editor for Source Metadata
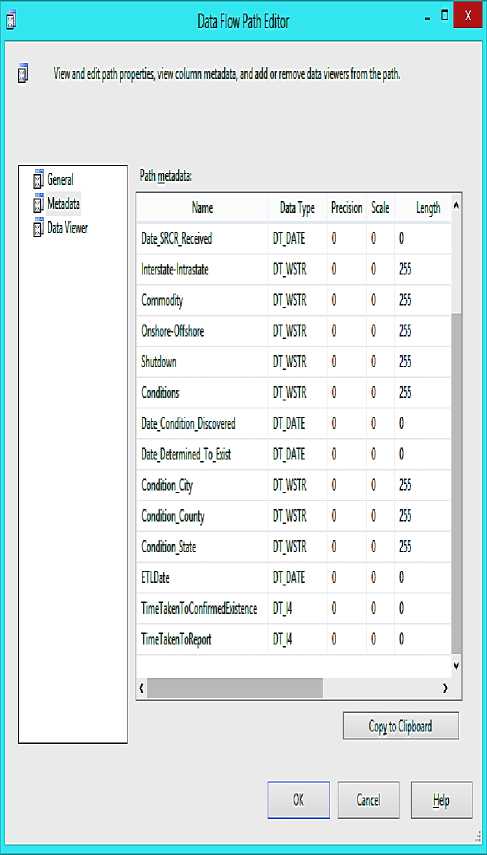
Fig.8. Data Flow Path Editor for Destination Metadata
-
H. Physical Implementation
We implement the physical layer using MSSQL Server 2012 database and SSMS to create the database and other database objects such as a table. The major implementation in this layer is DWs; we create a database named HealthAndSafety and create three tables, namely safe_data, unsafe_data and hazardous data with similar columns and data type. Fig. 9 below shows the database and tables from the SSMS Object Explorer user interface with the table schema.
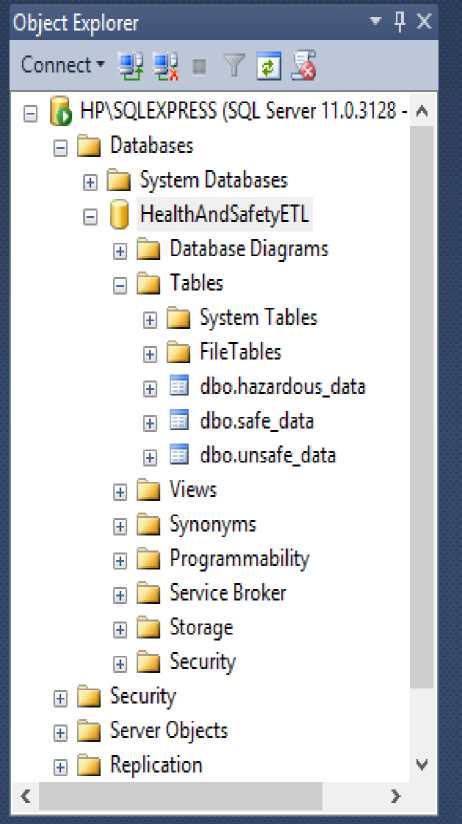
Fig.9. SSMS Object Explorer
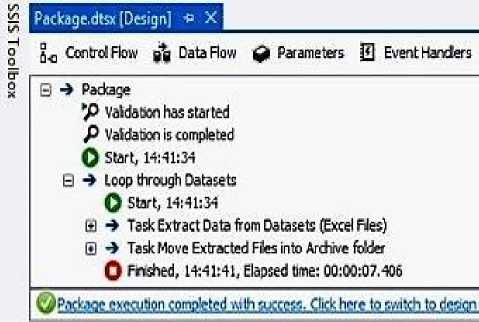
Fig.10. Safety Data Model Implementation Execution Result
Table 1. Execution Result Summary
S/N
Task
Time Taken
Success /
Failure
1 Loop Through Dataset, ETL 00:00:07.406 Success
Archive folder
I. Logical and Presentation Layer Implementation
The logical and presentation were implemented together using Visual Studio 2012 Data Tools. These tools make it easy to query DWs.
IV. Results and Discussion
The prototype implementation in the previous sections were discussed; this section presents evaluation and the results of the prototype implementation. The prototype was evaluated using a self-evaluation approach with Visual Studio Debugger and also discussed other possible evaluation methods relevant to our implementation.
The Execution Result in Fig. 10 showed tasks and time taken for each task to be completed. The green tick at the bottom shows the overall success of the execution. We used The twelve (12) Excel files of SRCR data between 2002 and 2013, which contain a total of 1039 rows of data. It took roughly 07.406 seconds to complete the ETL.
The self-evaluation proves that the implementation has been able to successfully carried out the following:
-
A. Extract all datasets from the source
As a result of this research study, the prototype was able to process all excel datasets in HealthAndSafetyData folder and move already extracted files to the archive folder.
-
B. Transform Data into quality safe data
The prototype was able to filter invalid data such as data with no valid SRCR REPORT ID and rows of data with one or more null column values. The rows of data were filtered out with unreliable date values which could lead to hazardous decision making. The prototype was able to filter data into safe, unsafe and hazardous data which were ready to be loaded into the DWs.
-
C. Loading data into DWs
The prototype was able to load data into designated DWs. The success of the task in Table 1 proved that the prototype was able to extract all datasets, transform and load data into the DWs and moved extracted files to archive folder within 7.406 seconds. The limitations of the ETL implementation lied in the number of attribute of Big Data qualities that were considered when processing the datasets. The ETL covered timeliness and consistency while other attribute such as accuracy and volume have not been considered. The ETL was also limited to SCRCs datasets as this is the data available during this research work.
V. Conclusion
This research work presented a design, implementation and evaluation of a safety data model that helps to ensure integrity of data use for data analysis and decision making to prevent loss of lives and properties. The software tools such as Microsoft SQL Server 2012 Data Tools and Microsoft SQL Server Management Studio were employed to implement the developed model. The results obtained showed that the developed model is effective and the integrity of the extracted data is safe and guaranteed.
References A Safety Data Model for data analysis and decision making
- Kumar, S and Patanka, S. (2012), Easy, Real-Time Big Data Analysis Using Storm, last retrieved from http://www.drdobbsom/open-source/easy-real-time-big-data-analysis-using-s/240143874 on 18th September 2013.
- Agile Alliance, Agile principles, 2001. Available: http://www.agilealliance.org/the-alliance/the-agile-manifesto /the-twelve-principles-of-agile-software/ 2001: [Accessed: 7 July 2013].
- Hadoop Analytics (2014), Hadoop Analytics, last retrieved from http://www.alteryx.com/hadoop-analytics on 19th September 2013
- N, Kushmerick. Wrapper induction: efficiency and expressiveness. Artificial Intelligence, 118:15-68, 2000.
- A, Arasu. and Garcia-Molina, H. Extracting Structured Data from Web Pages. SIGMOD-03, 2003.
- Chang, C. and Lui, S-L. IEPAD: Information extraction based on pattern discovery. WWW-10, 2001.
- Buttler, D., Liu, L., Pu, C. A fully automated extraction system for the World Wide Web. IEEE ICDCS-21, 2001.
- Liu, Bing, and Yanhong Zhai. "NET–a system for extracting web data from flat and nested data records." In International Conference on Web Information Systems Engineering, Springer Berlin Heidelberg, pp.487-495. 2005.
- O. Folorunshor, B.A Adesesan, “Application of Data Mining Techniques in Weather Prediction and climate Change Studies,” I.J, Information Engineering and Electronic Business, {2012}, vol.1 pp.51-59
- T. Ishaya and M. Folarin, “A Service Oriented Approach to Business Intelligence in Telecoms Industry” Telematics and Informatics, 29 (2012), pp. 273-285, Jan-2012. [Online]. Available:http://www.sciencedirect.com/science/article/pii/S0736585312000056. [Accessed: 16 November, 2013] K. Elissa, “Title of paper if known,” unpublished.
