A spatial-structural model for classification and change detection of vegetation coverage on multispectral satellite image

Author: Hung Trinh Le, Hoai Dao Khanh
Journal: Вестник аграрной науки @vestnikogau
Article in issue: 2 (47), 2014.
Free access
In analyzing the spatial-structures of various object types represented on multispectral images, we propose a new spatial-structural model for classification and two models for change detection vegetation coverage. The model for evaluation of coastline dynamic change has eliminated the disadvantage of traditional methods. It can be applied to images received from various sensors. Both change detection models used the spatial-structural model for classification purpose. Results of analytical processes can be used for making vegetation maps, updating topographic maps, analyzing hydrology network change, agricultural land and residential areas.
Interpretation, dynamics, multispectral image, spatial-structural model
Short address: https://sciup.org/147124541
IDR: 147124541 | UDC: 528.854.2
Text of the scientific article A spatial-structural model for classification and change detection of vegetation coverage on multispectral satellite image
Change detection of land coverage is one of the complex, time-consuming tasks in environmental resource monitoring. Traditional methods based on field surveys provide only local coverage information. Received in the visible and infrared spectral bands by optical sensors, multispectral satellite image exhibits spectral characteristics of different vegtation, so they are widely applied to study vegetation. Frequently, to interpret vegetation coverage on multispectral satellite images, an automatic supervised classification approach is applied in which popular algorithms parallelepiped, minimum distance, maximum likelihood are combined. However, the application of these algorithms to images after geometric correction, frequently yield classification results with some precision degradation. So, construction of reliable models for automatic classification of land coverage on multispectral satellite images is a task with high practical and scientific value [1-4].
In classification processes on multispectral images, a supervised approach with statistical algorithms is applied. These algorithms do not take into account the spatial structure of land objects represented on images. In analyzing multispectral satellite images, land objects are represented as groups of adjacent pixels on the image. In this paper, we separate them into following categories [1]: point objects representing no more than one pixel; small objects representing group of four to fifty adjacent pixels; linear and boundary objects; large objects representing group of adjacent pixels with no more than ten pixels in all direction.
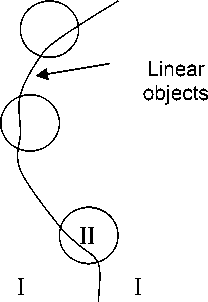
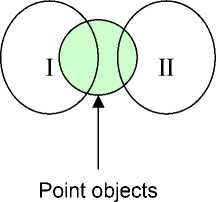
Figure 1 - The none-homogeneity of point and linear objects
Different object types on images exhibit various statistical representations and spatial-structures. To effectively implement change detection from this point, we need some unique method to separate point objects, small objects, linear and large objects from each other [1].
At different spatial resolutions, an object may be classified into different categories mentioned above. On low resolution satellite images, rivers and streams are represented as linear and boundary objects. However, medium and high resolution satellite images are classified in the large object category, characterized by homogeneity of spectral values. In other words, object pixel values vary in small intervals. Small objects are usually localized between another object (Figure 1a) and characterized by prominent or salient spectral values. In 1972, Rosenfeld developed an algorithm for classifying point and small objects. In this algorithm a noise median filter with the filtering window 3 x 3 was applied, enabling one to filter and remove small and point objects. Thereafter the original image is substracted by median filtered image, containing information of objects with size no more than one pixel. An absolute value operation is then applied to the image to ensure that pixel values are positive, after that a procedure of classifying point and small objects is undertaken [1].
Linear and boundary objects are characterized by high gradient values (Figure 1b). If a traditional algorithm parallelepiped for example is applied to classify these objects, the result will not be reliable. To overcome this, the gradient filtering techniques Sobel, Prewitt, etc are applied first and then classification algorithms are used.
In change detection of coastlines, popular image ratio methods developed by Winathor and Alesheisk [5, 6], two bands with more water information are used to separate border between water and land. However, these methods are effective only when multispectral images come from one sensor system. In some situations they are not effective due to lack of image data.
CONSTRUCT THE MODELS
From analysis of statistical descriptions and spatial-structural characteristics of different object types represented on multispectral images, the authors propose a new image processing model for classifying land coverage (Figure 2).
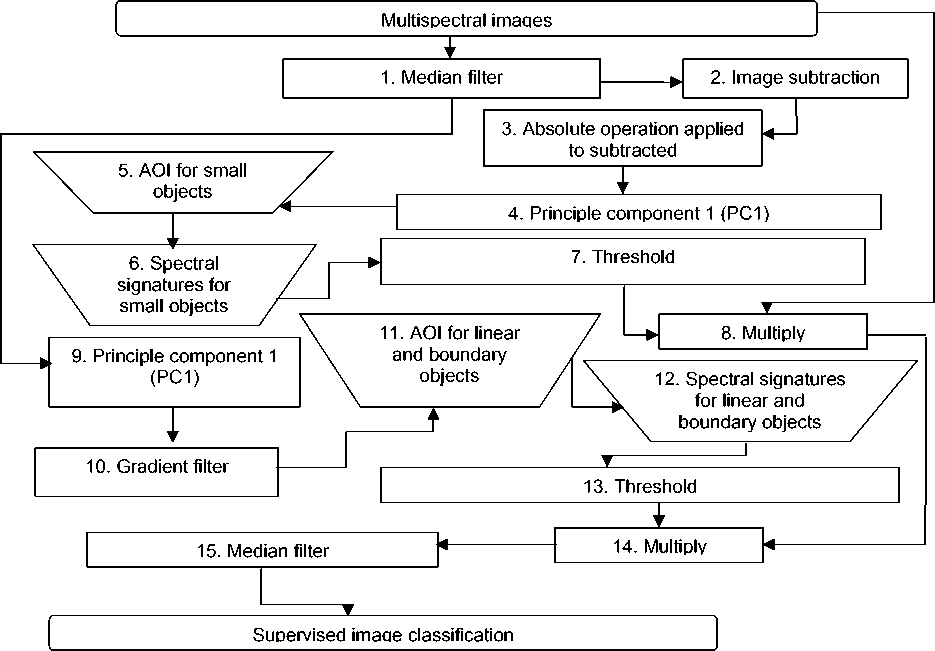
Figure 2 - Spatial-structural models for multispectral image classification
Small and point objects are isolated in steps 1-7 by the combination of median filtering, image bands substraction and principle component analysis. Linear and boundary objects are classified in steps 1, 9-13 by the combination of gradient filtering and principle component analysis. Large areal objects are then classified from steps 8, 14-16 with supervised approach through a combination of traditional statistical algorithms: parallelepiped and maximum likelihood.
The most important advantage of this model is each object type classified separately at each stage. This reduces total work and computation time in comparision with traditional methods. The second advantage is the application of an appropriate algorithm in each classification stage. These optimized algorithms give better precision in classification results.
The second model proposed here concerns coastline dynamic change detection (Figure 3). It can be applied with multispectral image data from sensors different from LANDSAT.
This model overcomes the disadvantage of the traditional methods in coastline extraction: it applies gradient operation to the classified image by the spatial-structural method described above.
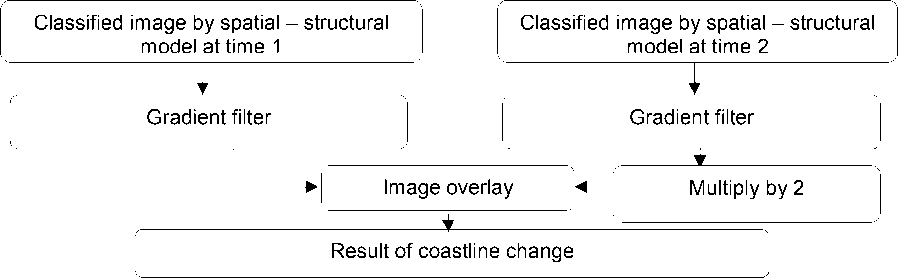
Figure 3 - Model for automatic detection of coastline
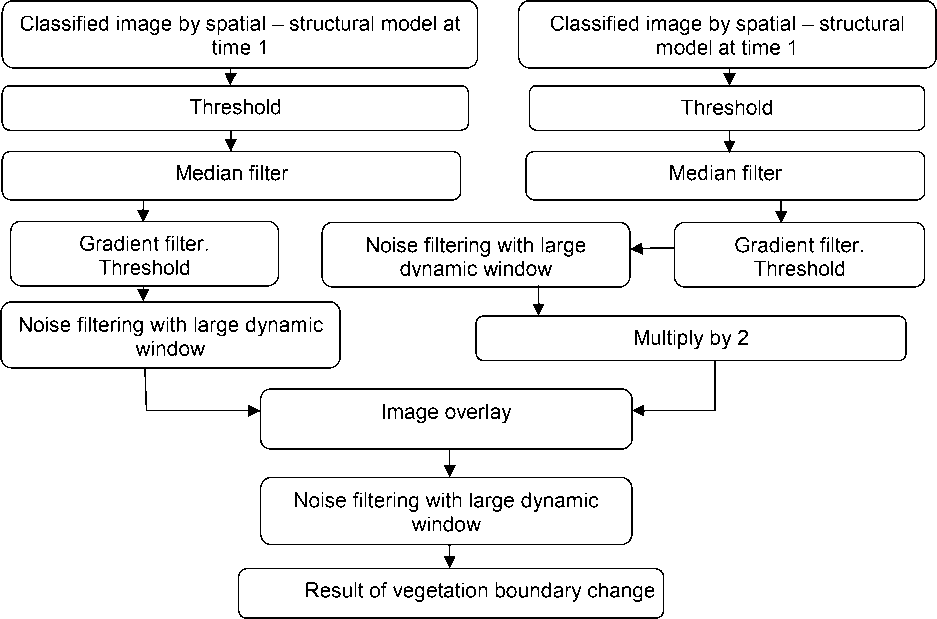
Figure 4 - Model for change detection of vegetation coverage
For evaluation of vegetation coverage change, we propose the third change detection model based on spatial-structural classification model. Input consists of classified images on the same area at different time. An important note addressed when classifying multi-temporal images is use of the same classification algorithm, with same sample data, symbols and colors of objects that must be consistent.
The vegetation change detection process is represented in figure 4. The threshold operation is applied to classified images by spatial-structural model to eliminate objects different from vegetation, then median filtering and gradient filtering are applied to determine vegetation object boundary. The result images from begin of cycle and end of cycle are overlaid to produce change detection map.
CASE STUDY
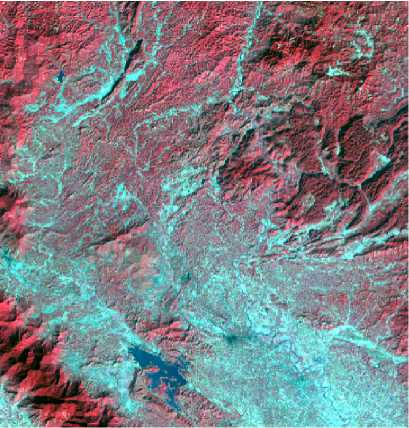
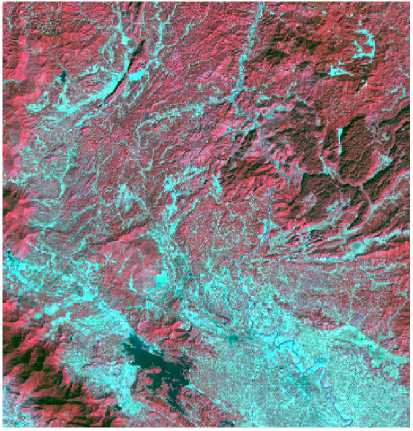
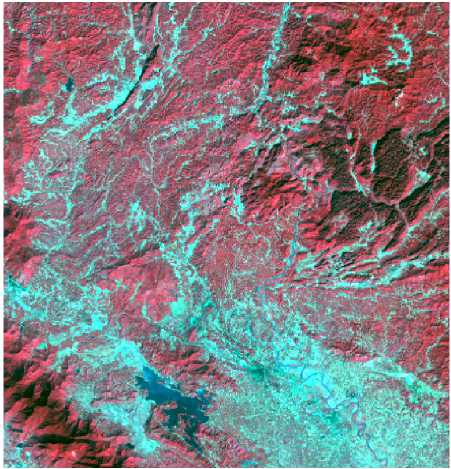
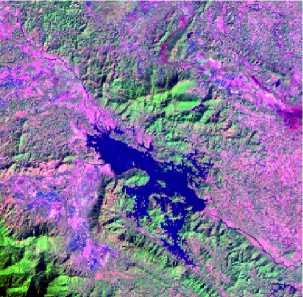
For experimental purposes, we use multispectral images from LADNDSAT 7 sensors. In the Thai Nguyen region we have images received at: 27 – 12 – 1993, 04 – 11 – 2000, 23 – 11 – 2001 and 08 – 11 – 2007 (Figure 5).
a) b)
c)
Figure 5 - LANDSAT images in Thai Nguyen 1993 (a), 2000 (b), 2007 (c).
In the Tay Nguyen region we have images received at: 30 – 12 – 1990, 13 – 01 – 2005. Spatial resolution of spectral bands is 30m, and 60m for thermal band. LANDSAT 7 provides additional pan band with spatial resolution at 15m for more detail research of the Earth’s surface. Also in our experiment, we use topographic and thematic digital maps created in 2002 at scale 1:100 000 for comparision and sampling purpose.
Precision evaluation of spatial-structural model. Two vegetation classification approaches were used. The first one is a traditional classification method: combination of parallelepiped, minimum distance and maximum likelihood. The second one is our described spatial-structural model, where two algorithms parallelepiped and minimum distance were used at stage of large area objects classification.
Sampling data were taken by an experiment analyst with the help of topographic, plant map and others surveying data on research area. In addition, samples were divided to two groups. One group used for classification process and another one called control set used for precision evaluation.
For precision evaluation purpose samples in control set are used to calculate a confusion matrix. With each object type one or several samples can be used for validation. If more control samples are used then the result of precision evaluation is more reliable. In sample data the following parameters need to be calculated:
Area of control samples (numbers of pixels) - S ; Number of pixels, which belong to class j- N ; Value of element P of confusion matrix: j ij P ij
N
--j— * 100 %
S
i
a)
b)
|
No. |
Object name |
Symbol |
|
1 |
Primeval forest |
|
|
2 |
Mixed forest |
|
|
3 |
Limestone forest |
|
|
4 |
Bamboo and cork forest |
|
|
5 |
Cultivated forest |
|
|
6 |
Agricultural Land |
|
|
7 |
Water body |
|
|
8 |
Rural land |
|
|
9 |
Urban Land |
c) d) Legend
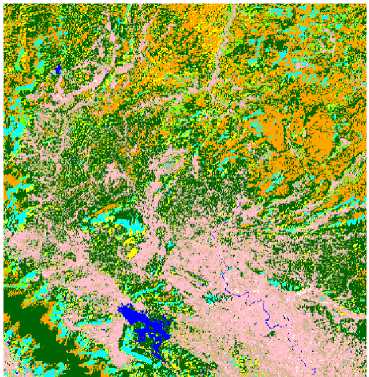
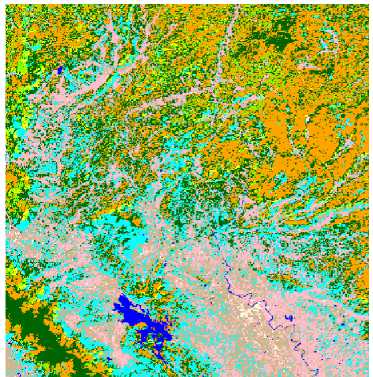
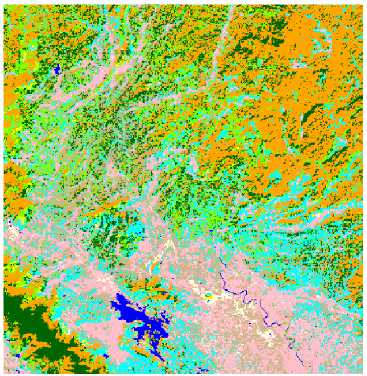
Figure 6 - Classification result of vegetation coverage in Thai Nguyen region in 1993 (a), 2000 (b), 2007 (c)
V a lu e s of m a in d ia go na l e le m e n ts in th e co nfu sio n m atr ix sh o w th e p r e cisio n of classification result. Values of r em ai nin g e le me n ts in th is m a tr ix sh o w th e cla ssif ica tion err o rs. A na lyz in g co n f us i o n m a t r ix in t w o a p p r o a ch e s sh o w e d th a t in sp a tia l -structural model the veg etat ion ’s cla ssi f i ca tio n p r e cisio n o n L ANDS A T im age s in 1 9 93 , 2 0 0 0 , 20 0 7 is correspond to 93%, 91% 93%. In tr a dit io nal m eth o d th e v e ge tati o n ’s cla ssi f ica tio n precision on LANDSAT images in 1993, 2000, 2007 is correspond to 84%. In other words, spatial- st ru ctu r a l m o de l fo r cla ssif ic a t ion in cr e a ses g r e a tl y th e cla ssi f ic at ion precision (average value is 16%).
In Th a i N gu y e n r e gio n on m u ltisp e ct r a l im a ge 9 ob j e ct ty p e s w e r e cla ssif ie d a n d th e r e are 5 ty p e s of f o re st . Th e co r r e sp o n d ing cla ssi fica tio n r e su lt w ith sp e ctra l im a ge s in 1993, 2000, 2007 is sh o wn i n f igur e 6 . Ar e a s of ea ch f o r e s t ty p e a r e sho w n in th e ta b le 1 . Co r r e sp o nd ing to t he se re su lts, th e fo r e s t area in 1 9 9 3 , 2 0 0 0 , 2 0 0 7 o ccu py
64.9% o f re se arch r egion a r e a . In 2 0 0 0 th e f o r est a r e a in cr e a se d in com p a r iso n w ith 1 9 9 3 be ca u se in 1 9 9 3 a n a tio n a l p r o j e ct fo r g r e e n ing ba r e so il w a s d e p loy e d . H o w ev e r , th e a r e a of prim eval f orest in 2 0 00 w a s red u ce d gr e a tly i n com p a r iso n w ith 1 9 9 3 ( a b o u t 3 0 % ) . After seve n yea r s in 2 0 0 7 th e p r im e v a l f o r e s t ar e a w a s co n tin u e d to r e d uce 50 %. T h i s reduction com e s fro m tw o r e a so n s : d ef o re statio n a n d lo ca l p o p u la tio n gr o w th . S o f ar in th is r egio n th e prim eval fo res t e x ists on ly in n a tio na l p a r k (T am Da o ) a n d in so m e h i gh m o u n ta in p la ce. Besides the area reduction of natural forest the increasing of m ix e d a nd b a m b o o , cork forests were noticeably visible.
Table 1 - A rea of v ari ous forest typ es correspond t o cl assificat ion r esult
|
No. |
Object name |
Area (ha) |
||
|
1993 |
2000 |
2007 |
||
|
1 |
Primeval forest |
92256.3 |
63471.7 |
33574.8 |
|
2 |
Mixed forest |
9723.2 |
9577.7 |
33277.5 |
|
3 |
Cultivated forest |
14648.2 |
43751.8 |
41247.4 |
|
4 |
Limestone forest |
48313.9 |
65398.0 |
68387.9 |
|
5 |
Bamboo and cork forest |
17544.6 |
7331.8 |
3774.6 |
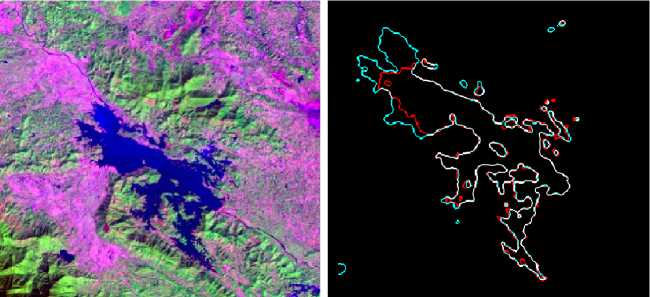
Coastline dynamic change evaluation. Co a stlin e dyna m ic ch a n ge d ete ctio n w a s conducted based on the model proposed in figure 3.
Coast li ne dy nami c
Figure 7 - Coastline d yn am ic chang e d et ect i on N ui Co c Lak e 1993 – 2007
The result of coastline dynamic change detection in Nui Co c L a k e in p e r io d f r om 1 9 9 3 to 2 0 0 7 is sh o w n in f i gur e 7 . Re d co lor r e pr e sen ts co a s tlin e in 1 9 9 3 , b lu e co lo r r e pr e se n t s coa s tline i n 20 0 7 , th e w hite co lo r s ho w s s tab le co a stlin e regi on in this p erio d. A cle a r ly phenomenon can be noticed in the result that in period 1993-2 0 07 Nu i Co c L a k e w a s expanded progressively to the northwest direction.
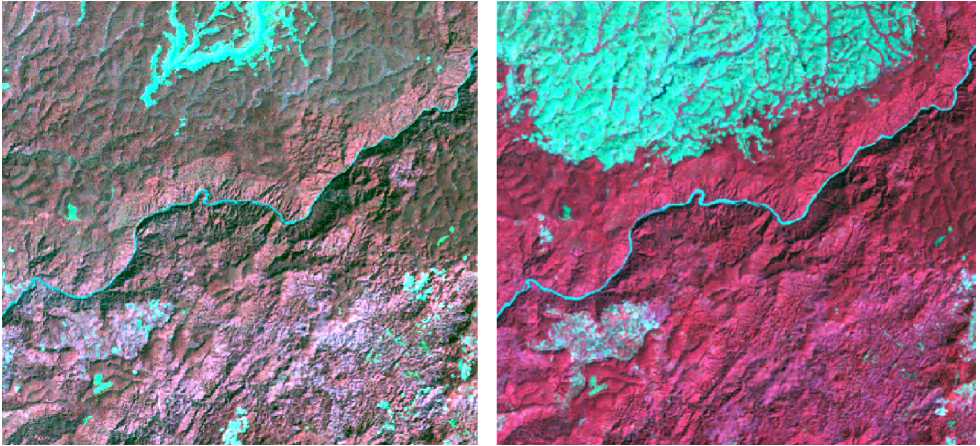
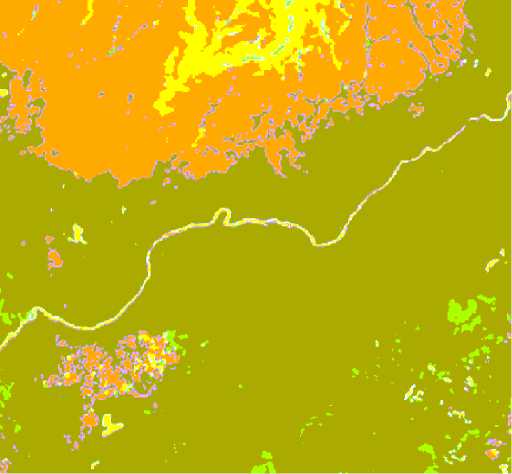
Vegetation change detection. Vegetation change detection was conducted based on the model proposed in figure 4. The evaluation was accomplished on LANDSAT 7 spectral image with spatial resolution at 30m, in Cat Tien - Lam Dong region in period 1990-2005. Experiment result is showed in figure 8, green color represents stable area, orange color represents deforested area, and yellow color represents stable bare soil area, light blue color represents new forest, purple color – new bare soil. With the proposed model in figure 4 the automatic vegetation change detection can be implemented to create fast vegetation change map. This will contribute to environmental resource conservation.
1990 2005
Vegetation coverage change
Figure 8 - Vegetation coverage change period 1990-2005 in Cat Tien (Binh Phuoc, Lam Dong) region.
CONCLUSION
In this paper we proposed three models for classification, coastline dynamic change detection and vegetation change detection. The experiment showed that these models are reliable. The spatial-structural model is used as a base method of classification in change detection models to improve precision and calculation speed when classifying land coverage. The coastline dynamic change detection model can be applied to spectral image of various sensors; this advantage makes it more preferable than traditional coastline change detection algorithms. The model for vegetation change detection is most useful for classifying different object types fast.
References A spatial-structural model for classification and change detection of vegetation coverage on multispectral satellite image
- Marchukov V.S., Trinh Le Hung (2011), The methods of identification of the Vietnamese tropical vegetation dynamics using automated interpretation of the multispectral images, Issledovanie Zemli iz Kosmosa, vol. 3, 75-85.
- Marchukov V.S., Trinh Le Hung (2011), Analysis of the spectral characteristic and study of classification method for Vietnam tropical forest based on spectral index, Izvetia vuzov «Geodesy and aerophotography», Vol.3, pp. 74-78.
- Dao Khanh Hoai, Trinh Le Hung (2012), Applications of remote sensing technology in monitoring natural and environmental resources of Quang Ninh District, Proceeding on Science and technical conference toward the sustainable Development of Quang Ninh, pages 77-84.
- Do Dinh Tien (2001), Biodiversity in National Park Tam Dao, Journal of science activities, Ministry of Science and technology, No.11.
- Marchukov V.S., Slatkopepsev S.A. (2005), Resource and environmental mapping, Moscow State University of Geodesy and Cartography (MIIGAiK), 195 pp.
- Alesheikh A.A., Ghorbanali A., Nouri N. (2007), Coastline change detection using remote sensing, International Journal of Environment, Science Technology, pp.61-66.
- Winasor G., Budhiman S. (2011), The potential application of remote sensing data for coastal study, Proc. 22nd Asian conference on remote sensing, Singapore, 2011.
- A. Rikimaru, P.S. Roy, S. Miyatake (2002), Tropical forest cover density mapping, Tropical ecology, 43(1): 39-47.
- Kwarteng Ady Yaw, Al-Ajmi Dhari (1996), Using LANDSAT thematic mapper data to detect and map vegetation changes in Kuwait, International archives of Photogrammetry and Remote sensing, Vol.31, part B7.
- NASA (2011), LANDSAT 7 science data users handbook, http://glovis.usgs.gov
