A State-of-the-art Review on Wavelet Based Image Resolution Enhancement Techniques: Performance Evaluation Criteria and Issues

Author: Samiul Azam, Fatema Tuz Zohra, Md Monirul Islam
Journal: International Journal of Image, Graphics and Signal Processing(IJIGSP) @ijigsp
Article in issue: 9 vol.6, 2014.
Free access
Image resolution enhancement in wavelet domain has been one of the most active research areas in image processing. Many methods and techniques, based on wavelet transformation have been proposed in last couple of years. In this paper, we present a review on the state-of-the-art techniques for wavelet based image resolution enhancement. We summarize them with enhancement ability in peak signal to noise ratio (PSNR) and give comments on their performance. In addition, through our review, we have found some essential criteria and issues related to performance assessment of different resolution enhancement techniques. Our experimental results have proved the significance of these issues. Future directions for image resolution enhancement research are stated at the end.
Image resolution, wavelet transform, fidelity criteria, PSNR, RMSE, enhancement factor, running time
Short address: https://sciup.org/15013409
IDR: 15013409
Text of the scientific article A State-of-the-art Review on Wavelet Based Image Resolution Enhancement Techniques: Performance Evaluation Criteria and Issues
Published Online August 2014 in MECS
Spatial resolution is one of the most important quality factors of images and videos. Image with higher resolution is a primary requirement in most of the imaging applications, such as, medical imaging [1], video sequences [2] and satellite imaging [3]. A widely used technique for constructing higher resolution image is known as interpolation. Fundamentally, the interpolation is the process of using known data to estimate values at unknown locations. In image processing, interpolation is a method to increase the number of pixels in digital image. Four conventional interpolation techniques are used extensively in the field of resolution enhancement, namely, nearest-neighbor, bilinear, bicubic and lanczos. The nearest-neighbor [4] interpolation assigns to each new location the intensity of its nearest neighbor in the original image. This method is simple to implement but produces undesirable artifacts, such as, distortion of straight edges. A more appropriate method is the bilinear interpolation [4] where four nearest neighbors are used to estimate the intensity value of a give location. This method gives slightly better performance than the nearest-neighbor but increases the computational cost. The bicubic interpolation [4] is more sophisticated than the other two techniques, where sixteen nearest neighbors are used to estimate the intensity value of a given location. This method preserves fine details than its bilinear counterpart. The bicubic interpolation is the standard method for resolution enhancement in commercial image editing programs. The lanczos interpolation [5] is actually a windowed form of a sinc filter which gives better performance than the nearest-neighbor and bilinear method.
Besides the conventional resolution enhancement techniques like nearest-neighbor, bilinear, bicubic and lanczos, there are some other state-of-the-art techniques by different researchers. One of the earliest-one is the single-frame resolution enhancement by image registration [6] where, four low resolution images have been used, that are generated by rotation and translation from the source image. Its performance is slightly better than the bicubic in terms of PSNR for resolution enhancement with a factor of four. Another interpolation based technique for resolution enhancement is edge-directed interpolation [7] where, covariance-based adaptive interpolation is applied only on the edge pixels and the conventional bilinear interpolation is used for remaining non-edge pixels. This hybrid technique improves the computational cost, as well as, sharpness of the edges. Its performance is better than bicubic interpolation.
In the field of image processing, wavelet domain is a popular domain for representing images in terms of frequency. Recently, several research works related to images, such as, texture classification [8], contrast enhancement [9] and image compression [10] are carried out in wavelet domain. Wavelet domain image resolution enhancement is relatively a new research topic and many state-of-the-art techniques have been proposed so far. From the last decade, wavelet-based image resolution techniques [11-23] show good results than all the above conventional techniques. The purpose of this paper is to provide a review on those wavelet based resolution enhancement techniques by analyzing their pros, cons and enhancement ability. This paper also presents some important criteria and issues related to performance assessment of different techniques. In future, new researchers should consider those issues during finding a superior solution of image resolution enhancement.
This paper is organized as follows: section II explains
2D wavelet transformation (WT) of an image and the conventional wavelet zero padding (WZP) technique. A state-of-the-art review of wavelet-based image resolution enhancement techniques is presented in section III. In section IV, criteria for performance evaluation of different techniques are described. Issues related to performance evaluation are explained with simulated results in section V. Finally the conclusion and discussion is outlined in section VI.
-
II. 2D wavelet transformation and WZP
Two dimentional (2D) wavelet decomposition of an image is performed by applying the 1D discrete wavelet transform (DWT) along the rows of the image first, and then the 1D DWT along the column of the image [4]. This 2D wavelet decomposition will make four decomposed subband images, referred to low-low (LL), low-high (LH), high-low (HL), and high-high (HH). All these four subbands cover the full frequency band of the original image. In Fig. 1, a filter bank is shown, that
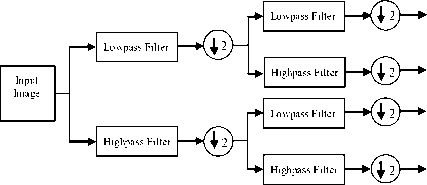
Fig 1: Filter bank of 2D wavelet decomposition.
should function on the image in order to generate frequency images of different subbands. Fig. 2 shows a satellite image [24] decomposed into four subbands using 2D DWT. The LL subband is considered as the approximation of the original image and other three subbands HL, LH, HH are considered as the horizontal, vertical and diagonal details of the original image, respectively. Inverse 2D DWT can be applied on those four subbands to get back the original image without loss of information.
One of the simplest wavelet domain resolution enhancement techniques is wavelet zero padding (WZP) where only the inverse 2D DWT is used. Before the inverse process, LL subband is considered as the original image and the LH, HL, HH subbands are filled
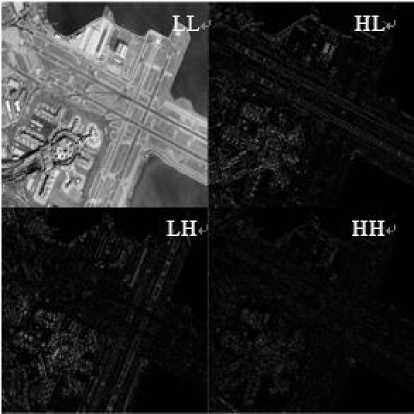
Fig 2: DWT of a sattelite image.
LL HL LH HH
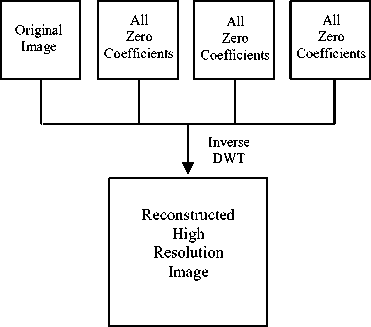
Fig 3: Block diagram of wavelet zero padding.
with zero frequency values [15]. After the inverse 2D DWT we get the resolution enhanced image with the factor of two. Fig. 3 shows a block diagram of WZP process. Although WZP is very simple to implement but it shows less performance than the bicubic, if the original image contains much edge and texture pixels.
-
III. State-of-the-art review
In this section, we have discussed most of the successful wavelet based resolution enhancement techniques, that are proposed by different researchers in different literatures. These techniques are categorized as following:
-
• WT and Hidden Markov Tree (HMT) based enhancement [11-14].
-
• WT and cycle spinning (CS) based enhancement [15-17].
-
• Complex WT based enhancement [3], [18-20].
-
• Discrete WT and Stationary WT based enhancement [21-23].
Subsequent subsections describe each category briefly.
-
A. WT and HMT based enhancement
In WT and HMT based resolution technique, Hidden Markov Model (HMM) is used to interpolate or estimate high frequency subbands from the low frequency subbands. HMM is a statistical Markov model which consists of states of a process with probability distribution associated with each state. In this model, the sequence of state transition of the whole process is ‘hidden’ from the observer but not the parameters of the model are hidden [25]. A HMT is a tree data structure where each tree node is a state of HMM. Fig. 4 shows a wavelet domain quad HMT
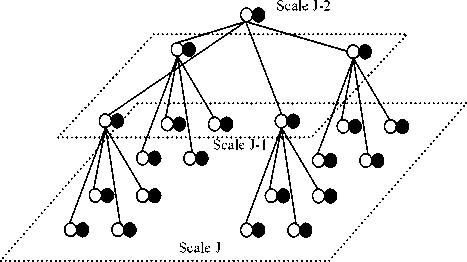
Fig 4: Hidden Markov tree structure.
where white nodes denote hidden state variable and black nodes denote wavelet coefficients for different scales of image. Here state probability, state transition probability, variance and mean value of state probability distribution are the four parameters of HMT.
Different research works on image resolution enhancement have been found based on the idea of wavelet and HMT. In [11], mixture of Gaussian distribution is used as probability distribution associated with each state. To train the HMT based on a set of similar high resolution images, expectation maximization (EM) algorithm is used. It takes wavelet coefficients as input and produces all four parameters of HMT. After training the HMT, iterates the EM algorithm for the target low resolution image. It will produce necessary state probabilities that can be used to predict state probabilities at high scale or resolution. Finally, use the Gaussian probability distribution to randomly generate the values for the wavelet coefficients. A post processing step consists of Gaussian low pass filter is applied to sharpening the image more. A major problem of this technique is the mixture of Gaussian model which produce inability to keep track of sign of the coefficients. This problem is partially solved using a simple post processing based on empirical probabilities obtained during training [11].
A similar HMT based technique is found in [12] where resolution enhancement problem is considered as linear constrained quadratic optimization problem and the cyclic optimization procedure is used to solve the problem. Also CS technique is applied at the end to reduce the artifacts found in the constructed high resolution image. In this technique, randomly generated signs are assigned to the estimated coefficients. HMT oriented method has been further changed in such a way that no training dataset is needed [13]. State transition parameters can be acquired directly from the low resolution image. It is possible by using coarser subbands of the image obtained by multi level DWT. Although, above three state-of-the-art techniques have the problem related to sign of the coefficients, they give improved result than bicubic interpolation.
Another HMT based image resolution technique is found in [14] where, the problem related to coefficients’ sign is considered as an important issue of image quality. It proposes a method to estimate the
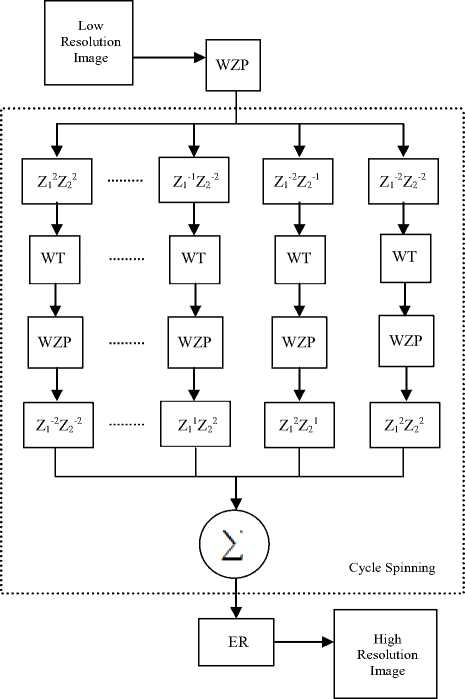
Fig 5: Block diagram of CS and ER based resolution enhancement technique.
sign and the magnitude of the coefficients separately. In this method, the magnitude of coefficient is estimated using HMT and the sign of coefficient is estimated using inter-subband correlation which provides accurate sign estimation. Thus, improve the quality of resulted image of HMT based image resolution techniques [11-13]. This additional improvement of HMT based techniques outperforms all the conventional techniques, the registration technique [6], as well as, edge-directed interpolation technique [7].
-
B. WT and CS based enhancement
Resolution enhancement using WT and CS [15-16] shows much better performance than all the conventional and few state-of-the-art techniques [6-7]. In [16], they have experimentally shown highest PSNR value for 4x (factor four) enlarged ‘Lena’, ‘Elaine’, ‘Baboon’ and ‘Peppers’ images. In this technique there are three steps. In the first step, an initial enlarged image % is obtained using WZP Cycle spinning step is the second step where an intermediate high resolution image у is constructed. In CS process a z-domain shift operator Sij is used on % for horizontal and vertical shift of (i, j) e {-k, -k+1,....., k-1, k}. It will produce N = (2k+1)(2k+1) number of shifted images. For all these shifted images or coefficients, WT is applied and then discards all high frequency subbands from WT. It will decrease the resolution but an immediate impose of WZP will balance it. Finally, realigning and averaging will complete the CS process. The third and final step is edge rectification (ER) step where edges of у are rectified by readjusting their width according to the estimates obtained by processing the
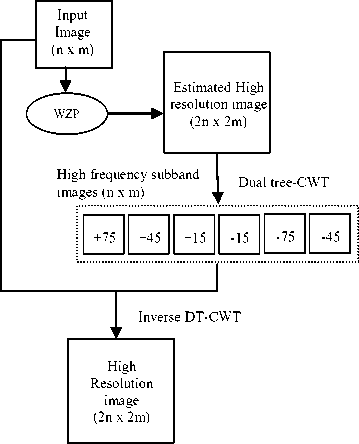
Fig 6: CWT based image resolution enhancement technique.
low resolution image. A typical value of k = 4 gives best performance having less smoothing and ringing artifacts. Fig. 5 shows the CS and ER based resolution enhancement technique. There is another similar technique [17], which is based on stationary wavelet transformation (SWT), CS and Laplacian sharpeningfilter that performs better than [15-16] and [21].
-
C. Complex WT based enhancement
Complex wavelet transform (CWT) is similar to DWT besides that it produces two complex-valued (real and imaginary) low frequency subbands and six complex-valued high frequency subbands. Each of
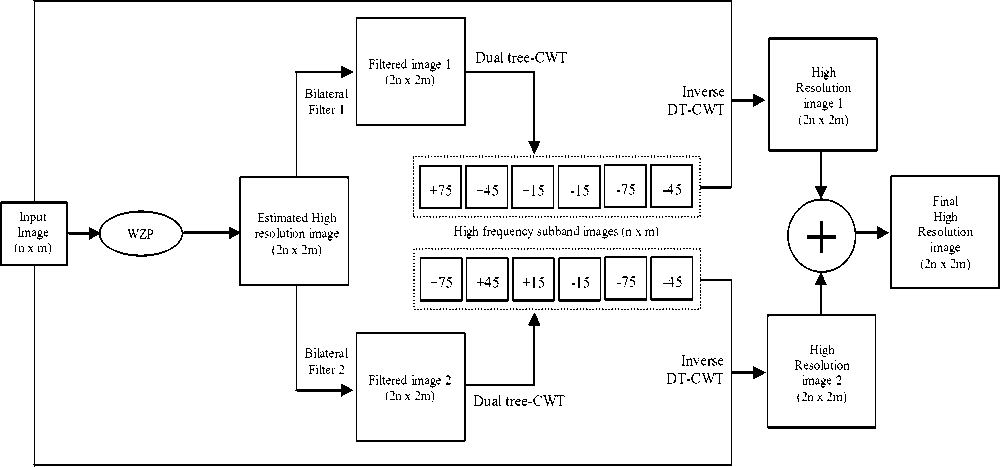
Fig 7: CWT and bilateral filter based image resolution enhancement technique.
this high frequency subband shows maximum magnitude responses for image features tilting at +75o, +45o, +15o, -15o, -45o and -75o. In [18], a simple CWT based image resolution enhancement technique is proposed, where an initial estimated high resolution image generated using WZP, and decomposes it using duel tree CWT to produce low frequency and high frequency subbands. Replace the low frequency subband with the low-resolution image and apply the inverse CWT. Hence produce the high resolution image (see Fig. 6). This technique gives improved result over edge-directed interpolation [7] and CS based techniques [15-16].
An update of the above technique is found in [19] where two edge preserving smoothing filters (bilateral filters with different parameter) is used on the estimated high resolution image. This will produce two different filtered images (see at Fig. 7). Separately, each of these two images is passed through CWT and inverse CWT process with input image padding. Thus produce two high resolution images. Lastly, these two images are averaged to get the final high resolution image.
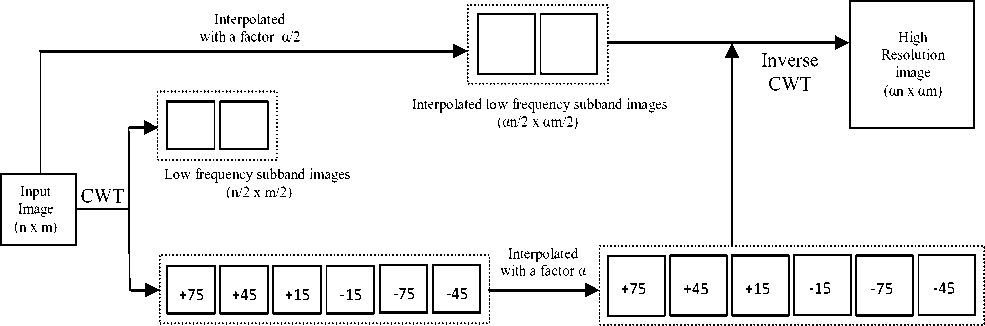
Another CWT based resolution enhancement technique is [3] where high frequency subbands are interpolated using the bicubic interpolation with a factor of α. Also, two higher resolution images are produced by bicubic interpolation of shifted original image with a factor of α/2. Finally, all these interpolated complex valued subbands are put into inverse CWT to produce the high resolution image. Fig. 8 shows block diagram of this CWT and bicubic based enhancement. In this technique, interpolations of high frequency subbands in six different directions are contributing sharpness of edges in those directions. Thus produce sharper images. Resolution enhancement using CWT produces better result than all the conventional techniques for satellite images, as mentioned in [3].
CWT based image resolution approaches are superior to DWT based approaches because CWT is almost rotation and shift invariant and produces fewer artifacts than DWT. Recently, a new Dual Tree (DT) CWT based satellite image resolution technique [20] is proposed where non-local mean filter (NLM) and Lanczos interpolation is used. The Lanczos interpolation has high capability to detect linear
Interpolated high frequency subband images (αn/2 x αm/2)
High frequency subband images (n/2 x m/2)
Fig 8: CWT and bicubic interpolation based image resolution enhancement technique.
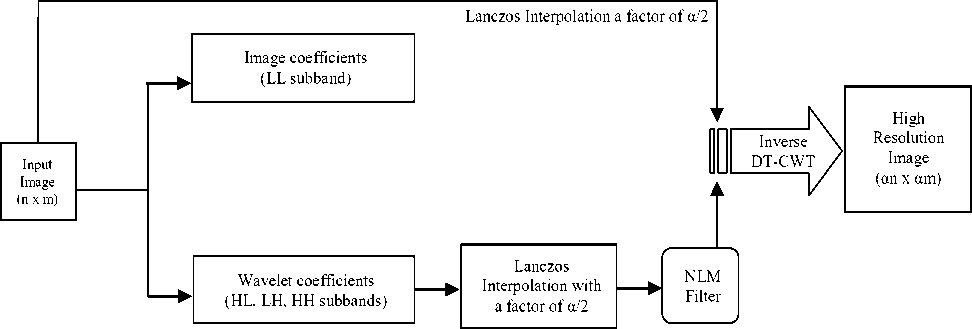
Fig 9: CWT, Lanczos interpolation and NLM filter based image resolution enhancement technique.
features (such as, edge) and also produce less aliasing and ringing effect than the nearest-neighbor, bilinear
and bicubic interpolation. NLM filter is applied on the interpolated image data to reduce the modest artifacts caused by DT-CWT and Lanczos. A simplified block diagram of this novel technique is given at Fig. 9. As we can see in the block diagram, only the wavelet coefficients (HL, LH and HH subbands) are passes through Lanczos interpolation and NLM filter. In the inverse CWT process, interpolated original image is used as image coefficient (LL subband). This technique outperforms all the above CWT based techniques, as well as, DWT, SWT [21-23] and CS-ER [15-16] based techniques for satellite images.
-
D. Discrete WT and stationary WT based enhancement
A simple DWT based image resolution technique is Demirel Anbarjafari Super Resolution (DASR) [21]. In DASR, DWT operation is applied on the low resolution image to separate high frequency components of the image. Then three high frequency subbands, as well as, the original image is interpolated using bicubic interpolation to produce higher resolution coefficients for the inverse DWT. lastly, inverse DWT will produce the high resolution image. A simple block diagram of the DASR technique is shown in Fig 10.
An update of DASR by the same researcher is found in [22] for satellite image resolution enhancement.
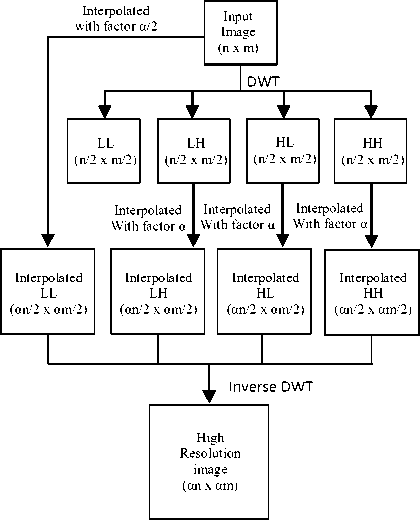
Fig 10: DASR image resolution enhancement technique.
In this technique (see Fig. 11), all four frequency subbands are interpolated using the bicubic interpolation. Interpolated LL subband is subtracted from the original image and the resulted difference
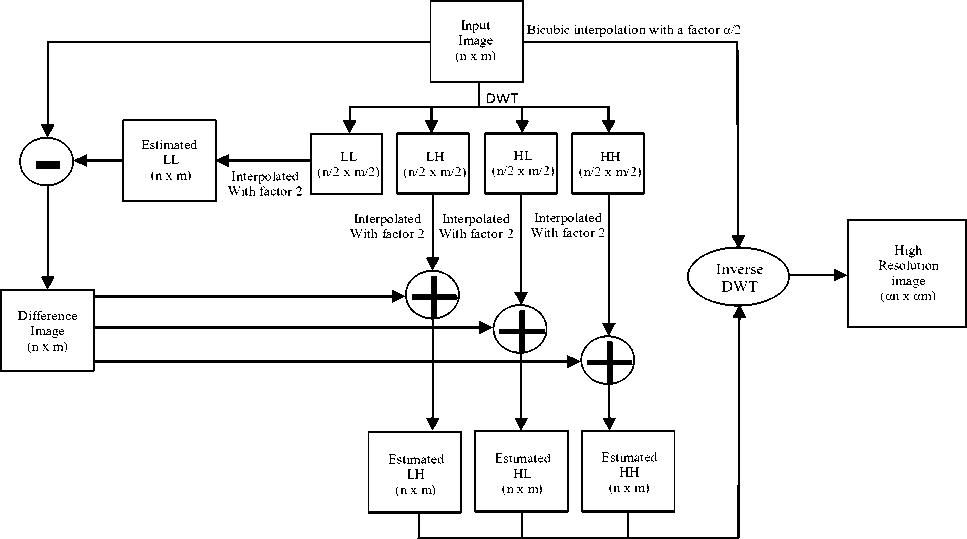
Bicubic interpolation with a factor α/2
Fig 11: DWT and bicubic interpolation based image resolution enhancement technique.
image is added with all three high frequency subbands (HL, LH and HH). Finally, all the estimated high frequency subbands and the original image are placed into inverse DWT process to generate the final high resolution image. This technique gives better result over DASR and CS based techniques.
Bicubic interpolation with a factor α/2
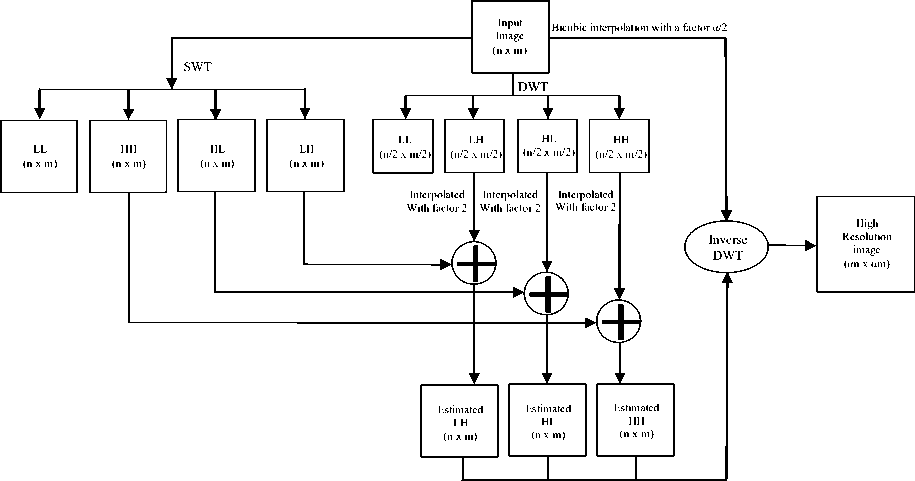
Fig 12: SWT and DWT based image resolution enhancement technique.
In DWT and CWT, a down sampling of the signal take place after passing through each of the filter (see Fig. 1). Because of this down sampling, information loss happens in each frequency subbands. But Stationary Wavelet transformation (SWT) have no down sampling. So, SWT can be used along with DWT to minimize the information loss due to down sampling [23]. As because of no down sampling, four frequency subbands have the same resolution as the low resolution image after SWT. Fig. 12 shows the block diagram of SWT and DWT based image resolution enhancement technique where high frequency subbands from SWT is added with bicubic interpolated DWT subbands. The inverse DWT is used at the end to reconstruct the high resolution image. So far, this technique produces best results in all types of images except satellite image.
In this section, most of the popular (most cited) wavelet based image resolution enhancement techniques have been reviewed and give comments on their performance. In Table I, we have summarized them again and give comments on their enhancement ability.
-
IV. Performance evaluation criteria
In the performance assessment of image resolution enhancement techniques, we should consider both subjective and objective fidelity criteria. For that, we need a set of original high resolution (OHR) image from which low resolution image set can be generated. Apply a resolution enhancement technique on these low resolution images to get back to the initial high resolution condition (see Fig. 13). These images are called generated high resolution (GHR) image. These two image sets (OHR image and GHR image) are the candidate images for subjective and objective comparison.
For subjective comparison between OHR and GHR image, we should consider few visual criteria: consistency in image content, consistency in image contrast, sustaining high frequency features, no artifacts and less blur effect. Contents of GHR image should be
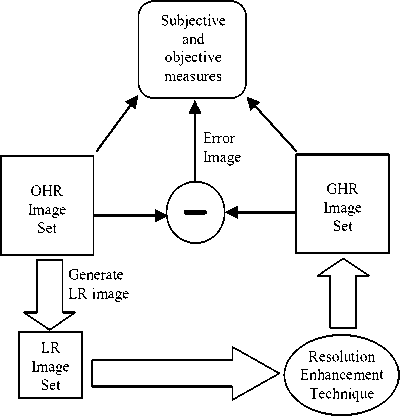
Fig 13: Performance evaluation of a resolution enhancement technique.
consistent with OHR image and their contrast should not be dissimilar significantly. That means there should not be any luminance or contrast distortion.
Presence of high frequency features, like edge, line, points and textures in GHR image is another important criterion. Specially, for satellite image the performance of resolution enhancement technique depends on it. So a technique must have some ability to sustain enough high frequency features in GHR image.
In GHR image, there should not be any blocking, border or ringing artifacts and there should be less blur effect. During objective measures, this artifacts and blur effects are not reflected clearly. So intense subjective measures are important for performance evaluation and fulfilling all these visual criteria makes a technique more strong than others. In addition, we can consider error images as subjective comparison. To generate error image, we need to take the absolute-value of difference between OHR and GHR image (see Fig. 14). For error image, we deserve more black or near black pixels in it, or in another word, we deserve more blackish error image. That means, there is less error or difference exists between OHR and GHR image.
As quantitative measure, we can consider Peak-Signal-to-Noise-Ratio (PSNR) and Root-Mean-Square-Error
(RMSE) between OHR image and GHR image. RMSE can be obtained by using the following equation where Iorg is the OHR image, I ge is the GHR image and (M, N) is the dimension of the image. PSNR can be defined as following (Eqn. 2) where L is the maximum fluctuation in the input image. If we use 8-bit grayscale
^ IJ^orgQlJ')-Ig e (U)) 1
RMSE = sqrt jM (1)
Table I. Summary of different wavelet based techniques
PSNR = 10 1 о g ! 0 (^) (2)
(all pixels have zero intensity value) in the place of original image. For finding a well performed technique, we should consider two objective criteria: less RMSE value and high PSNR value. The ground value of RMSE is 0 and PSNR is infinite, which means GHR image and OHR image is equal. So, our target is to minimize RMSE value and maximize the PSNR value as much as possible. Most of the existing state-of-the-art techniques consider only PSNR as their comparison metric. But only considering PSNR is not a strong metric for finding a superior image resolution technique. We have included entropy value of negative error image as another quantitative measure during performance assessment. Because comparison based on error image is important but difficult to make judgment, when the error image for different technique is very close to each other. The entropy of a negative error image can be denoted as following (Eqn. 3) where pr(rk) is the probability of intensity value rk. For any well-performed resolution
E =-1?к=oP((rk) log2 Р(ГГк) (3)
enhancement technique, this entropy value should be minimum as possible for all testing images. Fig. 14 shows an OHR ‘Peppers’ image and a GHR version of same image using bicubic interpolation, followed by their error image and negative error image. The entropy value of this negative error image is 5.60.
Universal image quality index [26] is another important quantitative measure for evaluating different resolution enhancement technique. This quantitative measure has the ability to reflect different types of distortion and noise induced in the image where PSNR and RMSE show questionable performance. The equation for universal quality index is as following (eqn. 4) where σi is standard deviation of and iavg is average of image i. The range of Q is [-1, 1] where 1 is the best value and -1 is the worst value. A well-performed resolution enhancement technique will give highest Q value than others during performance assessment.
All above quantitative measures are essential criteria during performance evaluation of different resolution enhancement techniques. But most of the recent wavelet based enhancement techniques doesn’t consider all above criteria. In Table II, we have shown which state-of- the-art techniques consider what quantitative criteria. So far, technique [20] has shown best performance than any other techniques for satellite images considering PSNR, RMSE and Q-index. Although visual comparison of negative error image is considered in [20] but entropy calculation is not given there. For natural images, technique [23] shows best performance considering only high PSNR as evaluation criteria. So a complete solution is still needed considering all above visual and quantitative performance evaluation criteria.
-
V. Performance evaluation issues
There are some important issues regarding performance evaluation of different techniques and future research. These issues should be considered when a new technique is compared with other existing techniques. The issues are listed below:
-
- - Quantified and un-quantified image
-
- - Unified HR image dataset
-
- - Diversified HR image dataset
-
- - Enhancement factor
-
- - Speed or running time
-
- - LR image generation
4 ох Оу ха17д Уаяд
( а**а) ) ( х^д+у^д )
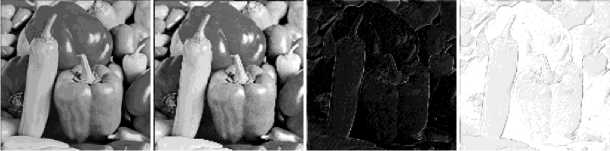
(a) Original
(b) Bicubic
(c) Error image (d) -ve error image
Fig 14: Original and bicubic version of ‘Peppers’ image.
Table II. Presence of four Quantitative Criteria (PSNR, RMSE, Entropy and Q-index) in Different wavelet based techniques.
Ref
RMSE (Root Mean Square Error)
PSNR (Peak Signal to Noise Ratio)
Entropy of –ve error image
Universal Quality index value
[11]
No
No
No
No
[12]
No
Yes
No
No
[13]
No
Yes
No
No
[14]
No
Yes
No
No
[15]
No
Yes
No
No
[16]
No
Yes
No
No
[17]
Yes
Yes
Yes
No
[18]
Yes
No
No
Yes
[19]
No
Yes
No
Yes
[3]
No
Yes
No
No
[20]
Yes
Yes
No
Yes
[21]
No
Yes
No
No
[22]
Yes
Yes
No
No
[23]
No
Yes
No
No
In the performance evaluation of different techniques, we should consider both quantized and unquantized output image. When we calculate PSNR, most of the time unquantized image gives much higher result than quantized image. In Table III, PSNR values for resolution enhancement of famous ‘Lena’ image for three different techniques are given. It is clear in this table that, for all three different techniques, unquantized image gives higher PSNR value than quantized image. So image quantization is an unavoidable issue during comparing different techniques based on PSNR.
Table III. PSNR values of different techniques applied on ‘Lena’ image for resolution enhancement from (128 x 128) to (512 x 512) for both quantized and unquantized output image.
|
Techniques |
PSNR in Decibels |
|
|
Unquantized |
Quantized |
|
|
WZP(Haar) |
21.1114 |
21.1089 |
|
Bicubic |
24.5713 |
22.3096 |
|
Bilinear |
24.9921 |
22.5737 |
Table IV. PSNR values of different techniques applied on ‘Lena’ image of size (64 x 64) for enhancement factor of 2, 4 and 8.
|
Techniques |
PSNR in Decibels |
||
|
Factor 2 |
Factor 4 |
Factor 8 |
|
|
Nearest |
25.2914 |
21.1089 |
17.8632 |
|
Bilinear |
25.4762 |
22.5737 |
19.5784 |
|
Bicubic |
26.3055 |
22.3096 |
19.0307 |
|
Lanczos |
26.2950 |
22.2985 |
19.0197 |
Another important issue is the resolution enhancement or enlargement factor. Most of the time researcher consider only resolution enhancement factor of 2 during comparing different techniques. But for better evaluation and comparison, higher enhancement factor should be considered because the performance can be varied for different factors. Table IV shows PSNR values for ‘Lena’ image considering enhancement factor 2, 4 and 8. In that Table, bicubic method gives highest PSNR at enhancement factor 2 but for factor 4 and 8 bilinear gives the highest PSNR.
Table V. PSNR values of different techniques applied on ‘Lena’ image and ‘Baboon’ image for resolution enhancement from (128 x 128) to (512 x 512).
|
Techniques |
PSNR in Decibels |
|
|
‘Lena’ image |
‘Baboon’ image |
|
|
Lanczos |
22.2985 |
16.9036 |
|
Bicubic |
22.3096 |
16.9203 |
|
Bilinear |
22.5737 |
16.7929 |
Table VI. PSNR values of different techniques applied on ‘Lena’ images having different file size for resolution enhancement from (128 x 128) to (512 x 512).
|
Techniques |
PSNR in Decibels |
|
|
‘Lena’ image (258 KB) |
‘Lena’ image (280 KB) |
|
|
WZP(Haar) |
20.5431 |
21.1089 |
|
Bicubic |
21.7032 |
22.3096 |
|
Bilinear |
22.0826 |
22.5737 |
Performance of a resolution enhancement technique also depends on image features, such as, edges, textures, dominant directions, colors and regularities. This dependency is reflected in Table V where bicubic method gives better performance for edge rich ‘Baboon’ image but not for ‘Lena’ image that has less density of edge. So, for evaluating different techniques, we should consider diversified high resolution image database that contains all types of images. Considering only famous ‘Lena’, ‘Baboon’, ‘Peppers’ and ‘Elaine’ are not sufficient for performance evaluation. Even PSNR value can be different for same image having different file size. In Table VI, different PSNR values are given for same image ‘Lena’ with same resolution, but having different files size. So, we also need a unified standard database as our ground images for experiment and simulation purpose.
In section III of this literature, we have already mentioned that we need to generate LR image from an original HR image. How we can generate a LR image is an important issue of performance evaluation because performance of a resolution enhancement technique in terms of PSNR is highly dependent on the way of LR image generation. There are different ways of generating LR image from HR image, such as, down sampling, discrete wavelet transformation, bicubic, bilinear etc. In Table VII, we have shown PSNR values for ‘Lena’ image using three different resolution enhancement techniques for each LR image generation technique. From that table we can say that, the way of LR image generation has good impact on PSNR.
Table VII. PSNR values of different techniques applied on ‘Lena’ image for resolution enhancement from (128 x 128) to (512 x 512) for each different LR image generation technique.
|
Enhancement Technique |
LR image generation technique |
PSNR in Decibels |
|
WZP(Haar) |
Simple down sampling |
21.1089 |
|
DWT with Haar |
23.8335 |
|
|
bilinear |
23.3911 |
|
|
bicubic |
24.9525 |
|
|
Bilinear |
Simple down sampling |
22.5737 |
|
DWT with Haar |
24.5860 |
|
|
bilinear |
24.0886 |
|
|
bicubic |
25.3462 |
|
|
Bicubic |
Simple down sampling |
22.3096 |
|
DWT with Haar |
25.0365 |
|
|
bilinear |
24.2543 |
|
|
bicubic |
26.4663 |
Running time of a resolution enhancement technique is another important issue during performance evaluation of different techniques. Techniques having low running time are more preferable because they can be used in real time resolution enhancement such as video resolution. In Table VIII, we have given running time of some simple techniques during resolution enhancement of ‘Lena’ image and found huge variation of time for different techniques. So the issue of running time must be considered during comparison and performance evaluation of different techniques. In summary, all the above six issues have huge significance during comparison of different resolution enhancement technique. Avoiding one will lead to a limited or biased solution instead of superior solution. But in most of the recent techniques these issues are unclear or avoided. In Table IX, we have shown the status of above six issues for existing state-of-the-art techniques.
Table VIII. Running time of different techniques applied on ‘Lena’ image for resolution enhancement from (128 x 128) to (512 x 512).
|
Technique |
Time (seconds) |
|
Nearest |
0.002819 |
|
Bilinear |
0.007069 |
|
Bicubic |
0.010160 |
|
Lanczos |
0.010014 |
|
WZP(Haar) |
0.105430 |
VI.Conclusion
Wavelets are being used in many fields of research, as well as, research related to image interpolation and resolution enhancement. So far, many research works, state-of-the-art techniques and conventional methods have been found regarding resolution enhancement. Some of them are unique, popular and well performed. In this literature, most of the popular wavelet based image resolution enhancement techniques have been reviewed and given comments on their enhancement ability. Besides this review we have also discussed some criteria and issues related to performance evaluation of different resolution enhancement techniques. Most of the well performed existing techniques are based on wavelet transformation, but
Table IX: Status of Six Important Issues in Different wavelet based Image Resolution Enhancement techniques.
|
Ref |
Quantized and Unquantized image |
Unified HR Image Database |
Diversify HR image Database |
Enhancement factor |
Running time |
LR image generation |
|
[11] |
Not mentioned |
Reference not given |
Tested only on Lena image |
Not mentioned |
Not mentioned |
Not mentioned |
|
[12] |
Not mentioned |
Reference not given |
Tested only on Lena image |
Not mentioned |
Not mentioned |
Down-sampling of HR image |
|
[13] |
Not mentioned |
Reference not given |
Five well-known test images Lena, Boat, Woman, Baboon and Barbara |
Not mentioned |
Not mentioned |
LL subband of DWT |
|
[14] |
Not mentioned |
Reference not given |
Four well-known test images Lena, Elaine, Baboon, and Peppers |
Factor two and four. |
Not mentioned |
LR versions obtained by first low-pass filtering and then downsampling |
|
[15] [16] |
Not mentioned |
Reference not given |
Number of well known test images including Lena, Elaine, Baboon and Peppers. |
Factor two and four. |
Not mentioned |
LL subband of a quadtree wavelet decomposition of the HR image |
|
[17] |
Not mentioned |
Satellite Imaging Corporation |
Four satellite images |
Factor two and four. |
Not mentioned |
Down-sampling of HR image |
|
[18] |
Not mentioned |
-Natural-color 60cm (2 ft) HR QuickBird satellite image data -Reference not given. |
Tested only on one satellite image |
Factor two and four |
-Time: 10 seconds, -Machine: 2 GHz Intel Core 2 Duo CPU and 2-GB RAM -Coding: Matlab |
LR versions obtained by first low-pass filtering and then downsampling |
|
[19] |
Not mentioned |
Reference not given |
Used six natural images Lena, Elaine, Boat, Peppers, Barbara, Bridge |
Factor two |
Not mentioned |
Using nearest neighbor interpolation and averaging filter |
|
[3] |
Not mentioned |
-Google Earth and Satellite Imaging Corporation -Reference not given |
Five satellite images |
Factor two and four |
Matlab coding, running time not given |
Two Cascaded downsampling in DWT |
|
[20] |
Not mentioned |
- Satellite Imaging Corporation -Reference given |
One Satellite Image “Washington DC” |
Factor four |
Not mentioned |
Down-sampling of HR image |
|
[21] |
Not mentioned |
Reference not given |
Four well-known test images Lena, Elaine, Baboon, and Peppers |
Factor four |
Not mentioned |
Consecutive downsamplings of the OHR images using DWT. |
|
[22] |
Quantized image |
-Google Earth and Satellite Imaging Corporation -Reference not given |
Five satellite images |
Factor four and two |
Matlab coding, running time not given |
Down-sampling of the HR satellite image through two cascaded DWT |
|
[23] |
Not mentioned |
Reference not given |
Four well-known test images Lena, Elaine, Baboon, and Peppers |
Factor four |
Matlab coding, running time not given |
Down-sampling the OHR images. |
they have lack of above important issues and criteria during their performance assessment. So, a new wavelet based technique considering the above criteria and issues is still needed to be searched.
References A State-of-the-art Review on Wavelet Based Image Resolution Enhancement Techniques: Performance Evaluation Criteria and Issues
- Yavariabdi, C. Samir, A. Bartoli, “3D Medical Image Enhancement based on Wavelet Transforms,” Proc. of the Medical image understanding and analysis conf, London, UK, Jul. 2011, pp. 172-176.
- S. Izadpanahi, C. Ozcinar, G. Anbarjafari, and H. Demirel, “Resolution Enhancement of Video Sequences by using Discrete Wavelet Transform and Illumination Compensation,” Turk Journal of Elec. Eng. & Comp. Sci., Vol. 03, Feb. 2011, pp. 123-131.
- H. Demirel and G. Anbarjafari, “Satellite Image Resolution Enhancement Using CWT,” IEEE Geo-science and Remote Sensing Letters, Vol. 07, No. 01, Jan. 2010, pp. 123–126.
- R. C. Gonzalez and R. E. Woods, Digital image processing: 3rd edition, Englewood Cliffs, NJ: Prentice-Hall, 2008.
- A. S. Glassner, K. Turkowski, and S. Gabriel, “Filters for Common Re-sampling Tasks,” Graphics Gems, New York: Academic, 1990, pp. 147–165.
- M. Irani and S. Peleg, “Improving Resolution by Image Registration,” CVGIP: Graph. Models Image Process, Vol. 53, No. 3, May.1991, pp. 231–239.
- X. Li and M.T. Orchard, “New Edge-directed Interpolation,” IEEE Trans. Image Proc., Vol. 10, No.10, Oct. 2001, pp. 1521-1527.
- Y. Dong and J. Ma, “Wavelet-Based Image Texture Classification Using Local Energy Histograms,” IEEE Signal Processing Letters, Vol. 18, No. 04, Apr. 2011, pp. 247-250.
- H. Demirel, C. Ozcinar, and G. Anbarjafari, “Satellite Image Contrast Enhancement Using Discrete Wavelet Transform and Singular Value Decomposition,” IEEE Geo-science And Remote Sensing Letters, Vol. 07, No. 02, Apr. 2010, pp. 333-337.
- B. Li, R. Yang and H. Jiang, “Remote-Sensing Image Compression Using Two-Dimensional Oriented Wavelet Transform,” IEEE Geo-science And Remote Sensing Letters, Vol. 49, No. 01, Jan. 2011, pp. 236-240.
- K. Kinebuchi, D. D. Muresan and T.W. Parks, “Image Interpolation using Wavelet-Based Hidden Markov Trees,” Proc. ICASSP ‘01, Vol. 03, May. 2001, pp. 07-11.
- S. Zhao, H. Han and S. Peng, “Wavelet Domain HMT-Based Image Superresolution,” IEEE International Conference on Image Proc.(ICIP), Vol.0 2, Sep. 2003, pp. 933-936.
- D.H. Woo, I.K. Eom and Y.S. Kim, “Image Interpolation based on Inter-scale Dependency in Wavelet Domain,” Proc. International conference of image processing (ICIP), Vol. 03, Oct. 2004, pp. 1687-1690.
- A. Temizel, “Image Resolution Enhancement using Wavelet Domain Hidden Markov Tree and Coefficient Sign Estimation,” Proc. International conference of image processing (ICIP), Vol. 05, 2007, pp. V-381–V-384.
- A. Temizel and T. Vlachos, “Wavelet Domain Image Resolution Enhancement Using Cycle Spinning,” IEE Electronics Letters, Vol. 41, No. 03, Feb. 2005, pp. 119-121.
- T. Celik and T. Tjahjadi, “Image Resolution Enhancement Using Dual-tree Complex Wavelet Transform,” IEEE Geo-science and Remote Sensing Letters, Vol. 7, No. 03, Dec. 2009, pp. 554 – 557.
- T. Celik and H. Kusetogullari, “Self-Sampled Image Resolution Enhancement Using Dual-Tree Complex wavelet Transform,” 17th European Signal Processing Conference, Aug. 2009, pp-2017-2021.
- A. Temizel and T. Vlachos, “Wavelet Domain Image Resolution Enhancement using Cycle Spinning and Edge Modeling,” 13th Europian signal processing conference, Sep. 2005, pp. 203-205.
- S. Azam, F. T. Zohra, and M. M. Islam, “Remote Sensing Image resolution Enlargement Algorithm based on Wavelet Transformation,” IJIGSP, MECS Publisher, Vol. 06, No. 03, May-2014, pp. 19-26.
- M. Z. Iqbal, A. Ghafoor and A. M. Siddiqui, “Satellite Image Resolution Enhancement Using Dual-Tree Complex Wavelet Transform and Nonlocal Means,” IEEE Trans. on Geo-science and Remote Sensing Letters, Vol. 10, No. 03, Jul. 2012, pp. 441-455.
- H. Demirel and G. Anbarjafari, “Image Super Resolution based on Interpolation of Wavelet Domain High Frequency Subbands and the Spatial Domain Input Image,” ETRI Journal, Vol. 32, No. 03, Jun. 2010, pp. 390–394.
- H. Demirel and G. Anbarjafari, “DWT based Satellite Image Resolution Enhancement,” IEEE transaction on Geo-science and Remote Sensing, Vol. 49, No. 06, Jun. 2011, pp. 1997–2004.
- H. Demirel and G. Anbarjafari, “Image Resolution Enhancement by Using Discrete and Stationary Wavelet Decomposition,” IEEE Trans. Image Processing, Vol. 20, No. 5, May. 2011, pp. 1458-1460.
- “Satellite Imaging Corporation,” internet: http: //www.satimagingcorp.com/gallery.html, [Oct. 07, 2013].
- “Hidden Markov Model,” internet: http://en.wikipedia.org/wiki/Hidden_Markov_model, [Nov. 10, 2013].
- Z. Wang and A. C. Bovik, “A Universal Image Quality Index,” IEEE Signal Processing Letters, Vol. 09, No.0 3, Mar. 2002. pp. 81-84.
