A Statistical Approach for Iris Recognition Using K-NN Classifier

Author: Dolly Choudhary, Ajay Kumar Singh, Shamik Tiwari
Journal: International Journal of Image, Graphics and Signal Processing(IJIGSP) @ijigsp
Article in issue: 4 vol.5, 2013.
Free access
Irish recognition has always been an attractive goal for researchers. The identification of the person based on iris recognition is very popular due to the uniqueness of the pattern of iris. Although a number of methods for iris recognition have been proposed by many researchers in the last few years. This paper proposes statistical texture feature based iris matching method for recognition using K-NN classifier. Statistical texture measures such as mean, standard deviation, entropy, skewness etc., and six features are computed of normalized iris image. K-NN classifier matches the input iris with the trained iris images by calculating the Euclidean distance between two irises. The performance of the system is evaluated on 500 iris images, which gives good classification accuracy with reduced FAR/FRR.
Iris recognition, Texture feature, K-NN, Hough transform
Short address: https://sciup.org/15012699
IDR: 15012699
Text of the scientific article A Statistical Approach for Iris Recognition Using K-NN Classifier
Iris recognition is a method of biometric authentication that uses pattern-recognition techniques based on high resolution images of the irises of an individual's eyes [1]. The human iris, an annular part between the pupil (generally, appearing black in an image) and the white sclera has an extraordinary structure and provides many interlacing minute characteristics such as freckles, coronas, stripes, etc. These visible characteristics, which are generally called the texture of the iris, are unique. While most biometric have 13 to 60 distinct characteristics, the iris is said to have 266 unique spots. Each eye is believed to be unique and remain stable over time. The performance of iris recognition system depends mainly on two factors: image acquisition and iris recognition algorithm [2].
This work implements a system that considers both factors and focuses on feature extraction of iris. Although a number of systems have been proposed earlier. Huang and Hu [3] declare that at present, the methods proposed by Daugman, Wildes et al., Boles and Boashash are well-known among the existing methods. Daugman uses the multiscale Gabor filters to perform a coarse quantization of the local texture signal, and an iris code computed at 2048 bits. Texture classification system based on Gray Level Cooccurrence Matrix (GLCM) is presented in [4]. They have calculated GLCM from the original texture image and the differences calculated along the first non singleton dimension of the input texture image.
Different texture images are classified based on wavelet texture feature and neural network in [5].
Nearest neighbor search is one of the most popular learning and classification techniques introduced by Fix and Hodges [6], which has been proved to be a simple and powerful recognition algorithm. Cover and Hart [7] showed that the decision rule performs well considering that no explicit knowledge of the data is available. A simple generalization of this method is called K-NN rule, in which a new pattern is classified into the class with the most members present among the K nearest neighbors, can be used to obtain good estimates of the Bayes error and its probability of error asymptotically approaches the Bayes error [8].
This Paper is organized in to five different sections. In the second section isolation of the iris portion is discussed. Different statistical texture features are discussed in Section 3. Next section is about matching algorithm using K-NN classifier using Euclidian distance. In section five the methodology of the work is presented. Implementation and result achieved would be discussed in the last section.
-
II. isolation of the iris
The first stage of iris recognition is to isolate the actual iris region in a digital eye image. The iris region, shown in Figure 1, can be approximated by two circles, one for the iris/sclera boundary and another, interior to the first, for the iris/pupil boundary. The eyelids and eyelashes normally occlude the upper and lower parts of the iris region. Also, specular reflections can occur within the iris region corrupting the iris pattern.
A technique is required to isolate and exclude these artifacts as well as locating the circular iris region. An automatic segmentation algorithm based on the circular Hough transform is employed by Kong and Zhang [9] is applied.
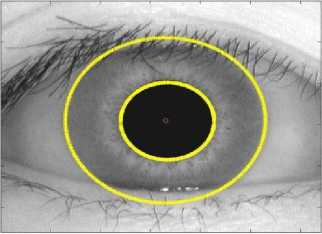
Figure 1. After applying Hough Transforms
The segmentation process involves the following steps:
-
i. Median filtering of original images to diminish
eyelashes.
-
ii. Applying Hough Transform on image to detect
pupil and iris circles.
-
iii. Creating the mask for iris boundary.
-
iv. Convolving the mask with image achieved in step i.
-
v. Creating the mask for pupil region.
-
vi. Convolving the mask with image achieved in step iv.
Above steps provide the different parameters for pupil and iris region like center of the iris and radius of the iris as well as pupil. These parameters may be represented as centre coordinates x c and y c and the radius r , which defines circle according to the equation
xc2 + yc2 - r2 = 0
A mask is created to isolate iris region from the original eye image, then a mask to exclude pupil region created. Created masks are convolved with the original image which results in iris region. Then second mask is convolved with image achieved in previous step. The segmentation process is shown in the figure 2.
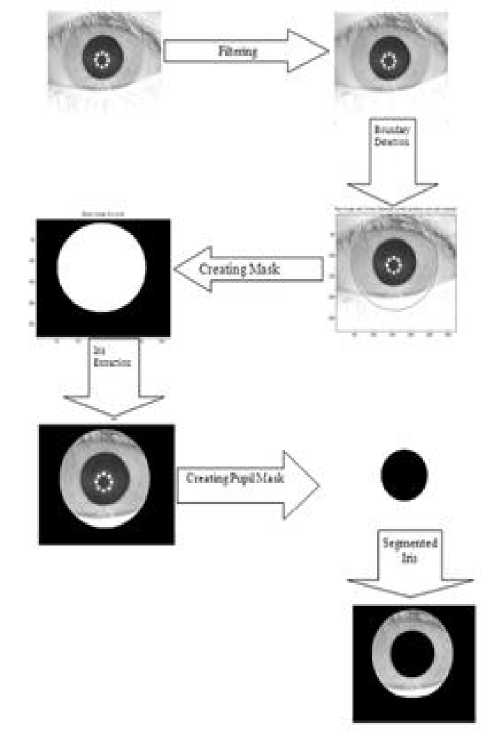
Figure 2. Segmentation of the Iris from Eye image
Once the iris region is successfully segmented from an eye image, the next stage is to transform the iris region so that it has fixed dimensions in order to allow comparisons. The dimensional inconsistencies between eye images are mainly due to the stretching of the iris caused by pupil dilation from varying levels of illumination.
-
III. doughman ’ S R ubber S heet M odel
The homogenous rubber sheet model devised by Daugman [10] remaps each point within the iris region to a pair of polar coordinates ( r,θ ) where r is on the interval [0,1] and θ is angle [0,2π] as shown in the figure 3.
The remapping of the iris region from (x,y) Cartesian coordinates to the normalized non-concentric polar representation is modeled as
I ( x ( r ,θ ), y ( r ,θ )) → I ( r ,θ ) (1)
With
x ( r ,θ ) = (1 - r ) xp (θ ) + rxl (θ ) (2)
y(r, 6 ) = (1 - r)y p ( 6 ) + iy i ( 6 )
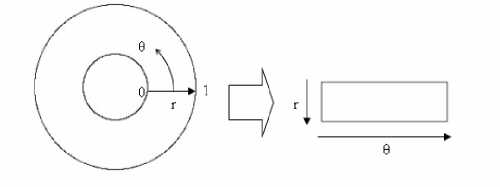
Figure 3. Daugman’s rubber sheet model
1N
skew = — У [x, - x ]3 N t!
E. Feature (5)
Energy is statistical measure given in equation 6
energy = tt P d2 ( 1 , j )
ij
The gray level co-occurrence matrix P for
-
IV. feature encoding using statistical texture FEATURES
Texture is a property that represents the surface and structure of an image. Generally speaking, Texture can be defined as a regular repetition of an element or pattern on a surface. Statistical methods analyze the spatial distribution of gray values, by computing local features at each point in the image, and deriving a set of statistics from the distributions of the local features [11]. Depending on the statistical analysis of the image six features are extracted as follows:
displacement vector d=( d x , d y ) is defined in equation 7. The entry (i , j) for P is the number of occurrences of the pair of gray levels i, j which are distance d apart.
Pd (i, j) = |{((r, s), (t, v)): I(r, s) = i, I(t, v) = j} | (10)
F. Feature (6)
Entropy is calculated as given in the equation 8
ij
entropy = -tt Pd(i, j )log Pd(i, j) (11)
ij
-
A. Feature (1)
Mean or the average as described in the equation
1N x = ^t(x- x) (4)
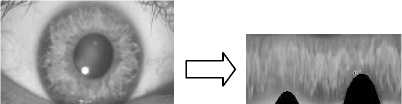
Figure 4. Normalization of the image from CASIA Database
-
B. Feature (2)
The standard deviation: The best known measure of the spread of distribution is simple variance defined in equation 2.
1 n
var =----У (x; - x)2 N - 1i=1V i
The standard deviation is a well known measure of deviation from its mean value and is defined in equation 3 as the square root of variance
C T =
var
-
C. Feature (3)
Smoothness is measured with its second moment as in given equation 4
Smoothness = 1--- (7)
(1 + var)
-
D. Feature (4)
The skewness, or third moment, is a measure of asymmetry of distribution given in equation 5.
V. matching with k - nn classifier
In pattern recognition field, KNN is one of the most important non-parameter algorithms [12] and it is a supervised learning algorithm. The classification rules are generated by the training samples themselves without any additional data. The KNN classification algorithm predicts the test sample’s category according to the K training samples which are the nearest neighbors to the test sample, and judge it to that category which has the largest category probability. The process of KNN algorithm to classify sample X is [13]:
-
• Suppose there are j training categories C1,C2,…,Cj and the sum of the training samples is N after feature reduction, they become m-dimension feature vector.
-
• Make sample X to be the same feature vector of the form (X1, X2,…, Xm), as all training samples.
• Calculate the similarities between all training samples and X. Taking the ith sample di (di1,di2,…,dim) as an example, the similarity SIM(X, d i ) is as following:
SIM(x, di)
m
X X j d j j = i
( m
Л m
X j
X d j < j = 1 7
-
• Choose k samples which are larger from N similarities of SIM(X, d i ), (i=1, 2,…, N), and treat them as a KNN collection of X. Then, calculate the probability of X belong to each category respectively with the following formula.
P(X, C j ) = X SIM(x, d i ).y(d i , c j ) d
Where y(d i , C j ) is a category attribute function, which satisfied
Г 1 y(d i ,C j ) = ^
Lo di^Cj di^Cj
• Judge sample X to be the category which has the largest P(X, C j ).
VI. methodology
The basic structure of the iris recognition system is shown in the figure 5. It starts with acquisition of the eye image and then followed by isolation of the iris portion, i.e. segmentation of the iris. This is very important step which may affect the performance of the whole system. Iris normalization and enhancement involves converting the polar coordinate system to Cartesian coordinate system. Then converting the iris region from Cartesian coordinates to the normalized non-concentric polar representation is modeled, which is followed by texture feature extraction using statistical approach. Once the iris is encoded then it is matched with the template stored in database.
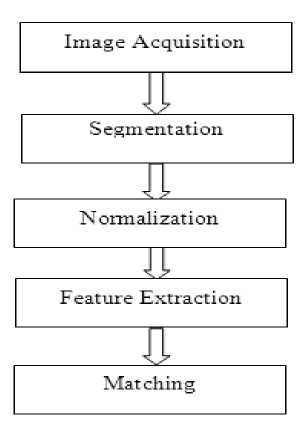
Figure 5. Steps involved in iris recognition
-
A. Data Set
To evaluate the performance of the proposed method, we use the public database: CASIA-IrisV2 [14]. CASIA Iris Image Database Version 2.0 (CASIA-IrisV2) includes two subsets captured with two different devices: Iris pass developed by OKI and self-developed device CASIA-IrisCamV2. Each subset includes 1200 images from 60 classes. It was not possible to use all of the eye images from each database, since perfect segmentation success rates were not attained. Instead a sub-set of each database was selected, which contained only those images that were segmented successfully. So in this work 22 different categories are taken for training and testing the performance. Sample eye images of the 22 categories are shown in the figure
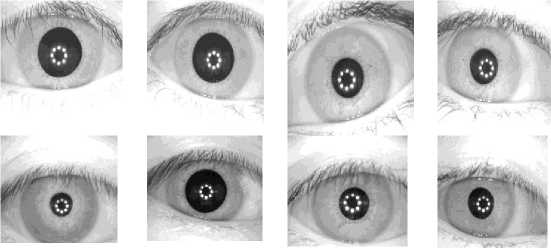
Figure 6. Sample eyes from CASIA-IrisCamV2
-
B. Experimental Setup
The performance of the system is evaluated over 22 different iris. The whole experiment is divided into five sub experiments. Every experiment uses 4 eye images of each category for training or templates, and 15 eye images of each category are taken for testing. In the training phase of each experiment firstly iris is extracted from eye image using the algorithm discussed in section 2. Then extracted iris is normalized followed by feature encoding. The same procedure is followed for testing phase, where the unknown encoded iris is matched with the templates of training images. In the first experiment the performance is measured in five different iris categories having 20 training images and 75 testing eye images. This process is repeated for 10 different iris with 40 training images and 150 testing images in the second experiment. This process is repeated for five different experiments with different categories of iris as shown in the table.
-
VII. result discussion
The performance of iris recognition system is based on FAR (false acceptance rate), FRR (false reject rate) and over all accuracy. The comparison is made between the test image and template in the database by K-Nearest Neighbor classifier. Where K represents the number of votes taken for decision making. The performance in each experiment is investigated for different number of nearest neighbors K=1, 2, 3…..10. The plot between the overall accuracy in percentage and the value of K is shown in figures 7,8,9,10,11. These experiment shows that as the number of nearest neighbors are increased the performance decreases. From these experimental results it can be observed that by increasing the no. of iris class performance is affected negatively. Table 1 shows the performance of different experiments that increasing the number of Iris class decrease the performance of the system. The highest performance of the system is achieved in the first experiment as 97.5 percent.
TABLE I. performance evaluation
|
No of Iris Class |
No of Test Iris |
No. of Training Iris |
Overall Accuracy |
|
5 |
75 |
4 |
97.5 |
|
10 |
150 |
4 |
95 |
|
15 |
225 |
4 |
94.16 |
|
20 |
300 |
4 |
95 |
|
22 |
330 |
4 |
93 |
-
VIII. C onclusions
This work has presented an iris recognition system, which was tested on different number of iris class using one database of grayscale eye images in order to verify the performance of iris recognition technology.
Firstly, an automatic segmentation algorithm was presented, which would localize the iris region from an eye image and isolate eyelid, eyelash and reflection areas. Automatic segmentation was achieved through the use of the circular Hough transform for localizing the iris and pupil regions, and masking for removal of unwanted portions. Next, the segmented iris region was normalized to eliminate dimensional inconsistencies between iris regions. This was achieved by implementing a version of Daugman’ s rubber sheet model, where the iris is modeled as a flexible rubber sheet, which is unwrapped into a rectangular block with constant polar dimensions.
Finally, features of the iris were encoded by calculating statistical texture features (STTF) of the normalized iris region to produce a biometric template. The K-NN (K-Nearest Neighbor) classifier was chosen for matching, which gave a measure of Euclidian distance how closely exist between two templates.
TABLE II. S tatistics of iris data set used in five experiments
|
Experiment No. |
No. of different iris class |
Number of eye images in every iris class for Training |
Number of eye images in every iris class for Testing |
|
1 |
5 |
5x4 = 20 |
5x15 = 75 |
|
2 |
10 |
10x4 = 40 |
10x15 =150 |
|
3 |
15 |
15x4 = 60 |
15x15 =225 |
|
4 |
20 |
20x4 = 80 |
20x15 =300 |
|
5 |
22 |
22x4 = 88 |
22x15 =330 |
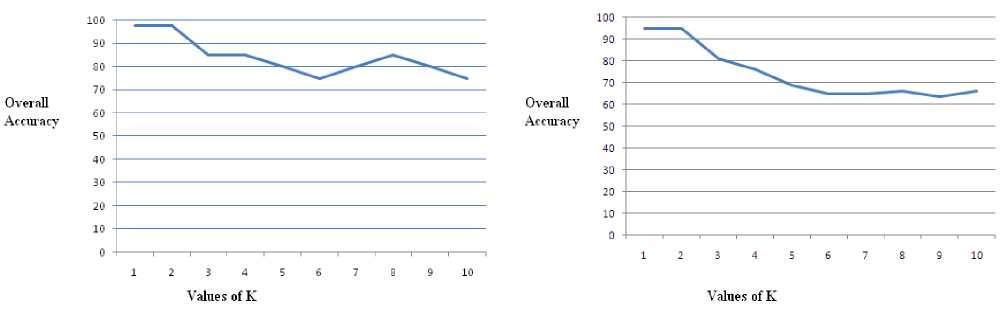
Figure 7: Performance of 5 class Iris recognition System
Figure 8: Performance of 10 class Iris recognition System
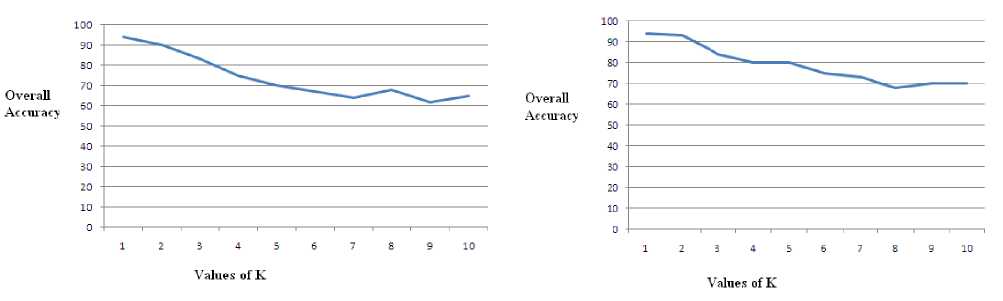
Figure 9: Performance of 15 class Iris recognition System Figure 10: Performance of 20 class Iris recognition System
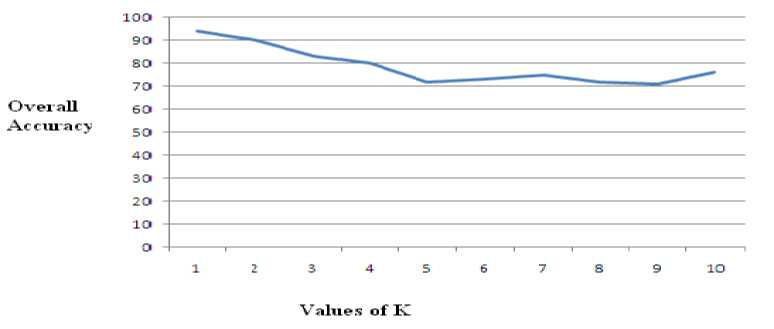
Figure 11: Performance of 22 class Iris recognition System
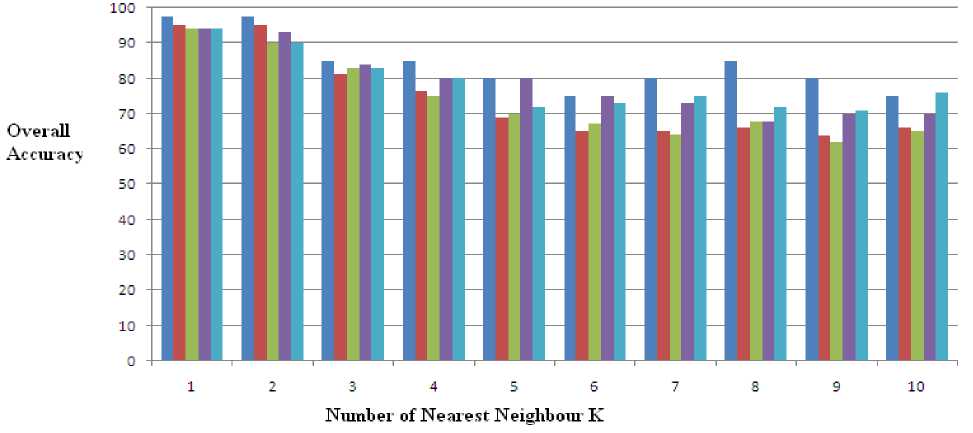
Figure 12: Performance of 22 class iris recognition System
References A Statistical Approach for Iris Recognition Using K-NN Classifier
- Sudipta Roy, Abhijit Biswas, A Personal Biometric Identification Technique based on Iris Recognition, (IJCSIT) International Journal of Computer Science and Information Technologies, Vol. 2 (4) , pp. 1474- 1477 , 2011.
- Basit, M. Y. Javed, M. A. Anjum, Efficient Iris Recognition Method for Human Identification, World Academy of Science, Engineering and Technology 4, 2005.
- H. Huifang, and H. Guangshu, "Iris Recognition based on Adjustable Scale Wavelet Transform" in Proc. IEEE, 2005.
- Suresh, K. L. Shunmuganathan, "Image Texture Classification using Gray Level Co-Occurrence Matrix Based Statistical Features", European Journal of Scientific Research ISSN 1450-216X Vol.75 No.4 (2012), pp. 591-597.
- Ajay Kumar Singh, Shamik Twari and V P Shukla, "Wavelet based multi class image classification using neural network", International Journal of Computer Applications Volume 37 - Number 4 Year of Publication: 2012
- Fix, and J. Hodges, "Discriminatory analysis. Nonparametric discrimination: Consistency properties". Technical Report 4, USAF School of Aviation Medicine, Randolph Field, Texas, 1951.
- T.M. Cover, and P.E. Hart, "Nearest neighbor pattern classification", IEEE Transactions on Information Theory, 13, pp. 21–27, 1967.
- R.O. Duda, and P.E. Hart, Pattern classification and scene analysis, New York: Wiley, 1973
- W. Kong, D. Zhang. Accurate iris segmentation based on novel reflection and eyelash detection model. Proceedings of 2001 International Symposium on Intelligent Multimedia, Video and Speech Processing, Hong Kong, 2001.
- S. Sanderson, J. Erbetta. Authentication for secure environments based on iris scanning technology. IEE Colloquium on Visual Biometrics, 2000.
- Alavanis L K., Mougiakakou S.G., Nikita A. And Nikita K.S., "Evaluation of Texture Features in Hepatic Tissue Charateriztion from non Enhanced CT images", Proceedings of the twenty ninth annual internation conference of the IEEE Engineering in Medicine and Biology Society, Lyon, pp 3741-3744.
- Belur V. Dasarathy, "Nearest Neighbor (NN) Norms: NN Pattern Classification Techniques", McGraw-Hill Computer Science Series, IEEE Computer Society Press, Las Alamitos, California, pp. 217-224, 1991.
- Y. Lihua, D. Qi, and G. Yanjun, "Study on KNN Text Categorization Algorithm", Micro Computer Information, 21, pp. 269-271, 2006.
- Casia-irisv2, institute of Automation, Chinese Academy of Sciences, http://www.cbsr.ia.ac.cn/IrisData.
