A study of ozone anomaly of 2011 in the Northern hemisphere based on Aura satellite data

Author: Kashkin Valentine B., Rubleva Tatiana V.
Journal: Журнал Сибирского федерального университета. Серия: Техника и технологии @technologies-sfu
Article in issue: 6 т.10, 2017.
Free access
In this work we have studied the appearance of analogue of the Antarctic ozone hole in the Northern hemisphere in March 2011. Possible reasons of this phenomenon were the low temperature in the polar region and intense solar flares. The solar activity led to changes in the atmospheric circulation. As a result, in the stratosphere for a while have any rotating circumpolar vortex in the form of a ring in mid-latitudes and low ozone content in the polar region. Our studies revealed a redistribution of ozone mass between the inner and outer part of the vortex with decreasing the total ozone content in the inner part and increases in the outer. A model of the formation of the circumpolar vortex based on atmospheric physics is proposed.
Ozone hole, redistribution of ozone, physical model of circumpolar vortex
Short address: https://sciup.org/146115251
IDR: 146115251 | UDC: 551.511.4, | DOI: 10.17516/1999-494X-2017-10-6-828-834
Озонная аномалия 2011 г. в Северном полушарии, по данным спутника Aura
Изучен аналог антарктической озоновой дыры, возникший в Северном полушарии в марте 2011 года. Возможной причиной появления озоновой дыры была низкая температура в полярной области и интенсивные солнечные вспышки. Повышение солнечной активности привело к изменению в атмосферной циркуляции. В результате в стратосфере на некоторое время возник вращающийся циркумполярный вихрь в виде кольца в средних широтах и с низким содержанием озона в полярных. Наши исследования выявили перераспределение масс озона между внутренней и наружной частями вихря с уменьшением общего содержания озона во внутренней части и увеличением в наружной. Предлагается модель формирования циркумполярного вихря, основанная на законах физики атмосферы.
Text of the scientific article A study of ozone anomaly of 2011 in the Northern hemisphere based on Aura satellite data
The Antarctic Ozone Hole (AOH) has been observed for 30 years. It occurs every year between the months of September and December. The AOH is the central part of the circumpolar vortex (CV), which consists of a ring with elevated total ozone, reaching 400 Dobson units (DU). The diameter of the ring is about 9000 km, and its rotational speed is 10-20 m/s. Total ozone (TO) inside the ring sometimes drops to 80-90 DU. Global satellite data on the ozone layer available at the NASA site [1] have provided the basis for thorough research of the AOH and other similar atmospheric phenomena. They were used to develop a physical model of the formation of the AOH in the Southern Hemisphere [2].
Atmospheric structure similar to AOA, previously has not been observed in the Northern hemisphere. The conditions here are quite different from those in the Southern Hemisphere: the area of land surface is considerably larger, the total ozone concentration is higher, and the zonal velocity of ozone masses is significantly lower. Near the North Pole, as a rule, there is no area with extremely low temperatures, such as at the South Pole; the lowest temperature is observed over the continents (North America, Asia). The North hemisphere and Arctic ozone annual maximum falls in the middle of March.
For the 35 years of satellite monitoring, the only atmospheric phenomenon similar to the circumpolar vortex of the Southern Hemisphere was observed in the Arctic between March 5 and April 6, 2011 (Fig. 1). The inner part of the vortex ring, with a decreased TO, stretched between Canada and the Taimyr Peninsula. The “dip” in the center of CV in Fig. 1 is not a classical ozone hole, as the TO inside the ring is higher than the conditional threshold of 220 DU [3].
The phenomenon was discussed by some authors based of atmospheric chemistry approach [4, 5].
In this study we are focusing on atmospheric physics.
A possible reason for this anomaly might be weak planetary wave driving in February preceded cold conditions in the polar lower stratosphere in March (temperature below 196 K) [4, 6]. A significant solar activity was observed in February and March 2011 [7, 8]. The spatial distribution of the atmosphere pressure variations associated with solar activity and cosmic rays seems to be determined by their influence on the circulation of the atmosphere [9]. Because of this air flow for some time was curled up in the ring, and there was a dramatic increase of the zonal angular velocity in polar region (60°-85° N) up to 20 m/s. The vortex rotation was unstable, its shape changed during the period. The planetary wave apparently destroyed the Arctic polar vortex in April 6.
The graph of the angular velocities of the zonal ozone mass transfer W in the stratosphere, 60°–65° N, is for the period between March 1 and April 11, 2011 (Fig. 2). The graph was plotted following the procedure described elsewhere [10]. The procedure based on a comparison of global digital space-born TO maps for consecutive two days. In the period, minimal TO values (below 250 DU) were observed north of Canada for 27 days [3]. For one week at the end of March, TO dropped to 220-230 DU, and the degree of polar ozone loss was unprecedented.
In March 2011, the average zonal angular velocity of ozone mass transfer W in the polar region was 11° per day. That was almost twice higher than W = 5.6° per day, the value characteristic of March during 1997-2004 [10]. Peak velocity was near 20° per day on 10 March.
In spring 2011, a vast anticyclone was formed in the polar and adjacent regions of the Northern Hemisphere; the atmospheric pressure in the atmosphere close to the pole increased considerably. The air currents began to move from the pole to middle latitudes, in all directions.
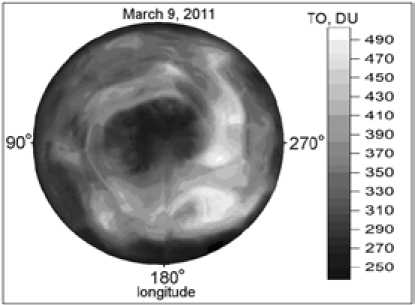
Fig. 1. Circumpolar vortex in the Northern Hemisphere in March 9, 2011
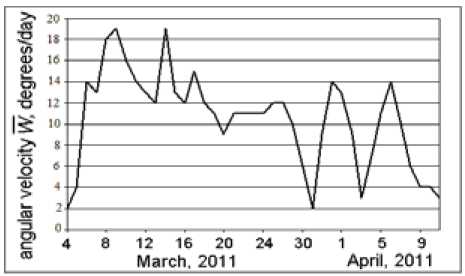
Fig. 2. Variations in the angular velocity in the 60°-65° N region in the spring of 2011
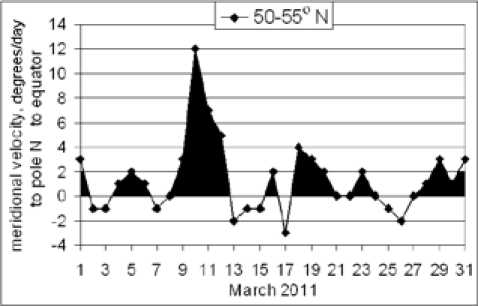
Fig. 3. Meridional velocity in March 2011. Black color corresponds to outflow of ozone from the polar latitudes to middle latitudes
In the middle stratosphere, the air currents began to move along with the ozone from tropical latitudes to middle and polar latitudes (principle of Brewer-Dobson) [2]. One can see Fig. 3, which shows meridional velocity component of the ozone mass in the latitude of 50-55° in March. The movement from the tropics towards the pole in Fig. 3 corresponds to negative values of speed. But the outflow of ozone from the polar latitudes to middle latitudes (black color) dominates in March.
The deflecting force of the Earth’s rotation (Coriolis force) hampers these currents and deflects them to the east; thus, the currents move along a circular path. Under these conditions, the following is valid [2]:
-
V 2 Δ
m R + Δ r = 2 Ω Vm sinφ. (1)
φ
Л Р
The left-hand side also contains pressure gradient in the r direction from the pole. The right hand side of (1) contains the Coriolis force; here Ω = 7.2921·10–5 radians/s – the angular speed of Earth’s rotation.
The Coriolis force and centrifugal force depend on latitude φ; at a certain latitude, φ 0 , the Coriolis force has the highest hampering effect. It should be expected that air masses (including ozone) transferred from the polar region would concentrate close to this latitude, and a CV ring would develop. To find latitude φ 0 , let us calculate a φ derivative from (1) and equate it to zero 0
-
-^ - 2" ^ ^ = 0. (2)
RE cos φ
Expression (2) is transformed into x3 + 3px + 2q = 0, x = cos2 ф, p =
V 2
12Q 2 R 2
E
V 2
8Q 2 R 2
E
Taking into account that discriminant D = p 3 + q 2 > 0 and p 3 << q 2 , we obtain:
φ0
= arccos
2 3 V
2QR,
E
On March 9, W =19° per day, which corresponds to V ≈ 18 m/s. Calculations based on formula (3) show that the highest TO is at latitude φ 0 = 59°. The radius of the ring in Fig. 1, along the midline, is 3280 km. On the other hand, the latitude of the TO maximum can be found from the satellite data, using TO zonal means offered in [1].
Zonal means are TOC daily values averaged over the longitudes between -179.5° and 179.5°, in the 5-degree latitude range, e.g., between 52.5° and 57.5°. The graphs of zonal means for three days of the spring of 2011 are shown in Fig. 4. The curve for March 9 demonstrates that the highest TO be at latitude of 60°, which is close to the latitude φ0 determined above. The part of the graph above 300 DU describes the ring profile averaged over longitudes. Analysis of the curve for March 9 suggests the redistribution of ozone between the inner part of the CV and the ring: the decrease in the ozone concentration in the inner part and the increase in the ring – an event similar to that occurring in the Southern Hemisphere in spring [2].
If subsequent events had developed according to the Southern Hemisphere scenario, the rotational speed of ring V would have decreased gradually, and ozone would have moved from the ring to the polar region. However, in April, the ozone anomaly shifted to Eurasia (Fig. 5). A possible reason for that could be the warming, which, according to [12], occurred in late March. Relatively low TO was observed above a vast area, between Arkhangelsk and Yakutsk and between Yekaterinburg and Dixon, the total ozone dropping by 25-30%.
The second warming occurred in early April. As can be seen from Fig. 5, on April 10, TO was the highest at the pole, while the lowest TO values had shifted southward. By that time, the ozone anomaly had shrunk considerably, covering part of the northern West Siberia and the Krasnoyarsk Territory. In these regions, the lowest TO value reached 220 DU; that was lower than the minimal TO in the Arctic in mid-March, a possible reason being ozone chemical destruction.
V.V. Zuev et al [13] found that destruction of the stratospheric ozone layer in Siberia in April 2011, had been caused by the eruption of Merapi Volcano in Indonesia in November 2010. In the following
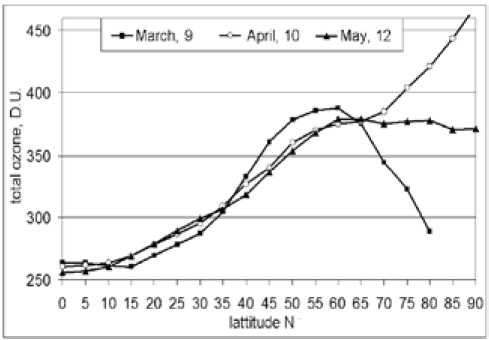
Fig. 4. Latitude dependence of zonal means
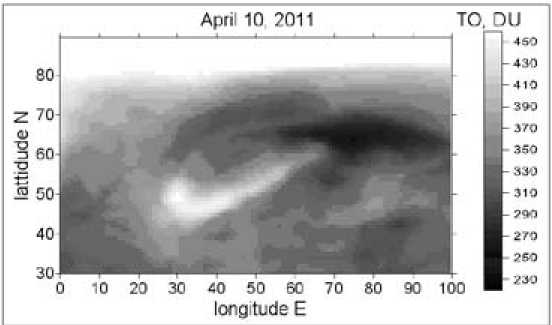
Fig. 5. Ozone anomaly shifting to Siberia months of 2011, TO values above the greater part of Russia and Western Europe were lower than their long-term annual averages.
Our study showed that natural physical factors had contributed considerably to the development of the North Hemisphere ozone anomaly 2011.
References A study of ozone anomaly of 2011 in the Northern hemisphere based on Aura satellite data
- Access mode: URL: ftp://jwocky.gsfc.nasa.gov/pub/omi/data
- Кашкин В.Б. Исследование антарктического озоновогоциркумполярного вихря с использованием данных спутникового дистанционного зондирования, Журнал СФУ. Техника и технологии, 2015, 2 (8), 238-246
- Кашкин В.Б., Рублева Т.В., Хлебопрос Р.Г. Арктическая озонная аномалия 2011 года, Тезисы докладов XVII Всероссийского симпозиума Сложные системы в экстремальных условиях, Красноярск: ФГБУН КНЦ, 2014, 22
- Manney G.L., Santee M.L., Rex M. et al. Unprecedented Arctic ozone loss in 2011, Nature, 2011, 478 (7370), 469-475 DOI: 10.1038/nature10556
- B.-M. Sinnhuber, G. Stiller, R. Ruhnke, T. et al. Arctic winter 2010/2011 at the brink of an ozone hole, Geophys. Res. Lett., 2011, 38, L24814, DOI: 10.1029/2011GL049784
- Hurwitz M.M., Newman P.A. and Garfinkel C.I. The Arctic vortex in March 2011: a dynamical perspective, Atmos. Chem. Phys., 2011, 11, 11447-11453, DOI: 10.5194/acp-11-11447-2011
- Access mode: URL: http://www.tesis.lebedev.ru/info/tesis_20110301.php
- Access mode: URL: http://www.swpc.noaa.gov/products/goes-x-ray-flux
- Veretenenko S., Ogurtsov M. Regional and temporal variability of solar activity and galactic cosmic ray effects on the lower atmosphere circulation, Adv. Space Res., 2012, 49, 770-783.
- Кашкин В.Б., Рублева Т.В. Зональное движение масс озона в нижней стратосфере по спутниковым данным, Оптика атмосферы и океана, 2014, 27 (9), 826-832.
- Кашкин В.Б., Рублева Т.В. Изучение зональной циркуляции озона в нижней стратосфере средних широт на основе спутниковых данных, Материалы XX Международного симпозиума Оптика атмосферы и океана. Физика атмосферы, Новосибирск, 2014, 143-147
- Ананьев Л.Б., Звягинцев А.М., Кузнецова И.Н., Нахаев М.И. Особенности общего содержания озона и циркуляции в нижней стратосфере в зимне-весенний период 2011 года, Труды Гидрометцентра России, M.: Гидрометеоиздат, 2012, 347, 44-60
- Зуев В.В., Зуева Н.Е., Савельева Е.С. и др. О роли извержения вулкана Мерапи в аномальном понижении ОСО над Томском в апреле 2011 г., Оптика атмосферы и океана, 2015, 28 (12), 1090-1094
