A study on test variable selection and balanced data for cervical cancer disease

Author: Kemal Akyol
Journal: International Journal of Information Engineering and Electronic Business @ijieeb
Article in issue: 5 vol.10, 2018.
Free access
Cancer is a pestilent disease. One of the most important cancer kinds, cervical cancer is a malignant tumor which threats women's life. In this study, the importance of test variables for cervical cancer disease is investigated by utilizing Stability Selection method. Also, Random Under-Sampling and Random Over-Sampling methods are implemented on the dataset. In this context, the learning model is designed by using Random Forest algorithm. The experimental results show that Stability Selection, Random Over-Sampling and Random Forest based model are more successful, approximately 98% accuracy.
Cervical cancer, the importance of test variables, random over-sampling, random under-fitting, stability selection, random forest
Short address: https://sciup.org/15016143
IDR: 15016143 | DOI: 10.5815/ijieeb.2018.05.01
Text of the scientific article A study on test variable selection and balanced data for cervical cancer disease
Published Online September 2018 in MECS DOI: 10.5815/ijieeb.2018.05.01
Cancer is a disease that requires a long struggle in the pecuniary and spiritual direction besides the health problems brought with it. According to Republic of Turkey Ministry of Health1;
-
a) 14 million people catch to this disease,
-
b) 8.2 million people die each year,
-
c) All people affect without discrimination of age, gender, language, religion or race.
Community-based screening programs are being conducted for breast, cervix, colorectal cancers which are underway in the first place in our country with the recommendation of the World Health Organization. According to these programs, 2.898.424 people were included in the cervical cancer programs in Turkey, 2016.
Cervical cancer is a malignant tumor which threats women's health and lives [1]. It is now a leading cause of mortality worldwide. Efforts to reduce cancer incidence and mortality have been increased during the past five decades [2].
The American Cancer Society 2 predicted that about 12.820 new cases of invasive cervical cancer will be diagnosed and about 4.210 women will die from cervical cancer in the United States for 2017. It is seldom seen in women younger than 20, and more than 15% of cases cervical cancer are found in women over 65. Most cases are found in women younger than 50. In other words, this disease tends to occur in midlife. Death rate for this disease has gone down by more than 50% over the last 40 years for American women. The major reason for this change is the increase of the Pap test usage, which can find changes in the cervix before cancer advances. In addition, this test can detect early stage of cervical cancer.
In this study, the significances of test variables and the effect of Random Under-Sampling (RUS) and Random Over-Sampling (ROS) methods in machine learning are investigated for cervical cancer disease. Random Forest (RF) algorithm is preferred for learning algorithm. The publicly available cervical cancer dataset is used. The rest of this paper is organized as follows; In Section 2, related studies are examined. In Section 3, the dataset and the benefited methods are given in briefly. In Section 4, experimental results are presented in detail. Finally, the conclusion is given in Section 5.
-
II. Related Works
There are numerous studies on this disease. According to Duncan, approximately 400.000 new cases per annum happen. Three out of every four cases in developing countries and only one out of four cases in developed countries are occurring [3]. Demirhindi et al. explored cervical cancer in women population age between 35 and 40, and living in a semi-rural area in the province of Hatay in Turkey, with specific aims of increasing early diagnosis, education and raising population awareness about cancers [4]. In [5], the researcher group introduced the abnormal cervical cytological prevalence rate in Turkey is lower than in Europe and North America. According to this study, this situation might be due to sociocultural differences, lack of population-based screening programs, or a lower HPV prevalence rate in Turkey. Gökgöz and Aktaş investigated the behaviors and information of women which implementing the pap smear test in their studies. This study was carried out in the Public Training Centers of the Municipality of Altındağ, Ankara with 155 women between 15 October and 30 December [6]. Ruzigana et al. presented the key elements for cervical cancer screening programs in order to improve the cervical cancer control in Rwanda [7]. Başaran et al. investigated conventional approaches as well as current imaging methods such as magnetic resonance imaging, positron emission tomography and computed tomography in cervical cancer cases in their study [8]. Eroğlu et al. analyzed the risk of human papillomavirus positivity for cervical cancer improvement and the relation of human papillomavirus with the cervical smear in risk women for cervical cancer. They detected genital warts as the most important risk factor [9]. Aktun et al. researched the advantage of cervicovaginal smear tests performed during pregnancy by comparison with postpartum test results. 179 pregnant women were included in the study [10]. In another study, Denny et al. investigated the ways to lessen the divide between low-income and middle-income countries and high-income countries for breast and cervical cancers [11]. Lees et al. focused on the findings which regard primary human papillomavirus test as well as postvaccine-based screening strategies [12]. Nazlıcan et al. performed cervical cancer screening in women between 35-40 years old in the health center district of Kisecik in Hatay province. In their studies, the authors practiced the Pap smear test in 150 women out of 177 women [13].
-
III. Material and Methods
-
A. Dataset
The publicly available cervical cancer dataset3 which was collected at Hospital Universitario de Caracas in Caracas, Venezuela, comprises demographic information, habits, and historical medical records of 858 patients with 32 attributes and 4 target variables (Hinselmann, Schiller, Cytology, Biopsy). The information about these target variables are as follows:
-
a) Mr. Hinselmann developed Hinselmann test . He designed a device to examine the cervix [14].
-
b) Schiller´s iodine test also named the iodine test, was originally introduced 1933 by Walter Schiller to detect preinvasive lesions [15].
-
c) Cytology test is cervical cancer screening test [16].
-
d) Biopsy test detected the abnormal area; a cervical punch or wedge or cone biopsy under anesthesia [17].
The attributes information in the dataset is given in Table 1.
-
B. Methods
Basically, this study consists of four main stages which include the balancing of data, identification of important test variables, classification and performance evaluation.
Table 1. Attribute information.
|
Data Type |
Attribute |
|
integer |
Age |
|
integer |
Number of sexual partners |
|
integer |
First sexual intercourse (age) |
|
integer |
Num of pregnancies |
|
boolean |
Smokes |
|
boolean |
Smokes (years) |
|
boolean |
Smokes (packs/year) |
|
boolean |
Hormonal Contraceptives |
|
integer |
Hormonal Contraceptives (years) |
|
boolean |
IUD |
|
integer |
IUD (years) |
|
boolean |
STDs |
|
integer |
STDs (number) |
|
boolean |
STDs:condylomatosis |
|
boolean |
STDs:cervical condylomatosis |
|
boolean |
STDs:vaginal condylomatosis |
|
boolean |
STDs:vulvo-perineal condylomatosis |
|
boolean |
STDs:syphilis |
|
boolean |
STDs:pelvic inflammatory disease |
|
boolean |
STDs:genital herpes |
|
boolean |
STDs:molluscum contagiosum |
|
boolean |
STDs:AIDS |
|
boolean |
STDs:HIV |
|
boolean |
STDs:Hepatitis B |
|
boolean |
STDs:HPV |
|
integer |
STDs: Number of diagnosis |
|
integer |
STDs: Time since first diagnosis |
|
integer |
STDs: Time since last diagnosis |
|
boolean |
Dx:Cancer |
|
boolean |
Dx:CIN |
|
boolean |
Dx:HPV |
|
boolean |
Dx |
|
boolean |
Hinselmann (target variable) |
|
boolean |
Schiller (target variable) |
|
boolean |
Cytology (target variable) |
|
boolean |
Biopsy (target variable) |
-
a) The balancing of data: Unbalanced data are balanced by applying RUS which is the elimination of majority class examples (Figure 1.a), and ROS which generates instances to be added into minority class (Figure 1.b), methods [18-19]. These methods are commonly used in literature. For example, Salunkhe and Mali developed a hybrid re-sampling approach named Synthetic Minority Oversampling Technique-Borderline Under-sampling which is the combination of their novel under-sampling technique and Synthetic Minority Oversampling Technique. They aimed to focus on the necessary data of majority class and avoid their removal in order to overcome the limitation of random undersampling [20]. Sumadhi and Hemalatha tried to overcome performance deterioration which occurs due to imbalance dataset, different orientation, scaling in image annotation by choosing an over sampling method for learning the
classifier. First, the proposed classifier is trained up by setting a threshold value which helps to identify the objects correctly and then fractal-based over-sampling technique is used so as to classify the imbalanced dataset [21].
-
b) The importance of test variable: Feature selection is a dimensionality reduction method which is used commonly for a head of classification results. There are many studies on this subject. Kaur and Verma tackled the filtering process for the spam and ham emails by utilizing the n-gram based feature selection technique for removing any noise and outliers in the dataset. They selected best possible features from the corpus and the machine learnings were performed by sending these features to the Multi-Layer Perceptron Neural Network and Support Vector Machine algorithms [22]. Goswami et al. analyzed the entropy, skewness, kurtosis, coefficient of variation and average correlation of the features. They evaluated the viability of feature elimination strategy based on the values of the meta-features for feature selection in clustering [23].

Fig.1. Under-sampling and Over-sampling [19].
In this study, Stability Selection (SS) method is used. It consists of randomly perturbing the dataset many times, is beneficial for both pure attribute selection and data interpretation. The combination of “The Least Absolute Shrinkage and Selection Operator” and its successive regressions are carried out in order to obtain the significance value of test variables [24].
-
c) Classification: A knowledge discovery is done by performing machine learning on the data. Many studies have been practiced in the literature on this subject which is a multi-disciplinary study field. For example, Kumar and Singh predicted the student’s academic performance which is the important issue of higher education system. For this, they used Decision Tree, Naive Bayes, Random Forest, PART and Bayes Network within the frame of 10-
- fold cross-validation [25]. RF classifier algorithm which was introduced by Breiman [26] is used in this study. The number of trees and the samples will be used in each node are determined. The classification of the new dataset is performed by using electing the trees, which have the most votes in these trees [27].
-
d) Performance metrics: The performances of the models are evaluated by using Accuracy (Acc), Sensitivity (Sen) and Specificity (Spe) metrics. The Acc metric given in Equation 1 is the ratio of the number of accurately diagnosed instances to the number of total instances. The Sen metric given in Equation 2 is the ratio of the number of the patients who are classified as correctly to total patients. The Spe metric given in Equation 3 is the ratio of the number of the non-patients who are classified as correctly to total non-patients [28].
Acc= ( TP+TN ) / ( TP+TN+FP+FN ) (1)
Sen = TP/(TP + FN) (2)
Spe=TN/ ( TN+FP ) (3)
where TP is the number of true positives, TN is the number of true negatives, FP is the number of false positives and FN is the number of false negatives.
-
IV. Experimental Results
Figure 2 describes the flowchart of the study. This study is carried out on the Python 3.5 platform imported "scikit-learn" machine learning library. Since there are not enough data in the ‘STDs: Time since first diagnosis’ and ‘STDs: Time since last diagnosis’ features, these features are removed from the dataset.
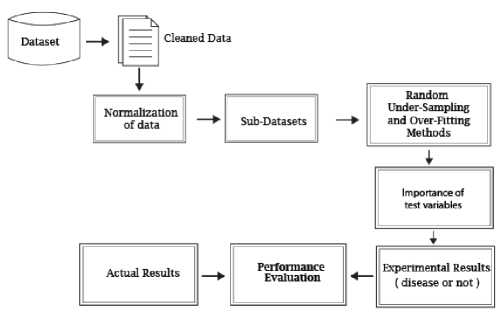
Fig.2. A flowchart of the proposed method.
Also, 190 instances including missing values (‘?’, Null) are removed from the raw dataset. So, there are 668 records in the raw dataset. The datasets for target variables are obtained from the raw dataset and normalized into a range from 0 to 1 values. In the next phase, these datasets are balanced by utilizing RUS and ROS methods. The balanced data obtained with these methods separately are given in Table 2.
Table 2. The information about train and test datasets.
|
Target Variable |
Balanced dataset by utilizing RUS method |
Balanced dataset by utilizing ROS method |
|||||||
|
Hinselmann True 30 False 638 |
Train |
Test |
Train |
Test |
|||||
|
True False |
22 20 |
8 10 |
True False |
441 452 |
197 186 |
||||
|
Schiller True 63 False 605 |
Train |
Test |
Train |
Test |
|||||
|
True False |
42 46 |
21 17 |
True False |
412 435 |
193 170 |
||||
|
Cytology True 39 False 629 |
Train |
Test |
Train |
Test |
|||||
|
True False |
30 24 |
9 15 |
True False |
430 450 |
199 179 |
||||
|
Biopsy True 45 False 623 |
Train |
Test |
Train |
Test |
|||||
|
True False |
31 32 |
14 13 |
True False |
429 443 |
194 180 |
||||
After this step, the significance values of test variables for each outcome variable are calculated by utilizing SS method. These values are presented in Table 3. These datasets are divided into 70-30% train and test data. After this step, training data as the input data are sent to the Random Forest (RF) classifier algorithm and this classifier’s performance is analyzed on testing data. And so, the machine learning is carried out. The classification results and the performance measures which are obtained on the test datasets are presented in confusion matrix structure, Table 4.
Table 3. The significance values of the test variables for each test method.
|
Hinselmann |
Schiller |
Cytology |
Biopsy |
|||||
|
Test variables |
RUS / ROS |
RUS / ROS |
RUS / ROS |
RUS / ROS |
||||
|
1-Age |
0.69 |
0.38 |
0.62 |
0.19 |
0.79 |
0.68 |
0.92 |
0.21 |
|
2-Number of sexual partners |
0.69 |
1.0 |
0.65 |
0.08 |
0.8 |
0.16 |
0.69 |
0.02 |
|
3-First sexual intercourse |
0.8 |
0.1 |
0.79 |
0.03 |
0.78 |
0.28 |
0.84 |
0.04 |
|
4-Num of pregnancies |
0.73 |
0.7 |
0.6 |
0.93 |
0.82 |
0.26 |
0.54 |
0.52 |
|
5-Smokes |
0.9 |
0.18 |
0.5 |
0.06 |
0.84 |
0.4 |
0.94 |
0.17 |
|
6-Smokes (years) |
0.56 |
0.74 |
0.79 |
0.26 |
0.53 |
0.06 |
0.51 |
0.11 |
|
7-Smokes (packs/year) |
0.76 |
0.01 |
0.4 |
0.08 |
0.8 |
0.44 |
0.84 |
0.0 |
|
8-Hormonal Contraceptives |
0.87 |
0.94 |
0.46 |
0.05 |
0.85 |
0.42 |
0.96 |
0.0 |
|
9-Hormonal Contraceptives (years) |
0.76 |
0.18 |
0.97 |
0.64 |
0.88 |
0.0 |
0.87 |
0.56 |
|
10-IUD |
0.9 |
0.45 |
0.47 |
0.82 |
0.64 |
0.0 |
0.52 |
0.32 |
|
11-IUD (years) |
0.72 |
0.0 |
0.98 |
0.32 |
0.76 |
0.0 |
0.72 |
0.58 |
|
12-STDs |
0.36 |
0.01 |
0.16 |
0.17 |
0.28 |
0.42 |
0.12 |
0.4 |
|
13-STDs (number) |
0.03 |
0.32 |
0.22 |
0.32 |
0.21 |
0.12 |
0.18 |
0.34 |
|
14-STDs:condylomatosis |
0.66 |
0.29 |
0.46 |
0.21 |
0.21 |
0.14 |
0.26 |
0.24 |
|
15-STDs:cervical condylomatosis |
0.0 |
0.0 |
0.0 |
0.0 |
0.0 |
0.0 |
0.0 |
0.0 |
|
16-STDs:vaginal condylomatosis |
0.0 |
0.28 |
0.0 |
0.36 |
0.0 |
0.3 |
0.0 |
0.26 |
|
17-STDs:vulvo-perineal condylomatosis |
0.26 |
0.53 |
0.19 |
0.57 |
0.12 |
0.33 |
0.15 |
0.44 |
|
18-STDs:syphilis |
0.58 |
0.0 |
0.96 |
0.0 |
0.0 |
0.7 |
0.0 |
0.8 |
|
19-STDs:pelvic inflammatory disease |
0.56 |
0.0 |
0.0 |
0.0 |
0.0 |
0.0 |
0.0 |
0.02 |
|
20-STDs:genital herpes |
0.0 |
0.0 |
0.0 |
0.0 |
0.0 |
0.02 |
0.78 |
0.62 |
|
21-STDs:molluscum contagiosum |
0.0 |
0.0 |
0.0 |
0.0 |
0.0 |
0.0 |
0.0 |
0.0 |
|
22-STDs:AIDS |
0.0 |
0.0 |
0.0 |
0.0 |
0.0 |
0.0 |
0.0 |
0.0 |
|
23-STDs:HIV |
0.64 |
0.5 |
0.82 |
0.58 |
0.8 |
0.66 |
0.72 |
0.35 |
|
24-STDs:Hepatitis B |
0.0 |
0.03 |
0.0 |
0.04 |
0.0 |
0.0 |
0.0 |
0.08 |
|
25-STDs:HPV |
0.0 |
0.29 |
0.0 |
0.15 |
0.0 |
0.0 |
0.0 |
0.36 |
|
26-STDs: Number of diagnosis |
0.35 |
0.16 |
0.15 |
0.2 |
0.2 |
0.2 |
0.64 |
0.1 |
|
27-Dx:Cancer |
0.58 |
0.62 |
0.61 |
0.33 |
0.56 |
0.35 |
0.58 |
0.43 |
|
28-Dx:CIN |
0.0 |
0.08 |
0.0 |
0.26 |
0.0 |
0.21 |
0.56 |
0.3 |
|
29-Dx:HPV |
0.24 |
0.62 |
0.22 |
0.68 |
0.22 |
0.59 |
0.28 |
0.67 |
|
30-Dx |
0.46 |
0.1 |
0.1 |
0.0 |
0.12 |
0.2 |
0.88 |
0.44 |
Table 4. Experimental results for all test datasets.
|
Target Variable |
Balanced dataset by utilizing RUS method |
Balanced dataset by utilizing ROS method |
|||||
|
Hinselmann |
N |
P |
N |
P |
|||
|
True |
30 |
N |
5 |
5 |
N |
180 |
6 |
|
False |
638 |
P |
4 |
4 |
P |
0 |
197 |
|
Acc: 50.0% |
Acc: 98.43% |
||||||
|
Sen: 50.0% |
Sen: 100.0% |
||||||
|
Spe: 50.0% |
Spe: 96.77% |
||||||
|
Schiller |
N |
P |
N |
P |
|||
|
True |
63 |
N |
13 |
4 |
N |
165 |
5 |
|
False |
605 |
P |
7 |
14 |
P |
0 |
193 |
|
Acc: 71.05% |
Acc: 98.62% |
||||||
|
Sen: 66.67% |
Sen: 100.0% |
||||||
|
Spe: 76.47% |
Spe: 97.06% |
||||||
|
Cytology |
N |
P |
N |
P |
|||
|
True |
39 |
N |
4 |
1 |
N |
172 |
7 |
|
False |
629 |
P |
5 |
4 |
P |
0 |
199 |
|
Acc: 33.33% |
Acc: 98.15% |
||||||
|
Sen: 44.44% |
Sen: 100.0% |
||||||
|
Spe: 26.67% |
Spe: 96.09% |
||||||
|
Biopsy |
N |
P |
N |
P |
|||
|
True |
45 |
N |
7 |
6 |
N |
174 |
6 |
|
False |
623 |
P |
7 |
7 |
P |
0 |
194 |
|
Acc: 51.85% |
Acc: 98.40% |
||||||
|
Sen: 50.0% |
Sen: 100.0% |
||||||
|
Spe: 53.85% |
Spe: 96.67% |
||||||
|
N: Negative, P: Positive |
|||||||
According to results;
-
a) The RF classifier found that all of 197 data which are considered as positive are positive for ROS balanced Hinselmann dataset. Also, it found that 180 out of 186 considered as negative data are negative. Therefore, respectively 98.43% Acc, 100.0% Sen and 96.77% Spe measures are achieved on this dataset. On the other hand, this classifier found that 4 out of 8 which are considered as positive are positive for RUS balanced Hinselmann dataset. Also, it found that 5 out of 10 considered as negative data are negative. Therefore, respectively 50.0% Acc, 50.0% Sen and 50.0% Spe measures are achieved on this dataset. Thus, the ROS method is more successful than the RUS method for this dataset.
-
b) The RF classifier found that all of 193 data which are considered as positive are positive for ROS balanced Schiller dataset. Also, it found that 165 out of 170 considered as negative data are negative. Therefore, respectively 98.62% Acc, 100.0% Sen and 97.06% Spe measures are achieved on this dataset. On the other hand, this classifier found that 14 out of 21 which are considered as positive are positive for RUS balanced Schiller dataset. Also, it found that 13 out of 17 considered as negative data are negative. Therefore, respectively 71.05% Acc, 66.67% Sen and 76.47% Spe measures are achieved on this dataset. Hence, the ROS method is more successful than the RUS method for this dataset.
-
c) The RF classifier found that all of 199 data which are considered as positive are positive for ROS balanced Cytology dataset. Also, it found that 172 out of 179 considered as negative data are negative. Therefore,
respectively 98.15% Acc, 100.0% Sen and 96.09% Spe measures are achieved on this dataset. On the other hand, this classifier found that 4 out of 9 which are considered as positive are positive for RUS balanced Cytology dataset. Also, it found that 4 out of 5 considered as negative data are negative. Therefore, respectively 33.33% Acc, 44.44% Sen and 26.67% Spe measures are achieved on this dataset. Thus, the ROS method is more successful than the RUS method for this dataset.
-
d) The RF classifier found that all of 194 data which are considered as positive are positive for ROS balanced Biopsy dataset. Also, it found that 174 out of 180 considered as negative data are negative. Therefore, respectively 98.40% Acc, 100.0% Sen and 96.67% Spe measures are achieved on this dataset. On the other hand, this classifier found that 7 out of 14 which are considered as positive are positive for RUS balanced Biopsy dataset. Also, it found that 7 out of 13 considered as negative data are negative. Therefore, respectively 51.85% Acc, 50.0% Sen and 53.85% Spe measures are achieved on this dataset. Hence, the ROS method is more successful than the RUS method for this dataset.
In addition, the significance values of the test variables for each test method; Hinselmann, Schiller, Cytology, Biopsy, are shown in Table 2. For example, Number of sexual partners, Num of pregnancies, Smokes (years), Hormonal Contraceptives, STDs:vulvo-perineal condylomatosis, STDs:HIV, Dx:Cancer and Dx:HPV test variables are important for balanced Hinselmann dataset with ROS method. Although the significance of test variables which are obtained with RUS method are higher than ROS method, the performance of the classifier algorithm for the RUS-based datasets is lower because of the inadequacy data. That is, the performance of the classifier algorithm is higher for the ROS-based dataset.
-
V. Conclusion
Cancer is a disease that requires a long struggle in the material and spiritual direction besides the health problems brought with it. Cervical cancer which is seen in women younger than 50, is the genital system cancer. It originates in the cells lining the cervix, which is the lower part of the uterus and is sometimes called the uterine cervix. In this study, the significances of test variables for cervical cancer disease are investigated. In this context, the learning model is designed based on the combination of SS method and RF algorithm. The success of this model is tested on the RUS and ROS methods. The results show that ROS based SS method more successful than RUS based SS method on this dataset because of its high accuracy, approximately 98% achieved. This study also illustrates new aspects of the applicability of important attributes in knowledge discovery and data mining. The author aims to conduct an analysis of data which will be provided from the hospitals in the future.
Acknowledgments
The author thankful to Kelwin Fernandes, Jaime S. Cardoso and Jessica Fernandes for providing publically available Cervical cancer dataset.
References A study on test variable selection and balanced data for cervical cancer disease
- E.L. Dickson, R.I. Vogel, X. Luo, L.S. Downs, “Recent trends in typespecific HPV infection rates in the United States,” Epidemiol Infect, vol. 143, no. 5, pp. 1042-1047, 2015.
- O.W. Brawley and S.G. Cowal, “Civil society’s role in efforts to control women’s cancers,” Lancet, vol. 389, no. 10071, pp. 775-776, 2017.
- I.D. Duncan, “Cervical screening,” The Obstetrician & Gynaecologist, vol. 6, no. pp. 93–97, 2004.
- H. Demirhindi, E. Nazlıcan, M. Akbaba, “Cervical cancer screening in Turkey: A community-based experience after 60 years of Pap smear usage,” Asian Pac J Cancer P, vol. 13, no.12, pp. 6497-6500, 2012.
- “Turkish Cervical Cancer and Cervical Cytology Research Group. Prevalence of cervical cytological abnormalities in Turkey,” Int J Gynaecol Obstet, vol. 106, no.3, pp. 206-209, 2009.
- N. Gökgöz and D. Aktaş, “Determination of women awareness level of cervical cancer & conducting Pap-Smear Test,” Yildirim Beyazit Universitesi Hemşirelik E-Dergisi, vol. 3, pp.11-23, 2015.
- G. Ruzigana, L. Bazzet-Matabele, S. Rulisa, A.N. Martin, R.G. Ghebre, “Cervical cancer screening at a tertiary care center in Rwanda,” Gynecol Oncol Rep, vol. 21, pp.13-16, 2017.
- M. Başaran, A. Başaran and Z. Küçükaydın, “Restaging in cervical cancer,” Turkiye Klinikleri J Gynecol Obst-Special Topics, vol. 8, no.1, pp. 117-127, 2015.
- C. Eroglu, R. Keşli, M.A. Eryılmaz, Y. Ünlü, O. Gönenç, Ç. Çelik, “Serviks kanseri için riskli olan kadınlarda HPV tiplendirmesi ve HPV sıklığının risk faktörleri ve servikal smearle ilişkisi,” Nobel Medicus, vol. 7, no.3, pp.72-77, 2011.
- L.H. Aktun, Y. Aykanat, F. Gökdağlı-Sağır, “Are cervicovaginal smear tests reliable during pregnancy?” Medeniyet Medical Journal, vol. 32, no.2, pp. 111-114, 2017.
- L. Denny, S. de Sanjose, M. Mutebi, B.O. Anderson, Kim J, Jeronimo J, Herrero R, Yeates K, O. Ginsburg, R. Sankaranarayanan, “Interventions to close the divide for women with breast and cervical cancer between low-income and middle-income countries and high-income countries,” Lancet, vol. 389, no. 10071, pp.861-870, 2017.
- B.F. Lees, B.K. Erickson, W.K. Huh, “Cervical cancer screening: evidence behind the guidelines,” Am J Obstet Gynecol, vol. 214, no.4, pp. 438-443, 2016.
- E. Nazlıcan, M. Akbaba, H. Koyuncu, N. Savaş, B. Karaca, “Cervical cancer screening between 35-40 aged women at Kisecik region of Hatay provinence,” TAF Preventive Medicine Bulletin, vol.9, no.5, pp. 471-474, 2010.
- E. Fusco, F. Padula, E. Mancini, A. Cavalieri, G. Grubisic, “History of colposcopy: a brief biography of Hinselmann,” Journal of Prenatal Medicine, vol. 2, no.2, pp. 19-23, 2008.
- A. Singer, J.M. Monaghan, S.C. Quek, “Lower genital tract precancer colposcopy, pathology and treatment,” 2nd ed. Wiley: Blackwell Science, 2008.
- J.S. Bentz, “Liquid-based cytology for cervical cancer screening,” Expert Rev Mol Diagn, vol. 5, no.6, pp. 857-871, 2005.
- S.B. Kaveri, S. Khandelwal, “Role of Pap smear N cervical biopsy in unhealthy cervix,” Journal of Scientific and Innovative Research, vol.4, no.1, pp.4-9, 2015.
- D.J. Dittman, T.M. Khoshgoftaar, R. Wald, A. Napolitano, “Comparison of data sampling approaches for imbalanced bioinformatics data,” Proceedings of the Twenty-Seventh International Florida Artificial Intelligence Research Society Conference, May 21-23, Florida, 2014.
- A.O. Durahim, “Comparison of sampling techniques for imbalanced learning,” Yönetim Bilişim Sistemleri Dergisi, vol. 1, no. 3, pp. 181-191, 2016.
- U. R. Salunkhe, S. N. Mali, "A Hybrid Approach for Class Imbalance Problem in Customer Churn Prediction: A Novel Extension to Under-sampling", International Journal of Intelligent Systems and Applications (IJISA), Vol.10, No.5, pp.71-81, 2018. DOI: 10.5815/ijisa.2018.05.08
- T. Sumadhi, M. Hemalatha, “An Enhanced Approach for Solving Class Imbalance Problem in Automatic Image Annotation,” International Journal of Image, Graphics and Signal Processing (IJIGSP), vol.5, no.2, pp.9-16, 2013.DOI: 10.5815/ijigsp.2013.02.02
- H. Kaur, Er. P. Verma, “E-Mail Spam Detection Using Refined MLP with Feature Selection,” International Journal of Modern Education and Computer Science (IJMECS), vol.9, no.9, pp. 42-52, 2017. DOI: 10.5815/ijmecs.2017.09.05
- S. Goswami, S. Chakraborty, H. N. Saha, "An Univariate Feature Elimination Strategy for Clustering Based on Metafeatures", International Journal of Intelligent Systems and Applications (IJISA), vol.9, no.10, pp.20-30, 2017. DOI: 10.5815/ijisa.2017.10.03
- F. Mordelet, J. Horton, A.J. Hartemink, B.E. Engelhardt and R. Gordân, “Stability selection for regression-based models of transcription factor–DNA binding specificity,” Bioinformatics, vol. 29, no.13, pp. i117–i125, 2013.
- M. Kumar, A.J. Singh, "Evaluation of Data Mining Techniques for Predicting Student’s Performance", International Journal of Modern Education and Computer Science (IJMECS), Vol.9, No.8, pp.25-31, 2017.DOI: 10.5815/ijmecs.2017.08.04
- L. Breiman, “Random forests,” Mach Learn, vol. 45, pp. 5-32, 2001.
- O. Akar and O. Gungor, “Classification of multispectral images using random forest algorithm,” Journal of Geodesy and Geoinformation, vol. 1, pp. 139-146, 2012.
- S.A. Shaikh, Measures derived from a 2x2 table for an accuracy of a diagnostic test. J Biom Biostat, vol. 2, no. 128, pp. 1-4, 2011.
