Abnormal geophysical events in the northern hemisphere in 2010 and 2011

Author: Kashkin Valentine B., Rubleva Tatyana V., Odintsov Roman V.
Journal: Журнал Сибирского федерального университета. Серия: Техника и технологии @technologies-sfu
Article in issue: 8 т.11, 2018.
Free access
Based on ATOVS satellite data, temperature-pressure vertical profiles at different levels have been constructed for the epicenter of the Japan earthquake that occurred on March 11, 2011 for the “undisturbed” and seismically disturbed atmosphere (December 2010 - January-April 2011). In the undisturbed atmosphere over the focal zone, the coefficient of correlation between the time series of the temperature at levels of 200 gPa and 450 gPa was positive, reaching 0.4-0.6; in the disturbed atmosphere, there were intensive internal gravity waves, and the correlation coefficient was negative, reaching -0.86. The large wave in the atmosphere observed over the focal zone before the earthquake could have triggered it. A rare event occurred almost simultaneously with the earthquake: an ozone anomaly similar to the Antarctic ozone hole was formed in the Northern Hemisphere between March 5 and April 4, 2011. That event was preceded by a dramatic temperature drop in the lower stratosphere. In 2010, Europe experienced an unprecedented hot summer, and the winter of 2010-2011 was exceptionally cold. Those events could have a common cause. That could be an oil spill in the Gulf of Mexico in spring-summer of 2010, which changed the direction of the Gulf Stream, leading to changes in atmospheric circulation and generation of intensive atmospheric waves.
Seismic activity, earthquake, trigger effect, the ozone hole in the arctic, disaster in the gulf of mexic
Short address: https://sciup.org/146279565
IDR: 146279565 | UDC: 551.507, | DOI: 10.17516/1999-494X-0120
Аномальные геофизические события 2010 и 2011 годов в северном полушарии
По спутниковым данным ATOVS построены и проанализированы вертикальные профили температуры-давления на различных изобарических уровнях в эпицентре землетрясения 11 марта 2011 г. в Японии для «спокойной» и сейсмически возмущенной атмосферы (декабрь 2010 г. - январь-апрель 2011 г.). В спокойной атмосфере над очаговой областью коэффициент корреляции между временными рядами температуры на уровне 200 и 450 гПа был положительным и составил 0,4-0,6; в возмущенной атмосфере наблюдались интенсивные внутренние гравитационные волны, коэффициент корреляции стал отрицательным и равнялся 0,86. Отмечена крупная волна в атмосфере над очаговой областью перед землетрясением, которая могла стать его триггером. Практически одновременно с землетрясением наблюдалось редкое событие - в северном полушарии между 5 марта и 4 апреля 2011 г. появилась озоновая аномалия, похожая на антарктическую «озоновую дыру». Этому событию предшествовало резкое падение температуры в нижней стратосфере. В 2010 г. в Европе наблюдалось необычно жаркое лето, зима 2010-2011 гг. была необычно холодной. Рассмотренные явления могут иметь общую причину. Ею мог быть разлив нефти в Мексиканском заливе весной-летом 2010 г., изменивший направление Гольфстрима, что привело к изменению циркуляции атмосферы и возбуждению интенсивных волн в атмосфере.
Text of the scientific article Abnormal geophysical events in the northern hemisphere in 2010 and 2011
Curves of changes in T 450 and T 200 atmospheric temperatures at isobaric levels of 450 and 200 gPa, respectively, between February 1 and April 14, 2011, are shown in Fig. 1. In the “undisturbed” atmosphere, the level of 450 gPa is usually located below the tropopause, and the 200 gPa level is in the tropopause. The coefficient of correlation between the time series of the T 450 and T 200 temperatures over the period is R = -0.76. During the seismic events, temperature rises at the 200 gPa level and drops at the 450 gPa isobaric level. Interestingly, the amplitude of temperature variations at each level is rather large, reaching or exceeding 20 °C. The curves in Fig. 1 can be interpreted as changes of pressure at different temperature levels. The temperature decrease in the graph characterizes the prevailing increase in the pressure, and the temperature rise indicates the pressure decrease.
Temperature changes at isobaric levels of 200 gPa, 300 gPa, and 450 gPa (July 2011) at the epicenter of the earthquake are shown in Fig. 2. By that time, the seismic activity in the region had subsided. The curves in Fig. 2 are significantly different from the curves in Fig. 1, for the seismically disturbed troposphere. Analysis of results shows that the time series of the temperatures in Fig. 2 are similar to each other and may characterize meteorological processes in the atmosphere. The paired correlation coefficients for the time series at levels of 200 gPa, 300 gPa, and 450 gPa lie within a range of R =0.26-0.75.
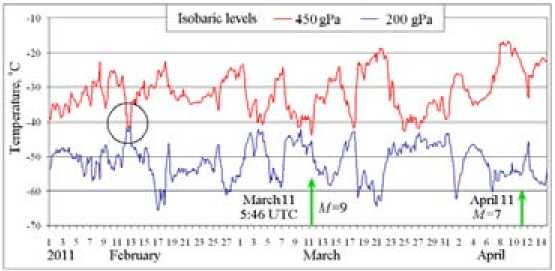
Fig. 1. Changes in T 450 and T 200 temperatures at levels of 450 gPa and 200 gPa; arrows indicate time points of the earthquake on March 11 ( M = 9.0-9.1) and aftershock on April 11 ( M =7.0)
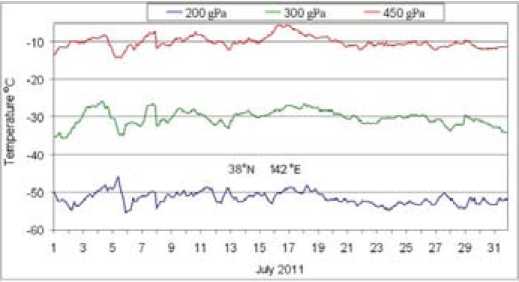
Fig. 2. Temperature changes at isobaric levels of 200, 300, and 450 gPa at the epicenter of the earthquake in
Ju y 0
It is interesting to observe how correlation coefficient R changes between the time series of T 450 and T 200 over a long time period. Results of calculations of R for the period between August 2010 and August 2011 are given in Fig. 3. Before September 9, 2010 and after June 30, 2011, the correlation coefficient is positive, which is characteristic of quiet seismic conditions. In December 2010 and between January and April 2011, intensive internal gravity waves are generated [4]. Correlation coefficient R is negative. The lowest value, R = -0.86, is observed in March 2011, at the time of the severe earthquake.
Ozone layer variations were studied using satellite data from the OMI spectrometer (Aura, U.S.). The OMI spectrometer measures backscattered solar UV radiation in two spectral channels: UV-1 (264-311 nm) and UV-2 (307-383 nm). The measurement error is 2–4%. Daily ozone data are available at the NASA site [5] on a 1°×1° grid. A three-dimensional image of the ozone layer over the focal zone of the Japan earthquake based on the satellite data for March 9, 2011 is shown in Fig. 4. Ozone data on March, 11 are not available. Intensive atmospheric waves passing over the focal zone can be seen quite clearly. Here, ozone is used as a tracer. Between March 7 and 11, total ozone (TO) over the focal zone had increased from 344 to 412 Dobson units (DU). 1 DU = 10-3 cm.
Only once in the period of 37 years of satellite ozone measurements, between March 5 and April 4, 2011, an atmospheric formation similar to the ozone hole of the Southern Hemisphere was observed in the Arctic (Fig. 5). Figure 5 shows the ring of the polar vortex about 8000 km in diameter, with
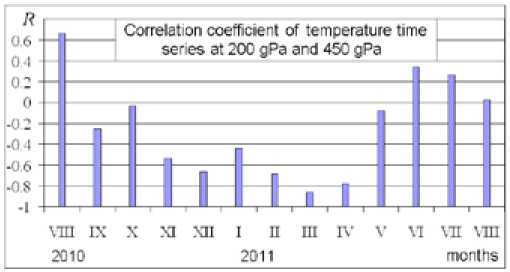
Fig. 3. Coefficient of correlation of the time series of T 450 and T 200 at the isobaric levels of 200 and 450 gPa
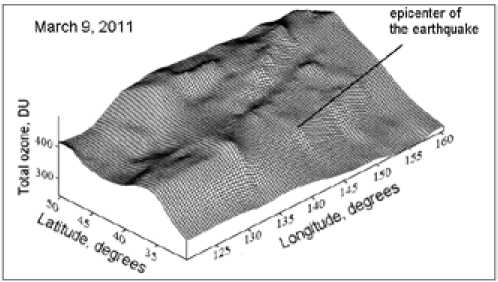
Fig. 4. Ozone layer over the focal zone of the Japan earthquake on March 9, 2011
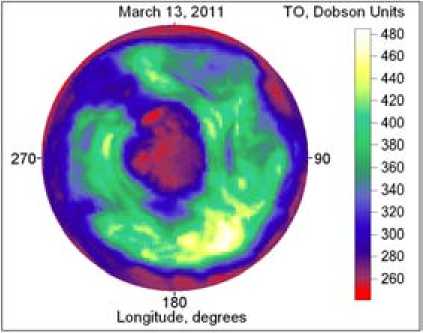
Fig. 5. The ozone anomaly in the Northern Hemisphere on March 13, 2011
TO reaching 500 DU, and its core with the decreased TO, stretching between Canada and the Taimyr Peninsula. The outer boundaries of the Polar vortex (PV) are determined by the jet flows, which prevent warm and ozone-rich air from penetrating into the PV core [5]. In this polar region, at this time, TO usually reaches 450-500 DU. However, this anomaly was not a classical ozone hole, as March TO was higher than 220 DU.
In polar latitudes, ozone is mainly concentrated at the isobaric level of 50 gPa. Analysis of the temperature conditions at this level based on the data found at the NOAA site [3] showed that in the lower stratosphere close to the North Pole, between January 18 and March 19, 2011, the temperature reached its minimum for the Northern Hemisphere: it did not rise higher than 195 K (-78 °C), sometimes dropping to -85 °C. There is no evidence suggesting a similar temperature drop there at any other time; the lowest temperatures in the North are usually observed over the continents rather than over the Pole. Even lower temperatures are characteristic of the stratosphere close to the South Pole. For instance, in September, October, and November (i.e., in spring) 2014, the temperature there dropped to -90 °C. The temperature drop to -78 °C and below in the stratosphere of the Southern Hemisphere is accompanied by the formation of the ozone hole. A similar event occurred in the Northern Hemisphere in March 2011.
Although a considerable amount of literature has been published on the abnormal behavior of the ozone layer in the Northern Hemisphere in spring 2011, no definitive reasons for it have been found yet [6]. Manney et al. [6] relate the spring ozone anomaly of 2011 only to chemical losses of ozone in the stratosphere. Their calculations based on chemical transport models showed that rapid chemical destruction of ozone, which started as early as January, was facilitated by the low temperature in the stratosphere.
Hurwitz et al. [7] discuss the assumption that abnormal behavior of the ozone layer in March 2011 could be associated with certain dynamic events. They found, however, that La Niña, the quasibiennial oscillation, and global warming could not explain the ozone anomaly of 2011 in the Northern Hemisphere. Moreover, 2011 was one of the years of solar minima.
The Japan earthquake and the ozone anomaly were not the only unusual geophysical events in the Northern Hemisphere in 2010-2011. July 2010 will be remembered for the abnormal climate changes that had not occurred for the entire period of instrumental observations [8]. One of the weather records – 986 – of 2010 was the uncommonly hot summer on the Russian Plain. The cyclones coming from the north Atlantic and the Arctic Ocean failed to reach European Russia and dropped all their moisture on the limited area between Western Europe and the Middle East and even on Pakistan, causing devastating floods.
By contrast, the summer of 2011 in Siberia was unusually cold. Having bypassed Siberia, abnormally hot weather, together with forest fires, came to Yakutia, Magadan, and Chukotka. In Western Europe, the summer of 2010 was followed by an uncommonly cold and snowy winter. In December 2010, England experienced the severest frosts of the last 100 years, which led to transport collapse. In Germany, abnormally low temperatures, reaching – 20 °C at night, persisted over November and December, and the thickness of the stable snow cover reached 10 cm. By contrast, Canada saw unusual warming at the beginning of 2011 [10]. Finally, the temperature at the North Pole dropped dramatically. These abrupt temperature changes cannot be explained by natural climate variations.
The abnormal natural events of 2010-2011 might have been triggered by oil spill following the explosion and sinking of the British Petroleum “Deepwater Horizon” oil spill in April 2010, with the total discharge of more than 5 million tons of oil over 86 days. The oil spread over the surface of the Gulf of Mexico and the Atlantic Ocean, covering the area of at least 1 million square kilometers. That disaster resulted in the lower rate of water evaporation and affected the air and seawater warming patterns [11].
The oil covered no more than 10% of the Atlantic Ocean surface area, but the energy imbalance triggered by the Gulf of Mexico oil spill was sufficiently strong to cause a large-scale climate anomaly. Long-term heating of air masses over the large surface contaminated area, together with the atmospheric water deficit, could excite Rossby waves over Eastern Europe, causing abnormally high summer temperatures [11].
The Gulf of Mexico and the Gulf Stream are sources of the great amount of water and heat for the atmosphere of the Northern Hemisphere. The first European scientist to voice concern was G. Zangari of the National Institute of Nuclear Physics, Italy. In summer 2010, he warned that the destruction of the most important part of the Gulf Stream could trigger a chain reaction of unpredictable critical events and instabilities, which could lead to serious consequences for the dynamics of global temperature regulation by the Gulf Stream [12].
The Gulf Stream separated into smaller streams and changed its direction 250 km away from the coastline of North Carolina; in the north, its temperature dropped by 10 °C. The abnormal temperatures in the eastern part of the North Atlantic upset the usual atmospheric circulation. This seems to be the reason for the weather anomalies of 2010-2011.
The formation of the ozone anomaly in the Arctic is also a component of this process, which was caused by the dramatic temperature drop in the Arctic stratosphere and the change in the usual pattern of the atmospheric wave circulation in the Northern Hemisphere.
As for Japan earthquake, the conditions were ripe for a disaster by March 11 and one single push was all that was needed. The intense wave processes in the atmosphere could be the trigger.
References Abnormal geophysical events in the northern hemisphere in 2010 and 2011
- Перевалова Н.П., Воейков С.В., Ясюкевич Ю.В., Ишин A.Б., Воейкова Е.С., Саньков В.А. Исследование ионосферных возмущений, вызванных землетрясением в Японии 11 марта 2011 г., по данным сети GEONET. Современные проблемы дистанционного зондирования Земли из космоса, 2012, 9 (3), 172-180.
- Кашкин В.Б., Рублева Т.В., Хлебопрос Р.Г. Стратосферный озон: вид с космической орбиты. Красноярск, СФУ, 2015. 184 с.
- -Access mode: http://www.arl.noaa.gov/ready/cmet.html
- -Access mode: http://www.vets.ucar.edu/vg/PV/index.shtml
- -Access mode: fttp://toms.gsfc.nasa.gov/
- Manney G.L., Santee M.L., Rex M. et al. Unprecedented Arctic ozone loss in 2011, Nature, 2011, 478, 469-475 DOI: 10.1038/nature10556
- Hurwitz M.M., Newman P.A., Garfinkel C.I. The Arctic vortex in March 2011: a dynamical perspective, Atmos. Chem. Phys, 2011, 11 (23), 11447-11453.
- Мерзликин В.Г. Оценка влияния нефтяных загрязнений на водно-тепловой режим атлантического течения Гольфстрим. Вестник Московского государственного технического университета им. Н.Э. Баумана. Естественные науки, 2011, 1, 106-123.
- Астафьева Н.М. Возможные причины горячего российского лета 2010. Современные проблемы дистанционного зондирования Земли из космоса, 2011, 8 (3), 223-232.
- Глобальные метеорологические катаклизмы. Экономика сельского хозяйства в России, 2011, 2, 74-76
- Красс М.С., Мерзликин В.Г., Сидоров О.В. Моделирование техногенных причин короткопериодных аномалий климата. Вестник Томского государственного университета, 2011, 349, 200-203
- Zangari G. Risk of Global Climate Change by BP Oil Spill. National Laboratories (LNF) -Italy National Institute of Nuclear Physics (INFN), 2010. Access: http://www.associazionegeofisica. it/oilspill.pdf/
