Abnormal phenomena in the tropical part of the world ocean according to MODIS-Aqua satellite data

Author: Vysotskaya G.S., Pisman T.I., Botvich I.Yu., Shevyrnogov A.P.
Journal: Журнал Сибирского федерального университета. Серия: Техника и технологии @technologies-sfu
Section: Исследования. Проектирование. Опыт эксплуатации
Article in issue: 3 т.17, 2024.
Free access
The work analyzes monthly data from the MODIS-Aqua satellite scanner on the temperature of the surface layer of water with a resolution of 4320×2160 (9 km at the equator) for 2002-2021, obtained from the Ocean Color Data website (https://oceandata.sci.gsfc.nasa.gov/MODIS-Aqua/Mapped/ Monthly/9km/). It was shown that the degree of influence of changes in ocean surface temperature on the atmosphere depends not only on the absolute values of temperature changes, but also on the surface area on which these changes occur. It was revealed that starting from the end of 2009 - beginning of 2010, the climate system of the tropical zone was destabilized, and reliably positive temperature trends began to prevail over most of the ocean surface in the tropics. At the same time, in the circulation belts of temperate latitudes, processes occur that are not synchronous either with the processes in the tropics or with each other. It was noted that zones with predominant warming or cooling are sometimes located nearby on the scale of the World Ocean, practically not separated by buffer zones. This could destabilize the ocean-atmosphere system. It was revealed that the predominance of warming processes in the Gulf Stream does not lead to a corresponding predominance of warming processes in the North Atlantic Current. The opposite is observed.
World ocean, satellite data, modis-aqua, tropics, ocean surface temperature, ost trends
Short address: https://sciup.org/146282854
IDR: 146282854 | UDC: 528.88
Аномальные явления в тропической части мирового океана по данным спутника MODIS-Aqua
В работе анализируются ежемесячные данные спутникового сканера MODIS-Aqua о температуре поверхностного слоя воды с разрешением 4320×2160 (9 км по экватору) за 2002-2021 годы, полученные с сайта Ocean Color Data (https: //oceandata.sci.gsfc.nasa.gov/MODIS-Aqua/ Mapped/Monthly/9km/). Показано, что степень влияния изменения температуры поверхности океана на атмосферу зависит не только от абсолютных величин изменений температуры, но и от площади поверхности, на которой происходят эти изменения. Выявлено, что с конца 2009 - начала 2010 г. климатическая система тропической зоны дестабилизировалась, и над большей частью поверхности океана в тропиках стали преобладать достоверно положительные тренды температуры. В то же время в циркуляционных поясах умеренных широт происходят процессы, не синхронные ни с процессами в тропиках, ни друг с другом. Было отмечено, что зоны с преимущественным потеплением или похолоданием иногда располагаются рядом в масштабах Мирового океана и практически не разделены буферными зонами. Это может дестабилизировать систему океан-атмосфера. Выявлено, что преобладание процессов потепления в Гольфстриме не приводит к соответствующему преобладанию процессов потепления в Северо-Атлантическом течении. Наблюдается обратное.
Text of the scientific article Abnormal phenomena in the tropical part of the world ocean according to MODIS-Aqua satellite data
Abstract. The work analyzes monthly data from the MODIS-Aqua satellite scanner on the temperature of the surface layer of water with a resolution of 4320×2160 (9 km at the equator) for 2002–2021, obtained from the Ocean Color Data website Monthly/9km/). It was shown that the degree of influence of changes in ocean surface temperature on the atmosphere depends not only on the absolute values of temperature changes, but also on the surface area on which these changes occur. It was revealed that starting from the end of 2009 – beginning of 2010, the climate system of the tropical zone was destabilized, and reliably positive temperature trends began to prevail over most of the ocean surface in the tropics. At the same time, in the circulation belts of temperate latitudes, processes occur that are not synchronous either with the processes in the tropics or with each other. It was noted that zones with predominant warming or cooling are sometimes located nearby on the scale of the World Ocean, practically not separated by buffer zones. This could destabilize the ocean-atmosphere system. It was revealed that the predominance of warming processes in the Gulf Stream does not lead to a corresponding predominance of warming processes in the North Atlantic Current. The opposite is observed.
Цитирование: Высоцкая Г. С. Аномальные явления в тропической части Мирового океана по данным спутника MODIS‑ Aqua / Г. С. Высоцкая, Т. И. Письман, И. Ю. Ботвич, А. П. Шевырногов // Журн. Сиб. федер. ун‑та. Техника и технологии, 2024, 17(3). С. 326–332. EDN: ORCZBQ
[1]. It is associated with the strongest interannual variations in global surface temperature. The risk of anomalies in temperature, hydrological, and circulation regimes in the atmosphere not only in tropical latitudes depends on ENSO [1].
Less known is a similar phenomenon that is periodically observed in the tropical zone of the Atlantic Ocean [4, 5]. The analog of ENSO in the tropical latitudes of the Atlantic Ocean is the equatorial Atlantic mode (EAM), which manifests itself in OST variations in the eastern part of the equatorial Atlantic. Moreover, the contrasts between the eastern and western regions in the equatorial Atlantic are smaller than in the Pacific Ocean, and the characteristic time scales of 2–4 years are also shorter than for ENSO. The difference in the characteristics of EAM and ENSO is significantly associated with the smaller extent of the Atlantic Basin at equatorial latitudes [6].
A lot of studies have been devoted to climate processes in tropical latitudes that influence the global climate. Of particular importance are studies of the role of various factors in the dynamics of OST in tropical oceans and the relationships between them [1].
The purpose of this study is to assess trends in OST changes in the tropical part of the World Ocean using MODIS-Aqua satellite data for 2002–2021.
Data and methods
The work analyzes monthly data from the MODIS-Aqua satellite scanner on the temperature of the ocean surface layer with a resolution of 4320×2160 (9 km at the equator) for 2002–2021, obtained from the Ocean Color Data website [7].
The surface of the tropics from 30°N to 30°S makes up half of the Earth's surface, and most of the tropical zone is made up of oceans. In the tropical part of the oceans, such powerful currents as the Gulf Stream and Kuroshio originate, carrying heat from the tropics to the middle latitudes. The Gulf Stream plays a key role in the transfer of mass and heat from low latitudes to the north and has a significant impact on the climatic conditions of the Atlantic‑European and Arctic regions [8].
For the tropical part of the ocean from 30°N to 30°S, deviations of water surface temperature from monthly averages for 2002–2021 were calculated for each pixel. Weighted average temperature deviations were then calculated for each month for the tropical zone, taking into account changes in pixel area depending on latitude (Fig. 1).
Results and discussion
As can be seen from the graph presented in Fig. 1, temperature variations are within 1 °C. However, the extent to which changes in ocean surface temperature influence the atmosphere depends not only on the absolute values of temperature changes, but also on the surface area over which these changes occur. Moreover, after 2012, there was a stable increase in the average deviations of ocean surface temperatures from monthly averages in the tropics compared to the previous period. The variability of the indicator also increased. In this regard, it is interesting to study the stability of processes occurring in different areas of the ocean.
For this purpose, an interval of 5 years (60 months), starting from July 2002, was chosen. OST trends were calculated for each pixel. Seasonal dynamics was subtracted from the time series. Further, similar trends were calculated for a period of the same length with a shift of 1 month up to the period – 328 –
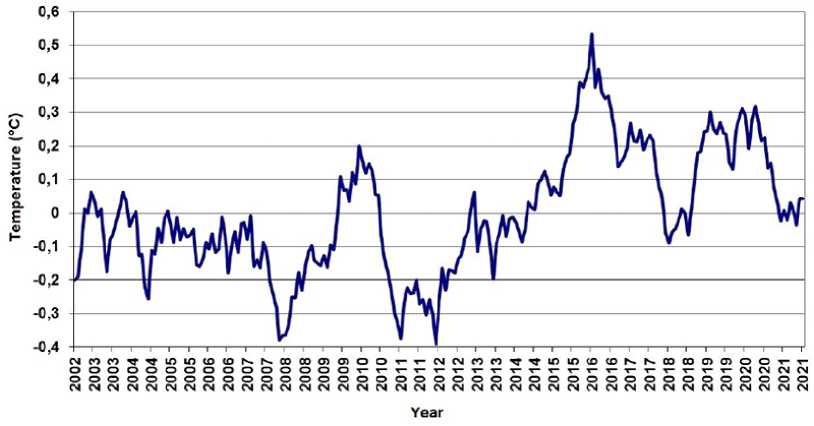
Fig. 1. Dynamics of average values of OST deviations from monthly averages from 30°N to 30°S from August 2016 to July 2021. When calculating each trend, the statistical significance of the positive or negative dynamics of the OST trend was assessed.
Next, for each pixel, the number of reliably positive and reliably negative OST trends and the difference between these numbers were calculated (Fig. 2). During the study period, a clear differentiation could be seen. It was most pronounced in the part of the Atlantic Ocean located between the equator and 30°S, where warming processes prevailed.
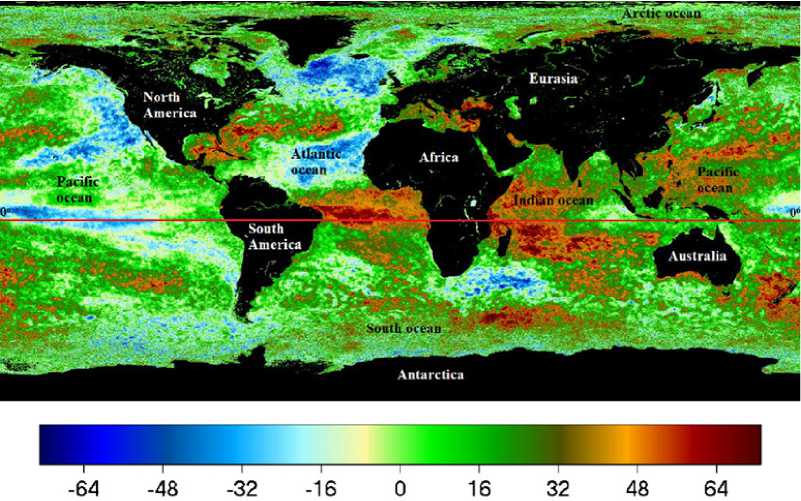
Fig. 2. Spatial distribution of differences between the number of positive and negative OST trends
As can be seen from Fig. 2, in the tropical zone there was a predominance of warming processes in the space from the Atlantic Ocean, in tropical Africa, in the Indian Ocean, and in the western Pacific Ocean. At the same time, in the eastern part of the Pacific Ocean, including in the El Niño and La Niña zones, a predominance of cooling periods was observed.
Next, for each period, taking into account the dependence of the pixel area on latitude, the areas occupied by pixels with each type of trend were calculated.
Fig. 3 shows that starting from the end of 2009 – beginning of 2010, the climate system of the tropical zone was destabilized, and reliably positive temperature trends began to prevail over most of the ocean surface in the tropics. The process was the most pronounced in the period from 2011 to 2016. It must be noted that the warming process is not limited to the El Niño zone. Similar warming processes are also observed in the Atlantic and Indian Oceans, as well as in the northern part of the Pacific Ocean. Unlike the usual El Niño, apart from the Pacific Ocean, the process occurred simultaneously in both the Atlantic and Indian Oceans.
Further, starting from mid‑2013, areas where the temperature did not change significantly in terms of statistics began to predominate, and, starting from the beginning of 2014, in the tropical part of the ocean, areas, where temperature decrease processes occur, began to exceed in the area the areas with positive trends (Fig. 3).
In the circulation belts of temperate latitudes, processes occur that are not synchronous either with the processes in the tropics (Fig. 4) or with each other. In the northern hemisphere, the OST dynamics is weakly related to the tropical one, and in the dynamics of the ocean surface temperature of the southern temperate latitudes (30°S – 60°S) a response is observed with a time lag of about a year.
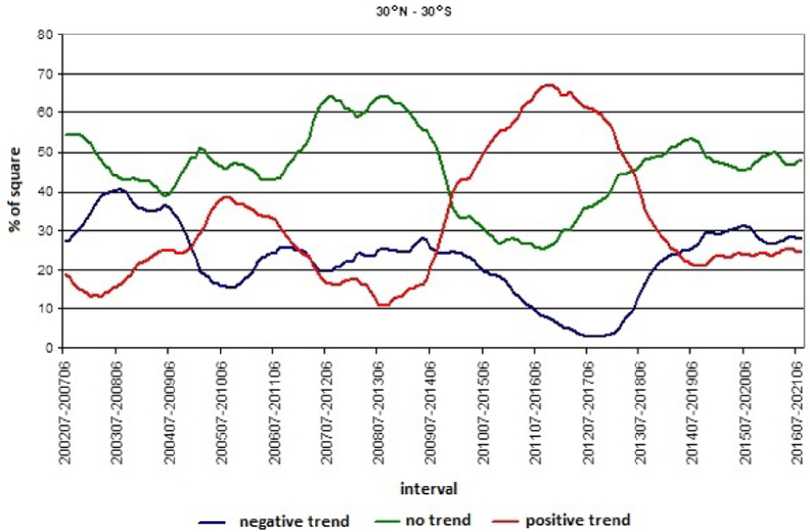
Fig. 3. Temporal dynamics of the shares of areas with different directions of OST trends within the total ocean surface area in the tropical zone positive trends
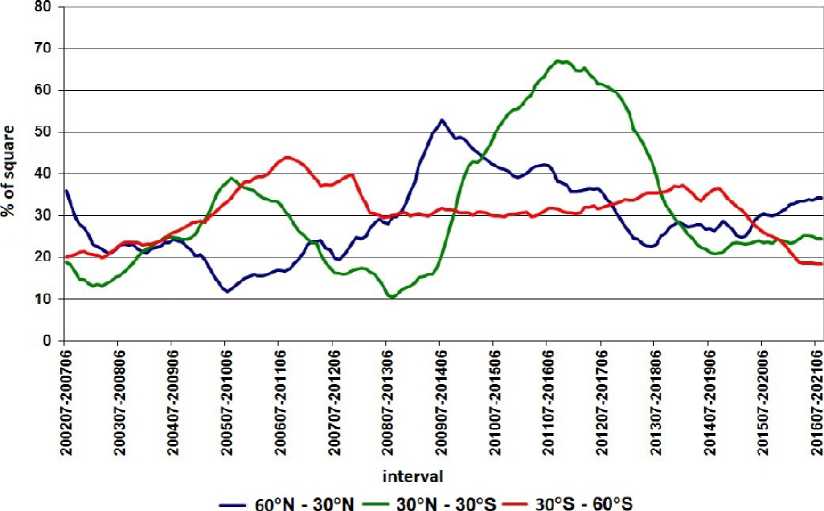
Fig. 4. Temporal dynamics of the shares of areas with positive OST trends within the total ocean surface area in different circulation belts
Thus, when considering the area data, it is clearly seen that there is a pronounced spatial heterogeneity in OST trends (Figs. 3 and 4). This circumstance is important for the study of climate regulation mechanisms, since, as can be seen from Fig. 1, the process of OST changes is not linear. Linking the processes of warming and cooling to specific centers of atmospheric action and other meteorological and hydrological objects can help in identifying the direct-feedback mechanisms of the climate system.
Conclusion
The ocean occupies most of the Earth's surface, and the heat capacity of ocean water is much greater than that of air. Besides, the depth of the mixed layer can reach hundreds of meters. Therefore, studying the dynamics of ocean OST appears to be extremely important for climate research.
Based on the results obtained, the following conclusions were drawn.
-
– With the stabilization of the increase in average OST, there is no clear picture of the warming or cooling of the World Ocean.
-
– Zones with predominant warming or cooling are sometimes located nearby on the scale of the World Ocean, practically not separated by buffer zones, which cannot but destabilize the ocean‑ atmosphere system.
-
– The predominance of warming processes in the Gulf Stream does not lead to a corresponding predominance of warming processes in the North Atlantic Current. The opposite is observed.
-
– During the study period, the main driver of warming was the tropical part of the Atlantic Ocean and the western part of the tropical Indian Ocean.
References Abnormal phenomena in the tropical part of the world ocean according to MODIS-Aqua satellite data
- Mokhov I. I., Smirnov D. A. Estimates of the mutual influence of variations in surface temperature of the Pacific, Atlantic, and Indian Oceans in tropical latitudes using long-term data series. Izvestija RAN. Fizika atmosfery i okeana, 2017, 53(6), 699-709 (in Rus.)]. 10.7868/S 0003351517060046. DOI: 10.7868/S0003351517060046 EDN: ZVGFKR
- Chang P., Fang Y., Saravanan R., Ji L., Seidel H. The cause of the fragile relationship between the Pacific El Nino and the Atlantic Nino, Nature, 2006, 443, 324-328.
- Deser C., Capotondi A., Saravanan R., Phillips A. S. Tropical Pacific and Atlantic climate variability in CCSM3, J. Climate, 2006, 19, 2451-2481.
- Crespo L. R., Prigent A., Keenlyside N., et al. Weakening of the Atlantic Niño variability under global warming, Nature Climate Change, 2022, 12, 822-827. EDN: YXMDIK
- Ruiz-Barradas A., Carton J. A., Nigam S. Role of the atmosphere in climate variability of the tropical Atlantic, J. Climate, 2003, 16, 2052-2065.
- Zebiak S. E. Air-sea interaction in the equatorial Atlantic region, J. Climate, 1993, 6, 1567-1586.
- https://oceandata.sci.gsfc.nasa.gov/MODIS-Aqua/Mapped/Monthly/9km.
- Seager R., Battisti D. S., Yin J., et al. Is the Gulf Stream responsible for Europe's mild winters? Quarterly Journal of the Royal Meteorological Society, 2002, 128(586), 2563-2586.
