About the role of input-output balance in government regulation of the economy

Author: Lukin Evgenii Vladimirovich
Journal: Economic and Social Changes: Facts, Trends, Forecast @volnc-esc-en
Section: Socio-economic development strategy
Article in issue: 3 (51) т.10, 2017.
Free access
March 30, 2017, a notable event took place in Russia: the Federal State Statistics Service (Rosstat) published the basic input-output balance (IOB) for the national economy for 2011 and the tables that show the resources and utilization of products for 2012-2014. Economists have been waiting for this event for more than 20 years. The latest IOB was made in 1995. The present paper summarizes theoretical foundations of input-output balance and basic methodological approaches to its construction. It is shown that input-output balance is the basis for government regulation of the economy in industrialized countries. The paper evaluates the situation with the availability of necessary statistical information to build the “input - output” tables for the Russian economy. The author highlights possible areas, in which input-output balance can be used in government regulation of the economy. It is proved that input-output balance contains all the main macroeconomic indicators of the country (region) in its sectoral and national economic context...
Input-output balance, government regulation of the economy, analysis, modeling, forecasting
Short address: https://sciup.org/147223951
IDR: 147223951 | UDC: 338.45(470.12) | DOI: 10.15838/esc.2017.3.51.2
Text of the scientific article About the role of input-output balance in government regulation of the economy
One of the fundamental problems of the Russian economy is found in its weak and ineffective system for managing socioeconomic processes, which results in a low level of socio-economic development and in Russia’s lagging behind foreign countries in terms of competitiveness, innovative activity and people’s well-being.
Modern economy is characterized by a complex industrial structure. The All-Russia Classifier of Types of Economic Activity OK 029-2014 (OKVED 2), which is in effect as of February 1, 2014, contains more than 2600 groups [18]. The sectors actively interact with each other, carrying out production and distribution of goods using fixed assets and labor force; and the redistribution of incomes takes place.
Consideration of these processes is of great importance for the development of management actions. Regulation of the economy should be based on a methodology that allows us to look inside this “black box” and explore its internal structure. In order to analyze major inter-industry connections, structural changes and proportions in the economy, to assess the effect of implementation of control actions and their effectiveness, and to identify drivers and conditions of development, it is advisable to use input-output models.
The aim of the study is to systematize various trends in the use of input-output models in government regulation of the economy. With the use of fundamental works of domestic and foreign scientists, we solved the following problems: we generalized theoretical and methodological foundations for constructing input-output models and disclosed their structure. In this case we studied the experience of designing inputoutput tables and the evolution of their use in different countries.
An input-output model (input-output tables) is a set of interrelated economic indicators, characterizing in detail the production and use of goods and services and the income earned in the production process broken down by detailed types of economic activity, products and services [15].
An input-output model contains three quadrants (Fig. 1) . The first quadrant that includes intermediate consumption shows the value of all goods and market services consumed in a production order. The second quadrant presents the final use of goods and services, gross accumulation and exports of goods and services. The third quadrant contains the cost structure of gross value added (GVA). Important cost components of GVA (in rows) are the remuneration of employees, gross profit, gross mixed income, production-related taxes and subsidies, consumption of fixed capital, taxes and subsidies on products.
Figure 1. An input-output model
|
Sectors and GVA |
Intermediate demand |
Final demand |
||||
|
Consumer sectors |
Final consumption |
Accumulation |
Net export |
|||
|
12345678 |
||||||
|
Agriculture |
1 |
I quadrant |
II quadrant |
|||
|
Mining |
2 |
|||||
|
Industry |
3 |
|||||
|
Construction |
4 |
|||||
|
Trade |
5 |
|||||
|
Transport and communications |
6 |
|||||
|
Services |
7 |
|||||
|
Other |
8 |
|||||
|
о |
Wages and salaries |
III quadrant |
||||
|
Entrepreneurship profit |
||||||
|
Taxes |
||||||
Source: compiled by the author with the use of [14].
Theoretical basis of input-output models was developed by W.W. Leontief. In the 1930s, he successfully implemented this method in designing the first input- output tables for the U.S. for 1919 and 1929 for 44 economic sectors [21]. By the mid-1950s, W. Leontief’s ideas have gained worldwide recognition, and input-output tables were developed for the United States, France, the Netherlands, Norway, and Australia.
In domestic practice the method was first implemented in a full-scale input-output model of production and distribution of products in the national economy of the USSR for 1959. Basic input-output models (i.e. those formed on the basis of direct surveys of production and consumption) were developed further on a regular basis every five years: in 1966, 1972, 1977, 1982, and 1987.
Currently, the role of the input-output methodology that represents a powerful tool for quantitative analysis of linkages in the real economy has long been recognized in most countries of the world [42]. Development of input-output tables became part of the regular work at statistical agencies in the countries that wish to pursue meaningful industrial and regional policy [13]. Assessments of input-output tables performed at formal and informal levels with different frequency and different quality are available for 94 out of the 193 countries in the UN [44]. Moreover, state statistics agencies of the top 20 countries (which account for about 80% of world GDP) produce these tables on a regular basis. In developed countries, input-output tables were built into the system of national accounts long ago (since 1968 in accordance with the recommendations of the UN manual of national accounting SNA-68; Tab. 1). For example, in the U.S. yearly input-output tables for 71 types of commodities for 1947– 2015 are on the open Internet on the website of the Bureau of Economic Analysis (2007 available as a base table for 389 products). The development of such tables is a necessary element of the statistical base for EU member states. These tables are developed in Japan, China, Canada, and several other countries (including Ukraine, Belarus and Kazakhstan). In order to implement major research tasks (assessment of the prevalence of technology, carbon dioxide emissions, global chains of creation of value added) database of inputoutput tables are created by international organizations (WIOD, OECD, GTAP) as well.
In Russia, the latest input-output tables published by Rosstat date back to 2003. Their data are aggregated into 24 types of goods (the industry is represented by 13 types). However, despite such a high degree of aggregation, the tables give information about major proportions of production and consumption in the Russian economy that are consistent with the system of national accounts. However, after 2006 even these aggregated input-output tables ceased to be constructed.
Table 1. Developers of input-output tables
This fact forced research organizations (RAS Institute of Economic Forecasting, the Institute of Economics and Industrial Engineering of the Siberian Branch of RAS, the Institute for Macroeconomic Research, etc.) to carry out experimental estimation of input-output tables. The results of such assessments can be quite different; however, they can be neither confirmed nor refuted [15]. The real picture of the internal structure of an economy, including the clarification of parameters of non-observed economic activities by its types, can be done only with the help of designing basic input-output tables according to a comprehensive pattern on the basis of a large-scale survey of the Russian economy.
14 February, 2009, the Resolution of the RF Government No. 201-r, which ordered the Federal State Statistics Service (Rosstat) “for the purpose of forming official statistical information about the inter-sectoral linkages and structural proportions of economy of the Russian Federation, as well as improving the quality of statistical and predictive calculations of macroeconomic indicators” to develop basic input-output tables for 2011 and to submit them in 2015 to the Government of the Russian Federation, as well as to develop basic input-output tables on a regular basis once every five years [17]. In pursuance of this resolution Rosstat organized a survey of costs in the Russian economy and developed basic input-output tables for 2011. At the end of March 2017, the materials were published in the public domain. The development of the next basic input-output tables for 2016 was launched last year. It can be argued that the work on regular creation of Russian inputoutput tables has been streamlined after the difficulties of the 1990s. The scientific community and public authorities have obtained a reliable source of information for a wide range of interdisciplinary studies.
Practical application of input-output tables is considered in the works of many domestic and foreign scientists such as
W.W. Leontief, E.F. Baranov, A.G. Granberg, M.N. Uzyakov, Yu.V. Yaremenko, V.S. Nemchinov, A.G. Aganbegyan, V.S. Dadayan, V.V. Kossov, M.Ya. Lemeshev, L.I. Danchenko, V.L. Ven, E.B. Ershov, V.Ya. Lumel’skii, I.N. Rabinovich, L.A. Khiatser, B.A. Shchen-nikov, A.I. Erlikh and others, as well as foreign economists, such as A. Ghosh, N. Rasmussen, R. Stone, V.D. Fischer, M. Holzmann, K. Masaaki, Y. Morimoto, H. Neudecker, V. Strnad, H. Tail, M. Hatanaka, I. Yamada, etc.
The entire range of application of inputoutput models in economic research can be grouped into two blocs: analytical and model (contingency and forecast) calculations (Fig. 2) .
Analytical calculations
An input-output table presents all key macroeconomic indicators (including those broken down by economic activities and institutional sectors):
Figure 2. Areas of application of input-output models
Analytical calculations
1. Analysis of absolute indicators
2. Analysis of inter-industry links
3. Structural analysis
4. Study of basic proportions
5. Analysis of economic efficiency
|
Model calculations |
||
|
|
|
– gross output;
– intermediate consumption;
– gross value added;
– final consumption (households and government);
– gross accumulation;
– change of inventories;
– import and export;
– payroll;
– gross profit and gross mixed income;
– taxes (VAT, excise duties, customs duties and others), etc.
Analysis of these indicators is of great practical importance and is widely used in economic research [4, 9, 11, 12, 19, 34, 36, 47, 48, 50, 51, 53]. On the basis of these indicators it is possible to conduct dynamic and interregional comparisons and different calculations of relative indicators.
Input-output models are an important analytical tool for the study of inter-industrial interaction in the economy . It helps analyze the exchange of goods in current production (intermediate) consumption (quadrant 1) and goods coming in final consumption (quadrant 2).
The analysis is carried out on the basis of input-output coefficients1 and total expenditure coefficients2, which characterize the structure of material costs by individual sectors. The more intense relationships in the economy, the higher is the value of total costs, i.e., additional output induced with the help of inter-sectoral linkages. For example, the direct costs of production of 1,000 rubles of ferrous metals are 671 rubles, the total costs, taking into account the inter-industry interactions, are equal to 1,447 rubles.
The analysis of inter-industry relations is reflected in the works of many researchers. For example, J. Richter assesses the impact of the growth of tourist expenditures on the economy of Austria [54]; L. Beiriz considers the dependence of scientific research expenditures from the volume of foreign trade in automobiles and pharmaceutical products with major trading partners – the U.S. and China [24].
Input-output models also help carry out structural analysis on a wide range of economic indicators, such as:
– production structure in economic sectors;
– structure of formation of resources of goods and services;
– structure of purchasers’ prices by type of goods and services;
– goods structure of intermediate consumption;
– industry structure of the intermediate demand (including that broken down by domestic and imported goods and services);
– structure of the use of goods and services (including that broken down by domestic and imported goods and services);
– functional structure of the final demand (including that broken down by domestic and imported goods and services);
– product structure of functional elements of the final demand (including that broken down by domestic and imported goods and services);
– element-by-element structure of value added by economic sectors;
– sectoral structure of the elements of added value;
– cost structure of domestic and imported goods and services.
Examples of structural analysis with the use of input-output models can be found in the works of many researchers. For example, the works of R. Paniccia devoted to the structural analysis of the Italian economy at the regional level [23], the works of D. Nyhus on analyzing structural changes in the system of reproduction, energy intensity and environmental damage for the Chinese economy [27], and the works of A. Shirov on the problems of structural changes in the national economy of Russia [37].
In addition to the study of the structure of the economy, input-output models give an opportunity to calculate important economic and sectoral proportions (Tab. 2) .
On the basis of input-output models it is possible to calculate economic effectiveness ratios such as labor productivity, capital productivity, and profitability for individual industries and for the whole national economic complex (Tab. 3) .
Examples of assessing economic efficiency on the basis of input-output models can be found in the works of L. Safiullina (assessment of competitiveness of Russian regions [22]), M. Grassini (evaluation of the effectiveness of the Italian economy and its individual sectors [45]).
Table 2. Indicators of national economic and sectoral proportions
|
Characteristic of the indicator |
Calculation formula |
|
Ratio of production consumed to production produced |
R/X |
|
Ratio of resources to production output |
N/X |
|
Ratio of resources to consumption |
R/N |
|
Proportion of import in aggregate internal consumption |
I/R |
|
Proportion of local production in ensuring the consumption of products |
(R – I)/R |
|
Proportion of export in total production |
W/X |
|
Proportion of export in the total amount of resources |
W/N |
|
Proportion of value added in gross output |
М/Х |
|
Proportion of material costs in the prime cost of goods |
С/(С + V + А) |
|
Proportion of amortization in the prime cost of goods |
A/(C + V + A) |
|
Proportion of labor remuneration in the prime cost of goods |
V/(C + V + A) |
|
Explanation: Х – gross output; Y – volume of final product produced; W – export volume; I – (R = X – W + I); N – amount of resources (N = X + I); С – material expenses; А – capital М – gross value added; S –accumulation fund. |
import volume; R – consumption volume consumption (amortization); V – payroll; |
Table 3. Indicators characterizing the efficiency of the national economy and individual sectors
|
Characteristic of the indicator |
Calculation formula |
|
Material costs per ruble of gross output, rub. |
С/Х |
|
Labor productivity, rub./person: |
|
|
– by gross output |
Х/L |
|
– by product produced |
(Y – А)/L |
|
Yield of capital investments, rub./rub.: |
|
|
– by gross output |
Х/F |
|
– by product produced |
(Y – А)/F |
|
Profitability, %: |
|
|
– by self cost |
М/(С + V)·100% |
|
– by the average annual value of fixed assets |
М/F·100% |
|
– by the sum of the values of the consumed capital and labor |
М/(A + V)·100% |
|
Explanation: L – number of people employed in economic sectors; F – average annual value of fixed assets; M – profit. |
|
Figure 3. Dynamics of the value added multiplier in the economy of the Russian Federation and the U.S.
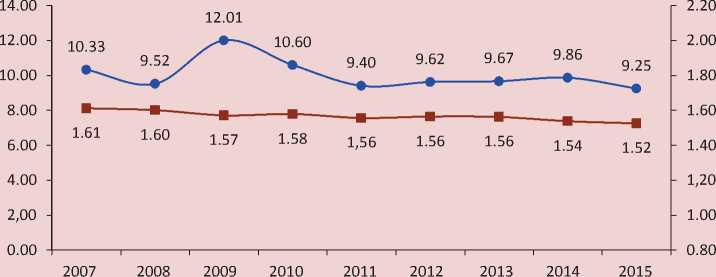
| e U.S. (left scale) ■ Russia (right scale)
Source: calculated by the author with the use of [16, 46].
We used the input-output methodology to calculate the value added multiplier3, an indicator of the adaptability of the economy and the degree of processing of natural resources (Fig. 3) [11, 12]. In addition, this methodology is the basis for designing vertical integration of enterprises – a key tool to increa-sethe value added multiplier in the economy.
The analytical possibilities offered by input-output models led to their extensive use in the practice of economic analysis. A fundamental monograph on input-output models by R.E. Miller and P.D. Blair [49] notes that at present, input-output analysis is one of the methods most widely used in economics. It helps analyze absolute indicators of inter-industry linkages, structure and basic proportions of the economy and its economic efficiency.
Model calculations
Input-output tables can be easily turned into an economic-mathematical model. The model is based on the following basic inputoutput equation:
x = Аx + y, (1)
where x stands for the “vector of gross output”; A – for the “matrix of coefficients of direct costs; y – for the “vector of the final product”.
The simulation uses the following equation:
(Е – А)-1 ⋅ y = x, (2)
where E is the identity matrix; (E – A)-1 is the matrix of coefficients of the total cost.
The use of input-output models even in their simplest forms allows us to perform variations calculations of the state of the economy and take into account its changes in both personal and social needs, and production capabilities. That is, with the help of this model it is possible to use two hypotheses of economic development options. The first one consists on the fact that the final product (final demand) is a driver of development of economic sectors (what happens to the economy, if final demand is changed). The second (opposite) hypothesis implies that the dynamics of production within an industry determines the growth of the final product (what will happen to the economy if the volume of production of goods and services is changed). The model calculations are focused on the achievement of certain final results in the production (increase or decrease in the volume of production) and social (improved standard of living) spheres. Of course, more complex models are used in practice, but their meaning remains the same – they help interconnect a variety of economic indicators.
If the tables contain an additional row that characterizes the cost of labor per unit of output by individual goods, then it is possible to calculate the total need for labor, which occurs when the final demand for certain types of products increases, considering not only direct costs but also indirect costs induced in related industries [15]. No less importance is attached to an opposite task to determine the extent of reduction in the aggregate demand for labor resources if demand for a particular product reduces given the decline in demand for products of related industries and, consequently, reduction in the manpower requirements. This kind of analysis is in demand when assessing the extent of unemployment that may occur, for example, in a crisis or when major changes take place in the structure of production that requires reallocation of labor from some industries to others [15].
The works on the development of methodology and practical application of inter-industry simulation have a long history. The principles of input-output models, as we have already noted, were developed in the first half of the 20th century by W.W. Leontief; however, the practical use of inputoutput models began later. This is largely due to the extensive amount of calculations that are necessary to perform in order to build a forecast and high requirements to the completeness and quality of statistical data.
A great contribution to the development of input-output models was made by Soviet scientists. In the 1960s–1980s in the Soviet Union there was an upsurge in the development of input-output models. A lot of works on static and dynamic input-output models were published by A.G. Granberg [3] and E.B. Ershov [6]. During this period, F.N. Klotsvog, N.F. Shatilov, V.V. Kossov, Ya.M. Urinson, E.F. Baranov, Yu.V. Yaremenko, and others created their models. Currently, input-output models are developed at the Institute of Macroeconomic Research (L.A. Strizhkova), at RAS Institute of Economic Forecasting (M.N. Uzyakov, N.V. Suvorov, A.R. Belousov, etc.), at the Institute of Economics and Industrial Engineering, Siberian Branch of RAS (V.I. Suslov, B.V. Melent’ev, Yu.S. Yershov, and others), at the
Council for the Study of Productive Forces, at the Institute for System Studies of RAS, at RAS Energy Research Institute (D.V. Shapot), and a number of regional institutes (Tab. 4) .
Variants calculations play an important part in the use of input-output models. Researchers consider various options for economic development in the implementation of certain scenarios – from assessing the effects of changes in the rates of social contributions to the country’s withdrawal from the Eurozone (Tab. 5) .
We developed an inter-industry model of the economy that allows us, in addition to the analysis of key indicators and basic proportions in the economy, to carry out variants calculations of changes in the output of goods and services, the number of employees (by occupations), and the volume of payroll by industry and the whole economy under the reduction or increase in final demand for the products [11, 12]. The model allows us to see what will happen to the economy if demand increases in one of the sectors (e.g. in agriculture due to food import restrictions as a result of reciprocal sanctions). The model also shows the extent to which the output in individual industries and in the economy on the whole increases, the extent to which it will be necessary to increase the number of employees (broken down by professions, i.e. how many managers, workers, lawyers etc. will be required for this) and the payroll fund.
Table 4. Input-output models of development of the Russian economy
|
Developer |
Model |
Essence |
|
Center for Macroeconomic Analysis And Short-term Forecasting |
Model for long-term development of Russia’s economy |
Short-, medium-, and long-term analysis of the economic situation and scenario forecasting of economic dynamics of Russia |
|
E.B. Ershov and Yu.V. Yaremenko |
Model for inter-industry interactions [40] |
Forecasting the structure of production – material inter-industry proportions |
|
Institute for Macroeconomic Studies |
Tools of input-output models [32] |
The core of the tools used in the implementation of scenario and forecast calculations is a system of input-output models (static and dynamic input-output models of price; price model based on input-output tables; natural cost input-output model) and cross-sectoral model of financial flows that helps more fully consider the openness of a market economy and forecast VRD assessments |
|
RAS Institute of Economic Forecasting |
Macroeconomic input-output model of the Russian economy RIM [30] |
Analysis and forecast of development of the Russian economy from the point of view of its structure. The model consists of three blocks: the block of production and distribution of products, the block of prices and revenues, and the block of estimated parameters. Production is simulated for 25 economic sectors (including 15 industrial branches). Import is also allocated in the composition of resources. Components of final use are as follows: household consumption, government agencies and nonprofit organizations, gross investment in fixed capital, change in inventories, and export |
|
Institute of Economics and Industrial Engineering, Siberian Branch of the Russian Academy of Sciences |
Optimization interregional inter-industry models SIRENA and SIRENA-2 [35] |
Study of the influence of territorial factors on the trend of development of the national economy, study of the concept of development and location of productive forces, assessment of the possibilities and consequences of the convergence of regional levels of economic development and welfare |
The main point in which forecast calculations differ from variants calculations is the use of dynamic matrices of coefficients of direct costs by the former. The problem of their analyzing and forecasting at present is successfully solved with the help of a sufficiently large number of techniques [1, 10, 31, 33, 39, 43, 52]:
– simple and poorly formalized methods (extrapolation, expert reviews, method of applying matrices, analysis of variance, etc.);
– technology and economic methods (methods of technological and merchandizing shifts, regulatory method, correlation, regression and factor analysis);
– formalized economic and mathematical methods: analysis of time series (smoothing methods, autoregression, finite difference equations), methods for studying dependencies, linear programming method, RAS method, and others.
The system of inter-industry socioeconomic forecasts includes demographic, social and environmental forecasts, forecasts of dynamics and structure of production, development of sectors, development of natural resources, etc. (Tab. 6) .
A promising direction in the use of inputoutput models is to analyze the effects of economic decisions: evaluation of investment
Table 5. Examples of calculations of economic development with the use of input-output models
|
Author |
Variants calculations |
|
V. Potapenko |
Studying the options for development of the pension system in Russia [38]. Assessment of the impact of changes in the rates of social contributions [20] |
|
A. Yantovskii |
Studying economic effects for Russia, Belarus, Kazakhstan and Ukraine in the creation of the Single economic space [8] |
|
N. Suslov |
Assessment of the macroeconomic effects of the implementation of major investment projects in the energy sector and the impact of changes in the technologies of energy consumption or changes in external economic conditions in the energy markets through the use of the interregional input-output model of the Russian economy [34] |
|
V. Gil’mundinov |
Assessment of the impact of inflation targeting in the modern Russian conditions [2, 41] |
|
K.Veib |
Modeling technological change in the sector of renewable energy production (solar energy, wind energy, energy produced by burning biomass, hydro and geothermal energy) [24] |
|
D. Mullins |
Analyzing the functioning of the gasoline production sector in South Africa and determining the optimal level of gasoline consumption for sustainable economic growth in the absence of its own energy resources and strong dependence of domestic prices on world markets [22] |
|
M. Plikh |
Modelling economic dynamics in the implementation of the project for extraction of shale gas in Poland [26] |
|
D. Mead |
Study of the macroeconomic consequences of expanding gas production in the U.S. [27] |
|
R. Horst |
Studying the dynamics of economic activity and employment in the whole economy and for individual states in terms of reducing military expenditure of the U.S. budget [27] |
|
R. Bardacci |
Assessing the impact of Italy’s exit from the Eurozone [25] |
|
U. Lekhr |
Measuring and modelling the energy efficiency in the economy and assessing the impact of its decline on economic dynamics [24] |
|
Evaluation of changes in the structure of foreign trade and relevant industry developments in Latvia and other Baltic States in the period of economic growth 2004–2007 associated with the accession to the European Union, and in the period of recession (2008–2010) [22] |
Table 6. Examples of forecast calculations of economic development with the use of input-output models
Thus, the paper may be useful to those people who make management decisions. Input-output models are also an important tool for analyzing and developing scientifically substantiated variants of scenarios of development of economy and simulation of the effects of their implementation on the socio-economic system. It is possible to use gross output, labor productivity, intermediate consumption, the rate of accumulation of fixed capital, labor remuneration, volume of external and interregional trade, employment, unemployment, and others can be used as control variables. The use of analytical and predictive capability of input-output models provides a solid foundation for state regulation of the economy. Their application helps carry out an in-depth analysis of major inter-industry connections, structural changes and proportions, link the needs and resources in the framework of the whole social production, coordinate the development of related industries and manufacturing, ensure the proportionality and coherence of all elements of the national economy, and calculate different development scenarios.
The novelty of the present research that provides its contribution to the development of science consists in the fact that it systematizes traditional and identifies new approaches to the practical use of the inputoutput methodology in state regulation of the economy.
It is advisable to use input-output models to calculate the multiplier of value added (the indicator of adaptability of the economy and the extent of processing of natural resources) and to design vertical integration of enterprises (a key tool to increase the multiplier of value added in the economy).
References About the role of input-output balance in government regulation of the economy
- Aganbegyan A.G., Granberg A.G. Ekonomiko-matematicheskii analiz mezhotraslevogo balansa SSSR . Moscow: Mysl', 1968. 357 p..
- Gil'mundinov V.M. Kontseptsiya ucheta vozdeistviya shokov fiskal'noi i monetarnoi politiki na otraslevuyu strukturu ekonomiki v obshcheravnovesnoi mezhotraslevoi modeli s blokami agregirovannykh rynkov . In: Alekseev A.V., Kazantseva L.K. (Eds.) Problemy i perspektivy modernizatsii rossiiskoi ekonomiki: sb. nauch. tr. . Novosibirsk: IEOPP SO RAN, 2014. Pp. 61-68..
- Granberg A.G. Modelirovanie sotsialisticheskoi ekonomiki . Moscow: Ekonomika, 1998. 487 p..
- Gubanov S. Neoindustrializatsiya plyus vertikal'naya integratsiya (o formule razvitiya Rossii) . Ekonomist , 2008, no. 9, pp. 3-27..
- Dolgosrochnyi prognoz razvitiya ekonomiki Rossii na 2007-2030 gg. (po variantam) . Problemy prognozirovaniya , 2007, no. 6, pp. 3-45..
- Ershov E.B., Rutkovskaya E.A. Vzaimosvyazi kapital'nykh vlozhenii i vvodov osnovnykh fondov v dinamicheskoi modeli mezhotraslevogo balansa . Ekonomika i matematicheskie metody , 1978, vol. 14, no. 1, pp. 53-64..
- Iogman L.G., Shirov A.A., Yantovskii A.A., Kuvalin D.B. Dolgosrochnyi prognoz sotsial'no-ekonomicheskogo razvitiya Vologodskoi oblasti . Problemy prognozirovaniya , 2009, no. 1, pp. 74-92..
- Shirov A.A. et al. Kompleksnaya otsenka makroekonomicheskogo effekta razlichnykh form glubokogo ekonomicheskogo sotrudnichestva Ukrainy so stranami Tamozhennogo soyuza i Edinogo ekonomicheskogo prostranstva v ramkakh EvrAzES: monografiya . Saint Petersburg: Tsentr integratsionnykh issledovanii, 2012. 168 p..
- Kuchukov R. Modernizatsiya ekonomiki: problemy i zadachi . Ekonomist , 2010, no. 1, pp. 20-29..
- Leont'ev V.V. Mezhotraslevaya ekonomika . Moscow: Ekonomika, 1997. 479 p..
- Lukin E.V. O faktorakh rosta ekonomiki . Voprosy territorial'nogo razvitiya , 2016, no. 2. Available at: http://vtr.vscc.ac.ru/article/1819..
- Lukin E.V. Parametry tekhnologicheskogo razvitiya ekonomiki Rossii . Voprosy territorial'nogo razvitiya , 2015, no. 7 (27). Available at: http://vtr.isert-ran.ru/file.php?module=Articles&action=view&file=article&aid=5245..
- Mel'nikova L.V. Tablitsy "zatraty -vypusk": put' k sblizheniyu natsii . EKO, 2011, no. 5, pp. 27-34..
- Metodologicheskie polozheniya po statistike. Vypusk pervyi . Moscow, 1996. 510 p..
- Mikheeva N.N. Tablitsy "zatraty-vypusk": novye vozmozhnosti ekonomicheskogo analiza . Voprosy ekonomiki , 2011, no. 7, pp. 140-148..
- Natsional'nye scheta Rossii . Available at: http://www.gks.ru/bgd/regl/b14_15..
- Ob informatsii o mezhotraslevykh svyazyakh i strukturnykh proportsiyakh ekonomiki RF: Rasporyazhenie Pravitel'stva RF ot 14.02.2009 g.№ 201-r . Konsul'tantPlyus ..
- OK 029-2014 (KDES Red. 2). Obshcherossiiskii klassifikator vidov ekonomicheskoi deyatel'nosti (red. ot 07.10.2016): utv. Prikazom Rosstandarta ot 31.01.2014 g. № 14-st . Konsul'tantPlyus ..
- Pogosov I.A., Sokolovskaya E.A. Balans resursov i ispol'zovaniya produktsii v Rossii v nachale XXI veka . Moscow: Institut ekonomiki RAN, 2014. 36 p..
- Potapenko V.V. Posledstviya izmenenii stavok strakhovykh vznosov na obyazatel'noe sotsial'noe strakhovanie . Available at: http://www.ecfor.ru/pdf.php?id=books/sa2011/11..
- Ryabushkin B. Razvitie otechestvennoi metodologii i analiticheskikh vozmozhnostei mezhotraslevogo balansa . Ekonomist , 2013, no 07, pp. 66-73..
- Savchishina K.E. Itogi XX mezhdunarodnoi konferentsii po mezhotraslevomu modelirovaniyu INFORUM . Problemy prognozirovaniya , 2012, no. 6, pp. 144-148..
- Website of the Regional Institute for Economic Planning of Tuscany. Available at: http://www.irpet.it
- Website of Universität Osnabrück. Available at: http://www.uni-osnabrueck.de
- Website of the University of Florence. Available at: http://www.unifi.it
- Website of the University of Lodz. Available at: http://iso.uni.lodz.pl
- Website of the University of Maryland. Available at: http://www.umd.edu
- Website of Kazan Federal University. Available at: http://kpfu.ru..
- Serebryakov G.R., Uzyakov M.N., Yantovskii A.A. Mezhotraslevaya model' ekonomiki Ivanovskoi oblasti . Problemy prognozirovaniya , 2002, no. 4, pp. 64-74..
- Serebryakov G.R. Opyt postroeniya dinamicheskoi mezhotraslevoi ravnovesnoi modeli rossiiskoi ekonomiki . Problemy prognozirovaniya , 2000, no. 2, pp. 3-19..
- Stone R. Metod zatraty -vypusk i natsional'nye scheta . Translated from English. Moscow: Statistika, 1964. 263 p..
- Strizhkova L.A. Mezhotraslevye traditsii GU IMEI i problema tovarnykh balansov . Available at: http://www.macroeconomics.ru/MOB_nujen.pdf..
- Suvorov N.V., Suvorov A.V., Borisov V.N. Ekonomicheskii rost, mezhotraslevye proportsii i prioritety razvitiya real'nogo sektora v srednesrochnoi perspektive . Problemy prognozirovaniya , 2002, no. 4, pp. 49-64..
- Suslov N.I. Modelirovanie i analiz mezhotraslevykh i mezhregional'nykh vzaimosvyazei razvitiya energeticheskogo sektora Rossii . Available at: http://regconf.hse.ru/uploads/70c02bddf34324a2cd7115725c17570c3138da1c.doc..
- Suspitsyn S.A. Proekt SIRENA: kompleks modelei situatsionnogo analiza regional'nogo razvitiya . Novosibirsk: IEOPP SO RAN, 2002. 108 p..
- Shirov A.A., Gusev M.S. Logika perekhoda k novoi modeli ekonomicheskogo rosta . Ekonomist , 2015, no. 9, pp. 5-12..
- Shirov A.A., Gusev M.S., Yantovskii A.A. Obosnovanie vozmozhnykh stsenariev dolgosrochnogo razvitiya rossiiskoi EKOnomiki . EKO, 2012, no. 6, pp. 60-80..
- Shirov A.A., Potapenko V.V. Prognoz razvitiya pensionnoi sistemy Rossii na period do 2030 g. . EKO, 2011, no. 3, pp. 38-57..
- Yamada I. Teoriya i primenenie mezhotraslevogo metoda . Moscow: Izd-vo inostr. lit-ry, 1963. 255 p..
- Yaremenko Yu.V. Teoriya i metodologiya issledovaniya mnogourovnevoi ekonomiki . Moscow: Nauka, 1997. 400 p..
- Baranov A., Gilmundinov V., Pavlov V., Tagaeva T. Forecast for the Development of the Russian Economy for 2012-2015 Using the Dynamic Input-Output Model. In: Bardazzi R., Ghezzi L. (Eds.). Macroeconomic modelling for policy analysis. Firenze: Firenze Univ. Press, 2013. Pp. 135-146.
- Baumol W. Leontief's Great Leap Forward. Economic Systems Research, 2000, no. 12, pp. 141-152.
- Eurostat Manual of Supply, Use and Input-Output Tables. Luxembourg: Office for Official Publications of the European Communities, 2008. 590 p.
- Global Trade Analysis Project. Available at: https://www.gtap.agecon.purdue.edu
- Grassini M. Accumulation and Competitiveness. Available at: http://inforumweb.umd.edu/papers/conferences/2009/grassini_paper.pdf
- Input-Output Accounts Data. Bureau of Economic Analysis. Available at: http://bea.gov/industry/io_annual.htm
- Jiang Х. Statistical and Economic Applications of Chinese Regional Input-Output Tables. Groningen: University of Groningen, 2011. 228 p.
- Kurz H.D. Who is Going to Kiss Sleeping Beauty? On the "Classical" Analytical Origins and Perspectives of Input -Output Analysis. Review of Political Economy, 2011, vol. 23, no. 1, pp. 25-47.
- Miller R.E., Blair P.D. Input-Output Analysis: Foundations and Extension. Cambridge: Cambridge University Press, 2009. 784 p.
- Nishimura S. Towards Analysis of Vertical Structure of Industries: A Method and its Application to U.S. Industries. Available at: https://www.iioa.org/working_papers/WPs/WPIOX11-001.pdf
- Oosterhaven J., Stelder D., Inomata S. Evaluation of Non-Survey International IO Construction Methods with the Asian-Pacific Input-Output Table. Available at: http://ir.ide.go.jp/dspace/bitstream/2344/641/3/ARRIDE_Discussion_No.114_inomata.pdf
- Raa T. Input-Output Economics: Theory and Applications. Featuring Asian Economies. Singapore: World Scientific Publishing Co., 2010. 549 p.
- Raa T. The Economics of Input-Output Analysis. Cambridge: Cambridge University Press, 2005. 212 p.
- Richter J. Commodity taxes, commodity subsidies, margins and the like. Available at: http://inforumweb.umd.edu/papers/conferences/2010/Richter.pdf
