Accuracy assessment of similarity measures in collaborative recommendations using CF4J framework

Author: Vijay Verma, Rajesh Kumar Aggarwal
Journal: International Journal of Modern Education and Computer Science @ijmecs
Article in issue: 5 vol.11, 2019.
Free access
There are various libraries that facilitate the design and development of recommender systems (RSs) research in both the academia and industry. Different libraries provide a different set of functionalities based on their foundational design principles. When new algorithms are proposed, researchers need to compare these against prior algorithms considering many challenges such as reproducibility of results, evaluation metrics, test harnesses, etc. Although many open source RS libraries exist to carry out research experiments and provide a varying degree of features such as extensibility, performance, scalability, flexibility, etc. To that end, this paper describes a recently introduced open-source RS library, Collaborative Filtering for Java (CF4J), which is specially designed for collaborative recommendations. Firstly, the brief internals of the CF4J framework are explained and it has been compared with other related libraries such as LibRec, LensKit, and Apache Mahout based on the recommendation approaches and evaluation tools. Secondly, we have summarized all the state-of-art similarity measures provided by the CF4J library. Finally, in order to determine the accuracy of these similarity measures, several experiments have been conducted using standardized benchmark datasets such as MovieLens-1M, MovieLens-10M, and MovieLens-20M. Empirically obtained results demonstrate that the Jaccard-Mean Squared Difference (JMSD) similarity measure provides better recommendation accuracy among all similarity measures.
Recommender Systems, Collaborative Filtering, Similarity Measures, CF4J Framework
Short address: https://sciup.org/15016851
IDR: 15016851 | DOI: 10.5815/ijmecs.2019.05.05
Text of the scientific article Accuracy assessment of similarity measures in collaborative recommendations using CF4J framework
Published Online May 2019 in MECS DOI: 10.5815/ijmecs.2019.05.05
The amount of information on the World Wide Web (or simply Web) is huge and wide. The explosive growth of information on the web frequently overwhelmed Internet users. Recommender Systems (RSs) help individuals who are not able to make decisions from the potentially overwhelming number of alternatives available on the web [1, 2]. Nowadays, most web users interact with RSs in one way or another which provides useful suggestions that may be relevant to users. Since recommendations are usually personalized, therefore, each user receives different suggestions from others. Traditionally, RSs are classified into following broad categories based on the filtering algorithm.
-
• Content-based: The system recommends items
that are similar to the ones that user liked in the past [3, 4].
-
• Collaborative Filtering-based: The system
recommends items that other users with similar tastes linked in the past [5, 6].
-
• Hybrid: These systems combine content-based and collaborative techniques [7, 8].
Collaborative Filtering(CF)
Memory-based (Neoghborhood-based)
Model-based
introduce a new similarity measure using this framework.
-
• Evaluation of the similarity measures based on predictive accuracy measures (such as MAE/RMSE) and classification-based accuracy measures (such as precision) using standardized benchmark datasets (in movie domain).
User-based CF(UBCF)
Item-based CF (IBCF)
Fig.1. A general classification of collaborative filtering-based recommendations.
Researchers have proposed a wide variety of algorithms for decades and new approaches are rapidly emerging in the RS literature. There is always a concern for comparing different approaches along with reproducible results. In order to accomplish these goals, there exist various libraries which support the development and experimentation with recommender systems. Different libraries provide a diverse set of functionalities based on their design foundations and some of them are commercial while others are open source. In this research, we have focused on open source RS libraries, particularly written in java language. Among these RS libraries, few libraries are not under active development but are available for use such as Duine[21], Cofi[22], Easyrec[23], and PREA[24]. Based on the general bibliography, following libraries are widely used for RS experimentation and are under active development: LibRec[25], Apache Mahout[26], [27], LensKit[28], and Cf4J[29]. It is always beneficial to utilize RS libraries that facilitate researchers to design and implement new recommendation methods. A researcher or developer may choose an appropriate library for RS experimentation based on various constraints such as performance, efficiency, extensibility, etc.
This paper describes a recently introduced RS library, Collaborative Filtering For Java (CF4J)[29], which is specifically designed for collaborative filtering-based recommendations. The CF4J library facilitates: a) dataset loading, b) splitting the dataset into test and training data, c) complete and effortless access to intermediate or final result values, d) parallel execution framework specially designed for collaborative filtering, and e) evaluation of quality through various metrics. The CF4J framework also provides an implementation of state-of-the-art similarity measures proposed by various researchers. The contribution of this paper is as follows:
-
• Provides the internals and design details of the CF4J framework.
-
• Compares and contrasts the CF4J library with other related libraries based on recommendation methodologies and evaluation metrics.
-
• Summarizes all the similarity measures provided by the CF4J framework and explains how to
-
II. Preliminaries
In order to define the recommendation problem formally, we used the following notations as shown in Table 1. Primarily, there are two most important ways in which the recommendation problem can be specified systematically: the best item and top-N recommendation problem. The first formulation is to find a new item, for a particular user, which is most relevant to the user. The second formulation is to determine the top-N items, for a particular user. Basically, in order to provide the recommendation for a user, there is no need to find the actual rating values of the items which are to be recommended.
Table 1. Notations used in the Paper
|
Symbol |
Meaning |
|
U |
The set of users in the system |
|
I |
The set of items in the system |
|
R |
The set of all ratings stored in the system |
|
S |
The set of possible values for ratings e.g., S = {1,2,3,4,5} |
|
r ui |
The rating given by a user u ϵ U to a particular item i |
|
I u |
The subset of items that have been rated by a user u |
|
U i |
The subset of users that have rated item i |
|
I uv |
The subset of items that have been rated by two users u and v (I u ∩ I v ) |
|
U ij |
The subset of users that have rated both items i and j |
Collaborative filtering-based (CF) approaches are the most significant and traditional algorithms for recommendations [30]. These algorithms are easy to implement and provide effective recommendations, therefore, are the most popular and widely used among research communities. The fundamental idea behind these approaches is that the information related to the past behaviors or interests of users are exploited and then utilized for suggesting items to the users. The CF techniques consider the basic assumptions that if users had shown the same interests in the past then they will have similar interests in the future too and user’s preferences remain constant and consistent with respect to the time.
Usually, the process of the neighborhood-based collaborative recommendation consists of the following steps [31], i.e. for an active user(u), for whom we want to predict the rating(r ui ) for a new item(i):
-
1) Calculate the similarity of all users with the active user u.
-
2) Select a subset of users most similar to the active user (k nearest neighbors).
-
3) Compute the prediction, r ui , by using the ratings of the k nearest neighbors.
Based on the application domain, the above steps may overlap or their order may be different [32]. It is noteworthy to understand that measuring similarities between users or items is the core component of the neighborhood-based collaborative recommendations. Therefore, this paper examines and evaluates the accuracy of the various similarity measures using standardized benchmark datasets.
-
A. Uncovering CF4J Framework
CF4J stands for Collaborative Filtering for Java. It is a java library specially designed to perform experiments in recommender system research or particularly in collaborative filtering-based recommendations. CF4J has been designed with a motive “a library developed from researchers to researchers” i.e. it is especially suited for the experimentation and research trials of new recommendation algorithms. The library is available from well-known java repositories such as Maven, Gradle, and SBT. Furthermore, the proper documentation of the library makes its usage smooth.
A1. Design of CF4J
Based on the various steps involved in a collaborative recommender system, the CF4J library has been designed according to the package structure shown in Fig. 2. It provides all the functionalities which are required by CF researchers such as data loading, train/test data splitting, etc. Table 2 summarizes the core functionalities provided by each package/subpackage.
A2. Core APIs
The most fundamental classes are User, Item, Kernel, and Processor. Kernel class handles all the data associated with the recommendation process i.e. it loads the rating data and builds a data model for manipulating rating values. Processor class enables to execute an intermediate step of the collaborative recommendation process to be parallelized. User class provides an abstraction to represent a user and accommodates information related to the user of the recommender system. Similarly, Item class abstracts an item and contains the information associated with the item. Fig. 3 represents the functionalities provided by (a) User class (b) Item class.
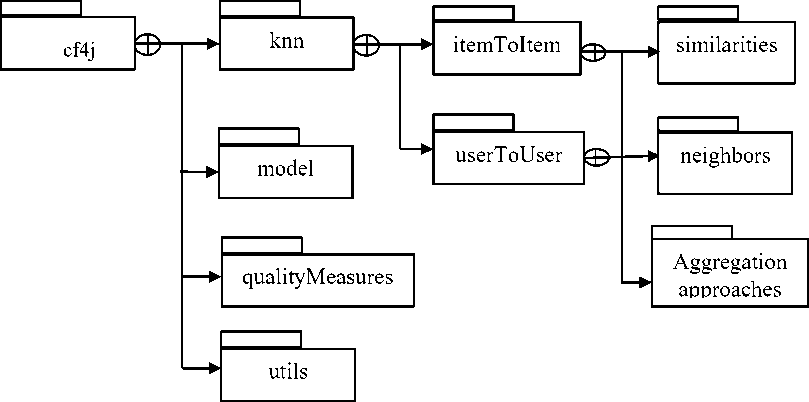
Fig.2. The package structure of the CF4J library.
Table 2. The core functionalities provided by CF4J library
|
Package/sub package Name |
Core functionalities |
|
cf4j |
It consists of the indispensable classes of the library. |
|
cf4j.knn |
It contains the implementation of the various components of the k-nearest neighbor methods such as similarity measures, aggregation approaches, etc. |
|
cf4j.model |
It includes a matrix factorization-based collaborative filtering technique. |
|
cf4j.qualityMeasures |
It includes the implementation of various quality measures. |
|
cf4j.utils |
It contains various utilities used by the library. |
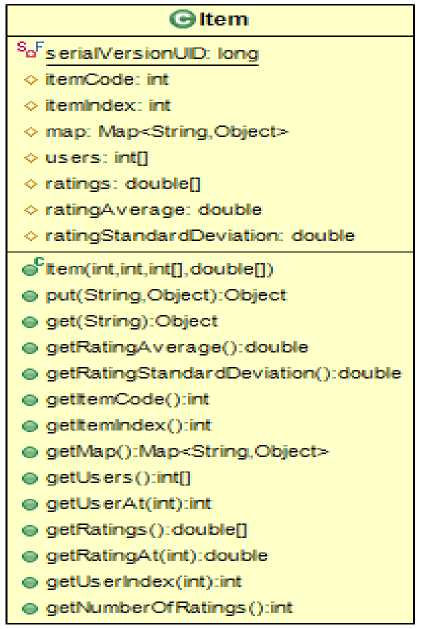
For illustration purpose, the basic steps involved in a typical user-based collaborative filtering (UBCF) are shown in Fig. 4 where the similarity between users is calculated using the traditional Pearson Correlation
Coefficient, neighbors’ratings are aggregated using deviation from the mean approach, and the recommendation quality is evaluated using the mean absolute error (MAE) metric .
-
III. Related Frameworks
There are many possible ways in which one can compare different programming libraries which are developed to accomplish the same or similar tasks. Different researchers prioritize different goals based on the requirements such as ease of use, popularity, support and documentation, performance, extensibility, etc. Here, we have discussed only those RS libraries that are developed using Java technology and are popularly used in the RS literature. Furthermore, there are few libraries that are under active development nowadays while others are outdated but still available for experimentation and usage. Table 3 lists the RS libraries that are not under active development presently but may be utilized for various RS research tasks specific to them.
Based on the general bibliography in the RS research, the following libraries are widely used for the RS experimentation and are under active development: -
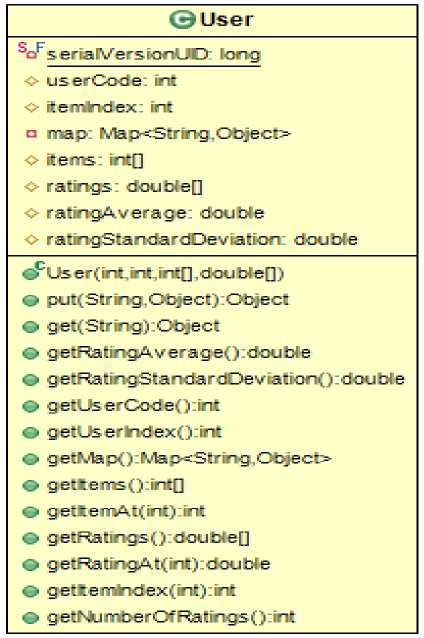
(a)
(b)
Fig.3. The UML diagrams showing the functionalities provided by (a) User class (b) Item class.
Table 3. The recommendation toolkits that are not under active development currently
|
Duine [33] |
Cofi [22] |
Easyrec [34] |
PREA [24] |
|
|
Baseline Approaches |
Popularity User Average |
Constant User/Item Average |
It provides recommendations to websites through plugins, REST API, and JavaScript. However, no details regarding implemented algorithms are provided. |
Constant User/Item/overall Average Random-guess |
|
Collaborative filtering-based Approaches |
Memory-based CF
Model-based
|
Memory-based CF
Model-based
|
Memory-based CF
Model-based
|
|
|
Other Methods |
Case-based reasoning Simple content-based |
- |
- |
Rank-based CF SlopeOne method |
|
Evaluation Metrics |
MAE |
MAE RMSE |
On-line evaluation |
MAE, RMSE Precision/Recall/F1 HLU/NDCG Kendall’s Tau, Spearman |
|
Other Features |
Explanation APIs |
Provides wrappers for other languages |
Easy to integrate and easy usage. |
Provides wrappers for other languages |
-
• LibRec[25]
-
• Apache Mahout[26, 27]
-
• LensKit[28]
-
• Cf4J[29]
Except for the LibRec framework, the remaining frameworks primarily focus only on the collaborative filtering-based recommendation approaches while the LibRec framework provides support for various different RS approaches. Table 4summarizes the various recommendation approaches and evaluation metrics provided by these libraries. Since this article evaluates the accuracy of various similarity measures available in the CF4J framework, therefore, we have listed the similarity measures provided by each framework in Table 5.
-
IV. Similarity Measures
Neighborhood-based collaborative filtering employs various measures of similarity for discovering the neighborhood of an active user or item. This section briefly summarizes all the similarity measures which are provided by the CF4J framework. Here, we have used the same notations as explained in the earlier section.
It displays the linear relationship between the rating vectors and demonstrates the degree to which two rating vectors are linearly related. Its value lies between -1 to +1; where the value +1 shows complete +ve linear correlation, 0 shows no linear correlation and -1 is complete -ve linear correlation [37, 38].
∑(rui-ru)(rvi-rv)
PCC ( u , v ) = i ∈ I uv (1)
∑(rui-ru)2∑(rvi-rv)2
i ∈ Iuv i ∈ Iuv
-
B. Constrained Pearson Correlation Coefficient (CPCC)
It modifies the traditional PCC by using the median value (of the rating scale) in place of average rating. This This variant keeps in mind the positivity and negativity of the ratings [6].
CPCC ( u , v ) =
∑ ( rui - rmed )( rvi - rmed ) i ∈ Iuv

- r )2( r - r )2 med vi med
i ∈ Iuv
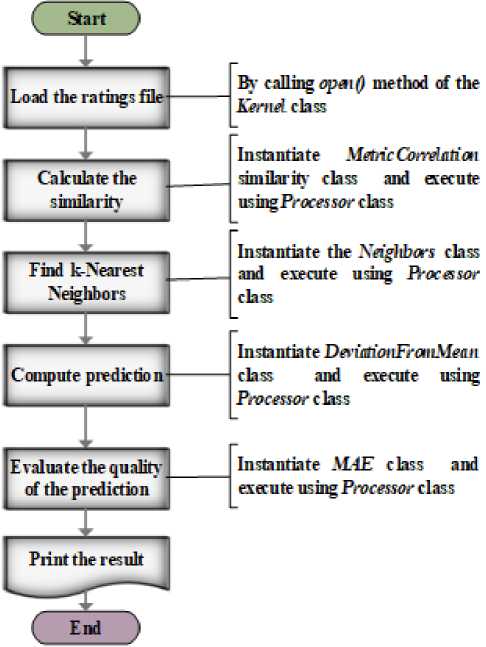
Fig.4. The flow diagram showing basic steps in user-based collaborative filtering (UBCF).
where r med is the median value of the rating scale.
-
C. Cosine Similarity (COS)
It measures the cosine of the angle between the rating vectors, smaller angle means greater similarity [12].
COS(u,v)=
∑ (rui)(rvi)
i ∈ I
-
D. Adjusted Cosine Similarity (ACOS)
It modifies the traditional PCC measure for computing similarities between items so that the differences between individual users can be taken into account. This measure used to calculate the similarity between items but can be analogously used for measuring the similarities between users.
∑ (rui -ri)(ruj -rj)
u ∈ Uij
∑(rui-ri)2∑(ruj-rj)2
u ∈ U u ∈ U
A. Pearson Correlation Coefficient (PCC)
Equation (4) measure the traditional PCC between two items i and j, where Uij represents the set of users who have rated both the items i and j. The Adjusted Cosine Similarity (ACOS) [39] modifies (4) to incorporate the individual differences between users, therefore, can be defined by (5) as given below:
ACOS ( i , j ) =
∑ (rui -ru)(ruj -ru)
u ∈ U ij (5)
(rui-ru)2∑(ruj-ru)2
E. Spearman's Rank Correlation Coefficient (SRCC)
of rank correlation. Spearman's correlation assesses monotonic relationships between the two observations. It returns value from -1 to 1; where 1 shows a perfect +ve correlation between ranks, 0 shows no correlation and -1 is perfect -ve correlation between the ranks [46]. It is also called Spearman’s rho and denoted by the Greek letter ρ (rho) or r s .
It adopts the traditional PCC over the rank values of the two variables, therefore, is a nonparametric measure
Table 4. The most popular and widely used RS libraries which are under active development nowadays
|
CF4J[29] |
Mahout[26], [27] |
LensKit[28] |
LibRec[25] |
|
|
Baseline Approaches |
- |
Random recommender Item/user average |
Item/user/global average Least-squares estimators |
Item/user/global average Random/constant guess Popular |
|
Collaborative filtering-based |
Memory-based CF
Model-based
MF[36] |
Memory-based CF
Model-based
|
Memory-based CF
Model-based
|
Memory-based CF
Model-based
|
|
Other Methods |
- |
Basic slope one recommender |
slope one weighted slope one |
Content-based RS Hybrid RS Context-aware RS Weighted slope one |
|
Evaluation Metrics |
Predictive Accuracy
Classification based
Others
|
Predictive Accuracy
Classification based
|
Predictive Accuracy
Classification based
Rank
|
Predictive Accuracy
Classification based
Ranking based
Others
|
Table 5. The different similarity measures available in RS libraries
|
Similarity Measure Name |
Ref. |
CF4J |
Mahout |
Lenskit |
LibRec |
|
Pearson Correlation Coeff. (PCC) |
[37], [38] |
v |
V |
V |
V |
|
Constrained PCC (CPCC) |
[6] |
v |
V |
||
|
Cosine Similarity (COS) |
[12] |
v |
V |
V |
V |
|
Adjusted Cosine Similarity (ACOS) |
[39] |
v |
|||
|
Spearman’s Rank Correlation (SRCC) |
[46] |
V |
V |
V |
|
|
Jaccard Index (JI) |
[40] |
V |
V |
V |
|
|
Mean Squared Difference (MSD) |
[6] |
V |
V |
||
|
Jaccard-MSD(JMSD) |
[41] |
V |
|||
|
Coverage-JMSD (CJMSD) |
[42] |
V |
|||
|
Singularity-based similarity (SING) |
[43] |
V |
|||
|
Proximity-Impact-Popularity (PIP) |
[44] |
V |
|||
|
Euclidean distance |
V |
V |
|||
|
City Block distance |
V |
||||
|
Loglikelihood |
V |
||||
|
Extended Jaccard Similarity |
V |
||||
|
Binary Cosine Similarity |
V |
||||
|
Mean Squared Error Similarity |
V |
||||
|
Dice Coefficient |
[45] |
V |
|||
|
Kendall Rank Correlation Coefficient |
[46] |
V |
|||
|
Mutual Information Similarity |
[47] |
V |
If all the ranks are distinct, then it can be measured using (6) as given below:
CJMSD ( u , v ) = 1 I u I v 1 x Jaccard ( u , v )
р =1 -
6 ^ d i n ( n 2 -1)
x MSD ( u , v )
Where n is the number of observations and d i is the difference between the two ranks of the ith observation. In the RS scenario, (6) may be rewritten as follow:
J. Singularity-based similarity (SING)
To calculate the similarity between two users, the commonly rated items are divided into three subgroups:
SRCC ( u , v ) = 1 -
6 Z ( r«- ^
i e I uv _____________________
I I uv I x (| I uv |2 - 1)
F. Jaccard Index (J)
It is the ratio of the size of intersection divided by the size of the union. Likewise, the similarity between any two users, u and v, may be defined as the proportion of the commonly rated items to the total items rated by two users [40].
J (u, v) =
|IuIv|
|IuIv|
G. Mean Squared D fference (MSD)
It is the arithmetic mean of the squares of differences between corresponding values of the two rating vectors. For example, consider two vectors, x and y each of size n, MSD(x,y) will be equal to i E F=i (^ i — 7 i )2 [6]. The similarity based on MSD can be defined as {1 – MSD(x,y) } since the MSD measures the differences between the two vectors. Therefore, the similarity between any two users, u and v, may be defined as follows:
-
• Items rated relevant by both the users
-
• Items rated non-relevant by both the users
-
• Items rated as relevant by one user and nonrelevant by the other user
For each commonly rated item, singularity concerned with the relevant and non-relevant vote is calculated using all the users in the database. Finally, a traditional similarity measure is modulated by the value of the singularity over three subsets of the commonly rated items. Here, the authors utilize MSD as a traditional numerical similarity measure [43].
K. Proximity-Impact-Popularity measure (PIP)
It considers the three factors of similarity, Proximity, Impact, and Popularity for defining the overall similarity (SIM) between two users u and v [44].
PIP (u, v) = Z PIP (rui, rv) (12)
i e I uv
where, PIP (r ui , r vi ) is the PIP score for the two rating values. Further, the PIP score for any two ratings r 1 and r 2 is defined as follows:
Z ( r i - ^
MSD ( u , v ) = 1 - i i I uv ---------- (9)
| I uv |
H. Jaccard Mean Squared Difference (JMSD)
This measure combines the Jaccard similarity with MSD similarity to define a new hybrid similarity measure known as JMSD [41].
JMSD (u, v) = jaccard (u, v) * MSD (u, v) (10)
I. Coverage-Jaccard-Mean Squared Difference (CJMSD)
This measure modifies the JMSD measure by adding a term corresponding to the coverage that a user u can provide to another user v, i.e. Coverage = | I u - I v | .
Clearly, this similarity measure is asymmetric as Coverage^v ^ Coverage^ and hence the similarity between two users, u and v, CJMSD ( u , v ) ^ CJMSD ( v , u ) [42].
PIP( r , r 2) = Proximity( r , r 2) x Impact( r , r 2) ^ ^ x Popularity( r , r 2)
where Proximity denotes the simple arithmetic difference between two ratings, Impact measures the strength by which an item is liked or disliked by the users, and Popularity denotes the degree to which two users’ ratings are common.
In all the equations from (1) to (13), all the formulae are written for calculating the similarity between users while analogous formulae can be easily written for calculating similarities between items.
L. Illustrat ve Example
public class ToySimilarity extends UsersSimilarities {
^Override public double similarity(TestUser activeUser, User targetuser) { double a = activeUser.getRatingAverage();
double t = targetuser.getRatingAverage();
:
Fig.5. Illustrative example code for implementing a new dummy similarity measure between two users.
-
V. Experiments
The offline experiments are the easiest to conduct as they require no interaction with real users. Therefore, offline experiments are the most popular and accepted way to evaluate the candidate recommendation approaches in comparison to user studies or online experiments [48].
Table 6. Brief description MovieLens datasets
|
Dataset |
Brief Detail |
Sparsity Level |
|
MovieLens-1M |
• 1000,209 ratings from 6040 users on 3900 movies • Each user has rated at least 20 movies. |
1 - 1000,209 = 95.754 6040 ∗ 3900 |
|
MovieLens-10M |
• 10,000,054 ratings from 71567 users on 10681 movies • Each user has rated at least 20 movies. |
1 - 10000054 = 98.692 71567 ∗ 10681 |
|
MovieLens-20M |
• 20,000,263 ratings from 7138493 users on 27278 movies • Each user has rated at least 20 movies. |
1 - 20000263 = 99.470 138493 ∗ 27278 |
We have performed offline experiments to evaluate the accuracy of various similarity measures available in the CF4J library. All the experiments are performed using standardized benchmark rating datasets (MovieLens-1M,10M, and 20M), which is publicly available from GroupLens research [49]. Table 6 summarizes these datasets briefly, article [50] explains the detailed history and context of MovieLens datasets.
-
A. Experimental Design
To evaluate the performance of various similarity measures, we have employed the user-based collaborative filtering (UBCF) with the k-nearest-neighbors (kNN) technique. The neighbors’ ratings are aggregated using deviation from the mean strategy. All the experiments are performed using the system/software configurations as specified in Table 7.
Table 7. The details of the software and system used for experiments
|
High Performance Computing System |
Intel(R) Xeon(R) Gold 6132(Skylake) 14 cores CPU@ 2.6GHz with 96GB RAM |
|
Operating System |
Windows 10 pro |
|
Eclipse IDE for Java EE |
4.7.2 or higher |
|
Java Runtime Environment (JRE) |
Java 1.8 |
|
CF4J library version |
1.1.1 or higher |
B. Evaluation Metrics
One of the most crucial measure for evaluating the recommender systems is accuracy i.e. their capability to predict users' choice accurately [51]. In the RS literature, accuracy is the most examined goal for designing a recommender system. The fundamental hypothesis is that if an RS predicts users’ preferences accurately then it will be preferred by users. Furthermore, the accuracy measure is not dependent on the user interface of the recommender system, therefore offline experiments are well suited for measuring the accuracy of an RS approaches with datasets from multiple domains. Here, we evaluated the following two types of accuracy measures:
-
• the accuracy of rating predictions
-
• the accuracy of usage predictions
-
B.1. Measuring the accuracy of rating predictions
Let R be the set of all ratings stored in the system i.e. rating matrix, and it is known that a user u has rated an item i with the rating value rui , also a recommendation algorithm predicts this rating as rˆ . Therefore, we can calculate the error of estimation for this particular rating as e =rˆ -r . There are various ways to compute the overall error for a system for a given test set T of useritem pairs (u, i) such as Mean Absolute Error(MAE), Root Mean Squared Error(RMSE), Normalized MAE (NMAE), Normalized RMSE (NRMSE), Average MAE and Average RMSE. Again, the following two metrics are the most popular among the research community for evaluating the accuracy of the rating prediction:
RMSE =1 (rˆ -r )2 (14)
ui ui
| T | ( u , i ) ∈ T
MAE = 17 Zl< r i - r U )l (‘5>
I T I ( и , i) e T
-
B.2. Measuring the accuracy of usage predictions
Many recommender systems do not estimate the actual ratings of items rather try to suggest a set of items(top-N) that may be useful for the users. In order to calculate the accuracy of usage predictions in the offline experiments, we hide some of the items selected by a test user (i.e. purchased or browsed items via implicit feedback) and then predict a set of items that the user will select. The following four cases arise [52], as shown in Table 8.
Table 8. All four possible outcomes of the recommendation process.
|
Recommended |
Not recommended |
|
|
Preferred |
True-Positive(tp) |
False-Negative(fn) |
|
Not preferred |
False-Positive(fp) |
True-Negative(tn) |
Based on the above four cases, the overall quality of a recommender system may be estimated using various quantities such as precision, recall, false positive rate, etc.
Precision = p(16)
# tp + # fp
Recall(True Positive Rate) = tp(17)
# tp + # fn
False Positive Rate = fp(18)
# fp + # tn
In our experiments, we have evaluated Precision at N, where N is the number of recommendations i.e. size of the recommendation list, and varying it with various values of N such as 10, 15,20, etc. Alternatively, the precision of an RS may also be simulated as the ratio of the relevant recommended items with respect to the number of recommended items, along with defining the meaning of relevance items, for example with items with predicted rating ≥ 4 (on a scale of 1 to 5) may be considered as relevant items.
-
VI. Results And Discussion
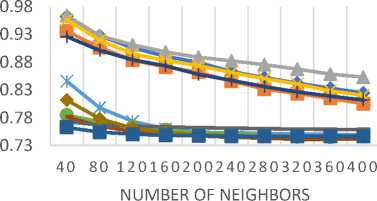
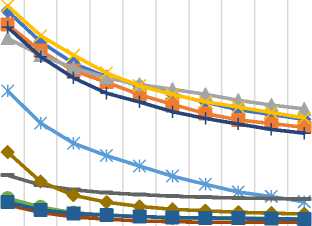
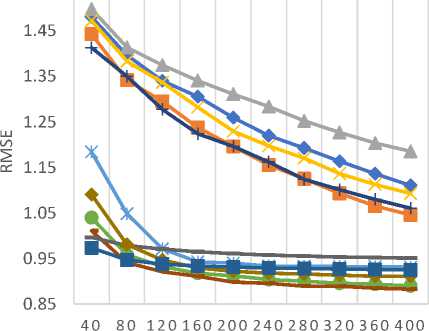
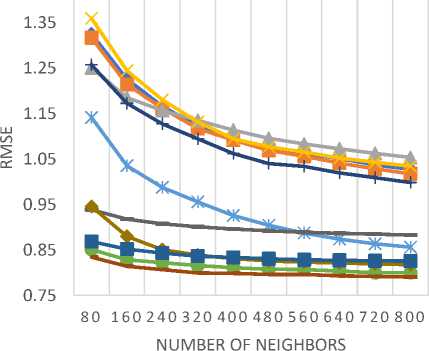
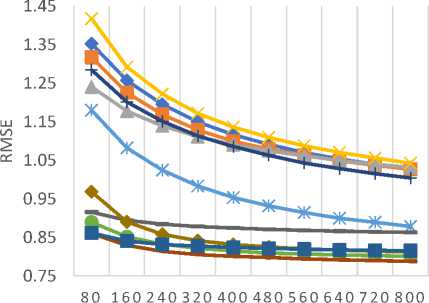
Table 9 lists all the similarity measures along with the corresponding API class name in the CF4J framework. For assessing the predictive accuracy, 80% of the rating data is used as training data while the remaining 20% is used as test data. Furthermore, for each test user, 20% of ratings are used for validation purpose. We have calculated the values of MAE and RMSE for all similarity measures by varying the number of neighbors. MAE and RMSE values are compared for all the similarity measures in Fig. 6 and Fig. 7 respectively for different datasets (a) MovieLens-1M (b) MovieLens-10M (c) MovieLens-20M dataset.
SRCC JI
MSD JMSD
Table 9. The similarity measures provided by CF4J library
|
Similarity Measure |
Ref. |
API Class name |
|
Pearson Correlation Coefficient (PCC) |
[37] |
MetricCorrelation |
|
Constrained PCC (CPCC) |
[6] |
MetricCorrelationConstraine d |
|
Cosine Similarity (COS) |
[12] |
MetricCosine |
|
Adjusted Cosine Similarity (ACOS) |
[39] |
MetricAjustedCosine |
|
SRCC |
MetricSpearmanRank |
|
|
Jaccard Index (JI) |
[40] |
MetricJaccard |
|
Mean Squared Difference (MSD) |
[6] |
MetricMSD |
|
Jaccard Mean Squared Difference (JMSD) |
[41] |
MetricJMSD |
|
Coverage-JMSD (CJMSD) |
[42] |
MetricCJMSD |
|
Singularity-based similarity (SING) |
[43] |
MetricSingularities |
|
Proximity-Impact- Popularity (PIP) |
[44] |
MetricPIP |
PCC CPCC COS ACOS
CJMSD SING PIP
(a)
80 160240320400480560640720800
NUMBER OF NEIGHBORS
0.92
0.87
0.82
0.77
0.72
0.67
(b)
NUMBER OF NEIGHBORS
(c)
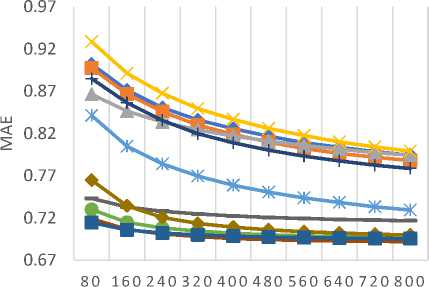
Fig.6. The MAE values for (a) MovieLens-1M (b) MovieLens-10M (c) MovieLens-20M datasets
The empirical results of MAE values, as shown in Fig. 6 (a)-(c), demonstrate that the JMSD measure provides better predictive accuracy than other similarity measures. It should be noted that both JMSD and PIP provide almost comparable results but for small neighborhood size, PIP measure results in better values than the JMSD measure.
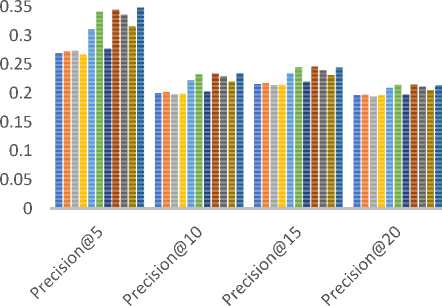
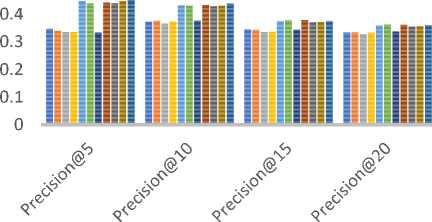
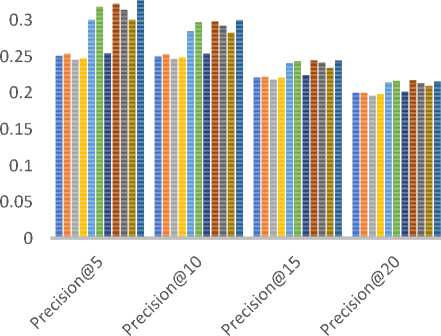
In order to assess classification-based accuracy, we have evaluated precision values by varying the size of the recommended list i.e. Precision@N and N= 5, 10, 15…. etc. The metrics that are taken from the information retrieval domain such as precision, describe users’ involvement nicely in comparison to predictive accuracy measures such as MAE/RMSE[52]. Table 10 summarizes the different parameter values used for measuring precision values. Fig. 8 compares the precision values for different size of the recommended list for all three datasets (a) MovieLens-1M (b) MovieLens-10M (c) MovieLens-20M.
As shown in Fig. 8 (a)-(c), the empirically obtained values of precision demonstrate that both JMSD and PIP measures provide almost comparable results. Here again, for the small size of recommendation list (e.g. top-5 and top-10), the PIP measure results in slightly better precision values than the JMSD measure. Based on the empirical results, we believe that if online e-commerce portal demands both types of accuracy (predictive and classification-based) simultaneously then JMSD measure may result in better recommendations than other similarity measures.
NUMBER OF NEIGHBORS
(a)
(b)
NUMBER OF NEIGHBORS
(c)
Fig.7. The RMSE values for (a) MovieLens-1M (b) MovieLens-10M (c)
MovieLens-20M datasets
Table 10. Different parameters involved in experimenting with classification-based accuracy.
|
ML-1M |
ML-10M |
ML-20M |
|
|
Test-Users % |
20% |
||
|
Test-Items % |
20% |
||
|
Rating Threshold (β) |
4 |
||
|
Recommendation size |
{5, 10,15,20} |
||
|
Neighborhood-Size |
180 |
320 |
400 |
- PCC ■ CPCC ■ COS ■ ACOS
(c)
Fig.8. The Precision values for (a) MovieLens-1M (b) MovieLens-10M (c) MovieLens-20M datasets
= SRCC = JI = MSD = JMSD
= CJMSD = SING = PIP
(a)
(b)
-
VII. Conclusions
This paper describes a recently introduced open-source java library, Collaborative Filtering for Java (CF4J), for performing RS research experiments. The brief internals of the CF4J framework are explained so that it can be utilized to carry out the implementation of new recommendation tasks such as similarity measure, evaluation metric, etc. Furthermore, the Cf4J framework is also compared with the other related libraries such as LibRec, LensKit, and Apache Mahout. It also provides the implementations of the state-of-art similarity measures for collaborative recommendations. In this research, several experiments have been conducted for evaluating the accuracy of these similarity measures using standardized benchmark datasets (MovieLens-1M, 10M, and 20M). From the empirically obtained results, it is concluded that the JMSD measure provides better recommendation accuracy among all the available similarity measures.
As a summary, the CF4J framework provides a simple way to conduct RS experiments with a unique parallel execution framework specially designed for collaborative recommendations. It provides excellent flexibility for accessing any intermediate value and is expendable for new implementations proposed by researchers. For the future work, this framework can be expanded into multiple dimensions such as implementing new recommendation approaches, evaluation methods, new similarity measures, etc.
References Accuracy assessment of similarity measures in collaborative recommendations using CF4J framework
- G. Adomavicius and A. Tuzhilin, “Toward the next generation of recommender systems: A survey of the state-of-the-art and possible extensions,” IEEE Trans. Knowl. Data Eng., vol. 17, no. 6, pp. 734–749, 2005.
- J. Bobadilla, F. Ortega, A. Hernando, and A. Gutiérrez, “Recommender systems survey,” Knowledge-Based Syst., vol. 46, pp. 109–132, 2013.
- K. Lang, “NewsWeeder : Learning to Filter Netnews ( To appear in ML 95 ),” Proc. 12th Int. Mach. Learn. Conf., 1995.
- C. Science and J. Wnek, “Learning and Revising User Profiles: The Identification of Interesting Web Sites,” Mach. Learn., vol. 331, pp. 313–331, 1997.
- W. Hill, L. Stead, M. Rosenstein, and G. Furnas, “Recommending and evaluating choices in a virtual community of use,” in Proceedings of the SIGCHI conference on Human factors in computing systems - CHI ’95, 1995.
- U. Shardanand and P. Maes, “Social information filtering: Algorithms for Automating ‘Word of Mouth,’” Proc. SIGCHI Conf. Hum. factors Comput. Syst. - CHI ’95, pp. 210–217, 1995.
- R. Burke, “Hybrid recommender systems: Survey and experiments,” User Model. User-Adapted Interact., 2002.
- Billsus Daniel and Pazzani Michael J., “User modeling for adaptative news access,” User Model. User-adapt. Interact., vol. 10, pp. 147–180, 2002.
- X. Su and T. M. Khoshgoftaar, “A Survey of Collaborative Filtering Techniques,” Adv. Artif. Intell., vol. 2009, no. Section 3, pp. 1–19, 2009.
- M. D. Ekstrand, “Collaborative Filtering Recommender Systems,” Found. Trends® Human–Computer Interact., vol. 4, no. 2, pp. 81–173, 2011.
- Y. Shi, M. Larson, and A. Hanjalic, “Collaborative Filtering beyond the User-Item Matrix : A Survey of the State of the Art and Future Challenges,” ACM Comput. Surv., vol. 47, no. 1, pp. 1–45, 2014.
- J. S. Breese, D. Heckerman, and C. Kadie, “Empirical analysis of predictive algorithms for collaborative filtering,” Proc. 14th Conf. Uncertain. Artif. Intell., vol. 461, no. 8, pp. 43–52, 1998.
- D. Joaquin and I. Naohiro, “Memory-Based Weighted-Majority Prediction for Recommender Systems,” Res. Dev. Inf. Retr., 1999.
- A. Nakamura and N. Abe, “Collaborative Filtering Using Weighted Majority Prediction Algorithms,” in Proceedings of the Fifteenth International Conference on Machine Learning, 1998, pp. 395–403.
- D. Billsus and M. J. Pazzani, “Learning collaborative information filters,” Proc. Fifteenth Int. Conf. Mach. Learn., vol. 54, p. 48, 1998.
- T. Hofmann, “Collaborative filtering via Gaussian probabilistic latent semantic analysis,” Proc. 26th Annu. Int. ACM SIGIR Conf. Res. Dev. information Retr. - SIGIR ’03, p. 259, 2003.
- L. Getoor and M. Sahami, “Using probabilistic relational models for collaborative filtering,” Work. Web Usage Anal. User Profiling, 1999.
- B. Marlin, “Modeling User Rating Profiles for Collaborative Filtering,” in Proceedings of the 16th International Conference on Neural Information Processing Systems, 2003, pp. 627–634.
- D. Pavlov and D. Pennock, “A maximum entropy approach to collaborative filtering in dynamic, sparse, high-dimensional domains,” Proc. Neural Inf. Process. Syst., pp. 1441–1448, 2002.
- K. Laghmari, C. Marsala, and M. Ramdani, “An adapted incremental graded multi-label classification model for recommendation systems,” Prog. Artif. Intell., vol. 7, no. 1, pp. 15–29, 2018.
- “Duine Framework - Recommender Software Toolkit.” [Online]. Available: http://www.duineframework.org/. [Accessed: 23-Feb-2019].
- “Cofi: A Java-Based Collaborative Filtering Library.” [Online]. Available: http://www.nongnu.org/cofi/. [Accessed: 10-Feb-2019].
- “easyrec : open source recommendation engine.” [Online]. Available: http://www.easyrec.org/. [Accessed: 23-Feb-2019].
- J. Lee, M. Sun, and G. Lebanon, “PREA : Personalized Recommendation Algorithms Toolkit,” J. Mach. Learn. Res., vol. 13, pp. 2699–2703, 2012.
- Z. S. and N. Y.-S. Guibing Guo, Jie Zhang, “LibRec: A Java Library for Recommender Systems,” Proc. 23rd Conf. User Model. Adapt. Pers., vol. 2, pp. 2–5, 2015.
- S. Schelter and S. Owen, “Collaborative Filtering with Apache Mahout,” Recomm. Syst. Chall. ACM RecSys, vol. I, 2012.
- C. E. Seminario and D. C. Wilson, “Case study evaluation of mahout as a recommender platform,” CEUR Workshop Proc., vol. 910, no. Rue, pp. 45–50, 2012.
- M. D. Ekstrand, M. Ludwig, J. A. Konstan, and J. T. Riedl, “Rethinking the Recommender Research Ecosystem : Categories and Subject Descriptors,” Proc. 5th ACM Conf. Recomm. Syst. - RecSys ’11, pp. 133–140, 2011.
- F. Ortega, B. Zhu, J. Bobadilla, and A. Hernando, “CF4J: Collaborative filtering for Java,” Knowledge-Based Syst., vol. 152, pp. 94–99, 2018.
- D. Goldberg, D. Nichols, B. M. Oki, and D. Terry, “Using collaborative filtering to weave an information tapestry,” Commun. ACM, vol. 35, no. 12, pp. 61–70, 1992.
- J. L. Herlocker, J. A. Konstan, A. Borchers, and J. Riedl, “An algorithmic framework for performing collaborative filtering,” in Proceedings of the 22nd annual international ACM SIGIR conference on Research and development in information retrieval - SIGIR ’99, 1999, pp. 230–237.
- J. O. N. Herlocker and J. Riedl, “An Empirical Analysis of Design Choices in Neighborhood-Based Collaborative Filtering Algorithms,” Inf. Retr. Boston., pp. 287–310, 2002.
- “Duine Framework - Recommender Software Toolkit.” [Online]. Available: http://www.duineframework.org/. [Accessed: 10-Feb-2019].
- “easyrec :: open source recommendation engine.” [Online]. Available: http://easyrec.org/home. [Accessed: 10-Feb-2019].
- Y. Koren, R. Bell, and C. Volinsky, “Matrix factorization techniques for recommender systems,” Computer (Long. Beach. Calif)., no. 8, pp. 30–37, 2009.
- A. Hernando, J. Bobadilla, and F. Ortega, “A Non-Negative Matrix Factorization for Collaborative Filtering Recommender Systems Based on a Bayesian Probabilistic Model,” Know.-Based Syst., vol. 97, no. C, pp. 188–202, Apr. 2016.
- P. Resnick, N. Iacovou, M. Suchak, P. Bergstrom, and J. Riedl, “GroupLens : An Open Architecture for Collaborative Filtering of Netnews,” in Proceedings of the 1994 ACM conference on Computer supported cooperative work, 1994, pp. 175–186.
- J. A. Konstan, B. N. Miller, D. Maltz, J. L. Herlocker, L. R. Gordon, and J. Riedl, “GroupLens: applying collaborative filtering to Usenet news,” Commun. ACM, vol. 40, no. 3, pp. 77–87, 1997.
- B. Sarwar, G. Karypis, J. Konstan, and J. Reidl, “Item-based collaborative filtering recommendation algorithms,” Proc. tenth Int. Conf. World Wide Web - WWW ’01, pp. 285–295, 2001.
- P. Jaccard, “Distribution comparée de la flore alpine dans quelques régions des Alpes occidentales et orientales,” Bull. la Socit Vaudoise des Sci. Nat., vol. 37, pp. 241–272, 1901.
- J. Bobadilla, F. Serradilla, and J. Bernal, “A new collaborative filtering metric that improves the behavior of recommender systems,” Knowledge-Based Syst., vol. 23, no. 6, pp. 520–528, 2010.
- J. Bobadilla, F. Ortega, A. Hernando, and Á. Arroyo, “A balanced memory-based collaborative filtering similarity measure,” Int. J. Intell. Syst., vol. 27, no. 10, pp. 939–946, Oct. 2012.
- J. Bobadilla, F. Ortega, and A. Hernando, “A collaborative filtering similarity measure based on singularities,” Inf. Process. Manag., vol. 48, no. 2, pp. 204–217, 2012.
- H. J. Ahn, “A new similarity measure for collaborative filtering to alleviate the new user cold-starting problem,” Inf. Sci. (Ny)., vol. 178, no. 1, pp. 37–51, 2008.
- L. R. Dice, “Measures of the amount of ecologic association between species,” Ecology, vol. 26, no. 3, pp. 297–302, 1945.
- M. G. Kendall, “A new measure of rank correlation,” Biometrika, vol. 30, no. 1/2, pp. 81–93, 1938.
- T. M. Cover and J. A. Thomas, Elements of information theory, Wiley. Wiley-Interscience, 2006.
- J. L. Herlocker, J. A. Konstan, L. G. Terveen, and J. T. Riedl, “Evaluating collaborative filtering recommender systems,” ACM Trans. Inf. Syst., vol. 22, no. 1, pp. 5–53, 2004.
- “MovieLens | GroupLens.” [Online]. Available: https://grouplens.org/datasets/movielens/. [Accessed: 22-Dec-2018].
- F. M. Harper and J. A. Konstan, “The MovieLens Datasets,” ACM Trans. Interact. Intell. Syst., vol. 5, no. 4, pp. 1–19, 2015.
- A. Gunawardana and G. Shani, “A survey of accuracy evaluation metrics of recommendation tasks,” J. Mach. Learn. Res., vol. 10, pp. 2935–2962, 2009.
- G. Carenini and R. Sharma, “Exploring More Realistic Evaluation Measures for Collaborative Filtering,” in Proceedings of the 19th National Conference on Artifical Intelligence, 2004, pp. 749–754.
- T. Chai and R. R. Draxler, “Root mean square error (RMSE) or mean absolute error (MAE)? -Arguments against avoiding RMSE in the literature,” Geosci. Model Dev., vol. 7, no. 3, pp. 1247–1250, 2014.
