Adaptive Clustering Method for Panel Data Based on Multi-dimensional Feature Extraction

Author: Xiqin Ao, Mideth Abisado
Journal: International Journal of Modern Education and Computer Science @ijmecs
Article in issue: 1 vol.17, 2025.
Free access
Aiming at the problems of large information loss and feature loss in the similarity design of high-dimensional panel data in clustering, a new panel data clustering method was proposed, which named an adaptive clustering method for panel data based on multi-dimensional feature extraction. This method defined "comprehensive quantity", "absolute quantity", "growth rate", "general trend" and "fluctuation quantity" of samples to extract features, and the five features were weighted to calculate the samples comprehensive distance. On this basis, ward method is used for clustering. This method can greatly reduces the loss of effective information. To verify the effectiveness of the method, cluster empirical analysis was conducted using GDP panel data from 31 regions in China, and the clustering results were compared with those of other clustering models. The experimental results showed that the proposed model was more interpretable and the clustering results were better.
Computer Science and Technology, Machine Learning, Clustering Method, Feature Extraction, Panel Data
Short address: https://sciup.org/15019686
IDR: 15019686 | DOI: 10.5815/ijmecs.2025.01.04
Text of the scientific article Adaptive Clustering Method for Panel Data Based on Multi-dimensional Feature Extraction
Clustering is an unsupervised clustering of similar samples according to a certain similarity measure using clustering algorithm. As an unsupervised machine learning, it has the advantage of not requiring labels and having a small sample demand. Cluster analysis has also been applied as a fundamental machine learning method to various corners of computer science, and has also been widely applied in various fields such as medicine, biology, economics, etc[1,2].Traditional clustering algorithms have successfully solved the problem of clustering cross-section data, but due to the complexity of data in practical applications, traditional clustering methods of cross-section data can not fully reflect the affinity and disaffinity between samples, and the existing algorithms often fail to deal with many problems, especially for panel data[3]. Panel data is a three-dimensional data that includes sample dimension, indicator dimension, and time series dimension, also known as time series cross-sectional data[4]. It not only has the characteristics of crosssectional data, but also reflects the information of the sample in the time dimension, that is, the dynamic fluctuation characteristics and development trends of indicators in the time dimension, which makes panel data contain more information, Therefore, panel data clustering analysis has become an important research direction in clustering analysis. The significance of studying panel data clustering methods in the field of machine learning and data science lies in its ability to help solve problems such as data mining, pattern recognition, classification, and prediction, and improve the efficiency and accuracy of data mining. Panel data clustering methods can cluster data points with similar characteristics together, thereby better understanding the structure and characteristics of the data and providing a foundation for subsequent data analysis and modeling.
The challenges faced by panel data clustering methods mainly include the following aspects[5,6,7,8,9]: (1) Data dimension problem: In panel data, there are usually a large number of features or indicators, that is, the data dimension is relatively high. High-dimensional data clustering not only has a large amount of calculation, but also may lead to the curse of dimensionality, which means that as the dimension increases, the sparsity of data and the difficulty of distance calculation will increase, thereby affecting the clustering effect. (2) Data dynamism: Panel data usually has time series characteristics, that is, data changes over time. This dynamism places higher requirements on clustering algorithms, which need to be able to capture the dynamic changes in data to obtain more accurate clustering results. (3) Selection of clustering algorithm: For panel data, it is necessary to select an appropriate clustering algorithm. Different clustering algorithms have different adaptability to data, and it is necessary to select an appropriate algorithm according to the characteristics of the data and the needs of clustering. To address these challenges, the research hotspots of panel data mainly include two aspects: 1) How to select an appropriate similarity measure when calculating the distance in clustering to comprehensively and correctly represent the information contained in panel data, considering its multidimensional and dynamic characteristics.2) Based on the data obtained from similarity, which suitable clustering algorithm can be selected to better meet our expectations and achieve the optimal solution. Scholars have proposed various improvement methods and strategies. Li Yingguo, Dai Yi et al. (2013)[10] designed a new comprehensive distance function based on the absolute distance, growth rate distance and variation coefficient distance of panel data, and proposed an adaptive weight clustering method for panel data using Ward clustering algorithm. Dang Yaoguo, Hou Diqing (2016) [11] designed the characteristics of absolute quantity, fluctuation, skewness, kurtosis and trend, and proposed a dynamic clustering method for multi indicator Panel data on this basis, which greatly reduced the information loss of the time dimension, but lacked consideration of the indicator dimension. Zhang Lijun and Peng Hao (2017) [12] improved the Euclidean distance and considered the issue of indicator weight and time weight, using examples to prove the effectiveness of the existence of indicator weight and time weight. Dai Dayang, Deng Guangming (2018)[13] used principal component analysis to eliminate the problem of information overlap in literature [11], then used entropy weight method to obtain the weight of features, and conducted experimental analysis on real estate data, showing that the clustering results were better. Wang Zedong and Deng Guangming (2019)[14] introduced the concept of trend distance, calculated the principal component scores at each time point by using principal component analysis, and constructed a comprehensive distance that reflected the dynamic changes of data. Liu Bing and Zheng Chengli (2022)[15] used entropy weight method to objectively assign weights to solve the problem of the lack of adaptability of wavelet theory, and then constructed a hierarchical clustering algorithm based on weighted cosine, which greatly improved the accuracy rate.
Although the existing panel data clustering methods can have good clustering effect to some extent, there are still problems of information loss and feature loss in the similarity design of clustering. Based on the existing research results, this study proposes an adaptive clustering method for panel data based on multi-dimensional feature extraction to further improve the clustering results. This method first standardizes the original data, then calculates the comprehensive quantity characteristics, absolute quantity characteristics, growth rate characteristics, general trend characteristics, and fluctuation quantity characteristics respectively, then calculates the distance for the characteristics of different samples according to the definition, weights the calculated distance to obtain the final comprehensive distance, and finally clusters with Ward method to obtain the clustering result.
2. Format and Features of Panel Data 2.1 Multi-indicator panel data
From the cross section, the multi-indicator panel data is the cross section observation value composed of several individuals at a certain time, and from the vertical plane, it is a set of time series, which contains each data point can be represented by three subscript variables, as X^t), i=1 , 2 , ^ , N , k=1 , 2 , ..., P , t=1 , 2 , ..., T. N represents the number of individuals contained in the panel data; P represents the total number of indicator variables; T represents the maximum length of the time series[16,17]. Strictly speaking, multi indicator panel data should be represented in the form of a spatial three-dimensional table. However, considering that panel data is composed of multiple indicators of different individuals that change over time, this study expands multi indicator panel data from the individual dimension into a secondary matrix on a plane, with a focus on designing statistical measures for panel data from the time dimension.
The sample population X can be represented as a matrix [X 1 …X i …X N ]T, Among them, the matrix of a sample Xi in the population is expressed as:
|
'X^i) |
X i2 (1) • |
- X f (1)l |
|
|
X i = |
X I (2) |
X i2 (2) • |
- X i (2) |
|
X 1 (T) |
X 2 (T) ■ |
• X^T) |
And the k-th indicator X of the i-th sample X ^ is also a time series as X f = [X -^ (V),^ ,X^(t),^ ,X] ^ (T'y\, in which 1 < i < N, 1 < к < P, X^t) represents the numerical value of the i-th sample and k-th indicator at time t.
-
2.2 Features of multi-indicator panel data
Multi-indicator panel data can not only reflect the absolute level of indicator development in a certain period, but also reflect the development trend and fluctuation degree of the objects described in a period of time. These characteristics determine that the spatial and temporal characteristics of multi-index panel data should be considered comprehensively when cluster analysis is carried out[18]. The spatio-temporal characteristics of multi-indicator panel data include at least the following four aspects of information:
(1) the absolute level of indicator development in a certain period;
(2) the change in the growth of an indicator for a particular individual, that is, the trend;
(3) the fluctuation or fluctuation of an indicator for a particular individual;
(4) Distribution characteristics of an indicator for a specific individual.
3. Feature extraction of panel data
3.1 Standardized of panel data3.2 Distance definition based on feature extraction
Although the incremental changes of panel data have been discussed to some extent in existing literature, the dynamic changes of panel data have not been deeply explored, and the calculation amount is extremely heavy, which weakens the practicability of the method[19,20]. In addition, Euclidean distance is used to describe the similarity between panel data in most of the past literatures, but Euclidean distance has inherent defects in processing data with time series.
In this study, , = 1,2,…N ; = 1,2,…M , = 1,2,…T, represents the k-th indicator of the i-th sample at time point t. represents the distance between sample i and sample j. represents the minimum sample data value under the k-th indicator. Represents the maximum sample data value under the k-th indicator.
The clustering method proposed in this study requires a standardized transformation of the original data before use. The standardized transformation formula is as follows:
zx ikt -min k max k -min k
Formula (1) is used to convert each original data zX i kt into a standardized X i kt, the value of X i kt is between 0 and 1. Data standardization eliminates the impact of dimensionality difference between different indicators on subsequent data calculation, and avoids a large number of dimensionality index data covering the data of small dimensionality index, which makes the data of small dimensionality index meaningless.
Definition 1: Total Quantity Euclidean Distance, Abbreviated as: zd ij (TAED)
zd ij CTAED) = [X l=i (Zk =i хм xwk- Xk =i xik t x wk) 2 ] 2 (2)
zd ij (TAED') describes the integrated numerical distance between sample i and sample j over the entire period T. In the formula, wk is the weight of the k-th indicator, which reflects the importance and value difference between indicators in the indicator dimension of panel data. There are various ways to obtain the weight wk, Common methods for obtaining weights include AHP, entropy weight method, information weight, principal component analysis, factor analysis, etc[21]. Commonly E M-1 w k = 1 ■ This study, the entropy weight method is used to obtain the weight[22].
Definition 2: Absolute Quantity Euclidean Distance, Abbreviated as: zd ij (AQED)
zdU(AQED) = [ Хк =1 X l=i (xi kt - x jkt ) x w k ] (3)
zd ij (AQED) describes the absolute distance between sample i and sample j in the period t, reflecting the distance between the two samples in each period under each indicator. wk here has the same meaning as wk in definition 1. zdi j (AQED) is an optimization of multi-dimensional Euclidean distance formula, which can also be replaced by Mahalanobis distance and Langmuir distance.
zdij(TAED') and zdij(AQED~) are to reflect the absolute difference between two data samples, that is, the difference of data values. The two definitions complement and coordinate each other for the same purpose. If only definition 1 is used instead of definition 2, there will be a problem of decreasing sample differences, focusing only on the distance between sample i at time point t and the total amount of sample j at time point t, without paying attention to the differences between the two samples in the indicator dimension; Also it is not advisable to only use definition 2 without Definition 1, as this will increase sample diversity and overly focus on the data differences between different time periods in the indicator dimension, neglecting the distance between the overall strength of the sample. So these two definitions are inseparable and complementary.
Definition 3: Increment Speed Euclidean Distance, Abbreviated as: zd ij (ISED')
zd^ISED) = Ь'Х {Л' /-' I ^'J
[ X x lkt-1 x jkt-1/ J
In the formula, /X / kt = X / kt — X / kt—1, /X j kt = X j kt — X j kt—1, /X / kt represents the absolute difference between two adjacent time points under the same sample and indicator. /X j kt is the same. wt is the weight of the t-th time point in the time dimension, wt considers that even as a time dimension, there are differences in the importance of time points, and it can also handle fluctuations in time series. If the importance of data varies at different time points, different values can be assigned to wt . The way to obtain the wt value is similar to the way to obtain the wk value.
zd ij (ISED') describes the degree of difference in sample changes between sample i and sample j at adjacent time points. If the growth trend of two samples shows the same direction at the same adjacent time point, then the zd ij (ISED') of the two samples is smaller. If the growth trend of two samples at the same adjacent time point is opposite, then the zd ij (ISED) of the two samples is larger.
Definition 4: General Trend Euclidean Distance, Abbreviated as: zd ij (GTED')
cos^
у t /xikt x/xj-'
__lMxk'- x jk-fc
U ( /xikt \\ ( /xjkt ) 2
J ' 2\xlkt-1) J ' 2\xjkt-1
zdij(GTED)
Yk = 1cos(e k )
The meanings of /X [ kt and wt are the same as those in Definition 3. cos(dk) describes the similarity of the overall growth trend of sample i and sample j over the entire period T under the k-th indicator. The value range of cos(dk) is [0,1], and the closer its value is to 1, the closer the overall trend of sample i and sample j is to the k-th indicator. The closer its value is to 0, the farther the overall trend of sample i and sample j is to the k-th indicator. zd ij (GTED') describes the similarity of the overall growth trends of sample i and sample j over the entire period T under various indicators. The value range of zd ij (GTED') is [“,+“], the larger the value, the smaller similarity and the larger distance between the two samples. This definition is inspired by the classical similarity measure "cosine similarity" in concept.
Definition 5: Undulation Extent Euclidean Distance, Abbreviated as: d /j (UEED')
zd ij (UEED) = [xVUS ik — S jk ) x w k ]
In the formula, S /k = I^ZLi CX ikt
\ 1—1
—
X^)2, X[k = 1lt=iXikt, wk is the indicator weight. X/k represents the mean of the k-th indicator of sample i over the total time T. S/k represents the standard deviation of the k-th indicator of sample i over the total time T. zdij(UEED') describes the distance between sample i and sample j under different indicators. The difference in undulation extent Euclidean distance between two samples is significant, and the less similar the undulation extent Euclidean distance between the two samples, the greater the zdij(UEED) value.
Definition 6: Weighted Synthesis Euclidean Distance, Abbreviated as: d /j (WSED')
dij(WSED) = w 1 • dij(TAED) + w2 • dij(AQED) + w3 • dij(ISED) + w4 • dij(GTED) + w5 • d^UEED) (8)
In the formula, w 1 + w2 + w3 + w4 + w5 = 1, di j (TAED'), di j (AQED),di j (ISED),di j (GTED) and d ij (UEED) are the distance values of zd ij (TAED'),zd ij (AQED') , zd ij (ISED'),zd ij (GTED') and zd ij (UEED) after standardized transformation. The standardized transformation formula is as follows:
dij(TAED)
zdl j (TAED)—mindl j (TAED) maxdl j (TAED)—mindl j (TAED)
In the formula,maxd ij (TAED) is the maximum value in d ij (TAED), mind ij (TAED) is the minimum value in d ij (TAED) Other distance formulas are normalized in the same way. The purpose of the second standardization is to ensure that each distance formula is meaningful and avoid the impact of dimensional differences between distance formulas. The purpose of weighting is to reflect the importance difference between distance formulas. The method of obtaining the weight of w is also similar to wk and wt .
4. Clustering Method and Experimental Procedure 4.1 Clustering method
Hierarchical clustering is one of the classical clustering methods. Hierarchical clustering is to divide each sample or individual into a class, and then cluster two classes into a new class each time until all the classes are clustered into a class[23,24]. The algorithm steps are as follows:
Step 1: Classify each sample or individual into a category;
Step 2: Calculate the distance between each class and the others;
Step 3: Merge the two nearest classes into a new class;
Step 4: Repeat steps (2) and (3) until you merge into one class.
Different Hierarchical clustering algorithms are generated due to different definitions of the distance between classes[25,26]. There are mainly "Ward method", "single linkage method", "full linkage method", "average linkage method" and "centroid method", etc[27,28]. The Ward method in Hierarchical clustering is chosen in this study.
The Ward method [29]defines the distance by the difference IAB in the sum of squared variances within two classes before and after merging, IAB = SSEAB — (SSEA + SSEB) AB is the class after merging A and B. The sum of squares of variance within the class before and after the merge is as follows:
ssea = Т.^! Xt -1 №=1 xtfxi e A(1
SSEB^^yl—lW^ytfyiEB(11)
SSEab = £$ xy^ —1 (Z^ xytfxyi e AB(12)
In the formula, nA and nB represents the number of samples are in class A and class B, nAB represents the number of samples in the merged class of class A and class B, nAB = nA + nB , SSEA and SSEA represents the sum of squares of variance within Class A and Class B, SSEAB represents the sum of squares of variance within AB classes after merging A and B classes. The two classes merged by Ward method should make the value of SSEAB — (SSEA + SSEB~) is the smallest, that is, the value of IAB is the smallest. The distance in hierarchical clustering calculated by these formulas is Ward clustering.
-
4.2 Experimental Procedure
The panel data adaptive clustering method based on multi-dimensional feature extraction proposed in this study is based on Ward method in hierarchical clustering, and the similarity index of clustering is redesigned and defined. The experimental steps of the method are shown in Figure 1.
(1) Standardize the raw data;
(2) Extract five features of the data by calculating the distance of "total quantity", "absolute quantity", "growth rate", "overall trend", and "volatility", respectively;
(3) Perform secondary standardization on the obtained distance data;
(4) Assign weights to each of the 5 distances and calculate the weighted composite distance;
(5) Divide each sample into one category, calculate the ESS distance between each category, merge the two classes with the smallest ESS, and repeat the process until all samples belong to one category.
4.3 Method evaluation index
The Silhouette Coefficient was proposed by Peter J. Rousseeuw in 1986[30,31]. It is a commonly used evaluation method that reflects the quality of clustering results. Abbreviated as:SC.
5. Empirical Analysis
5.1 Data Set
S(i) = ьт-ащ (13)
max(a(i),b(i))
SC = ^Z^i) (14)
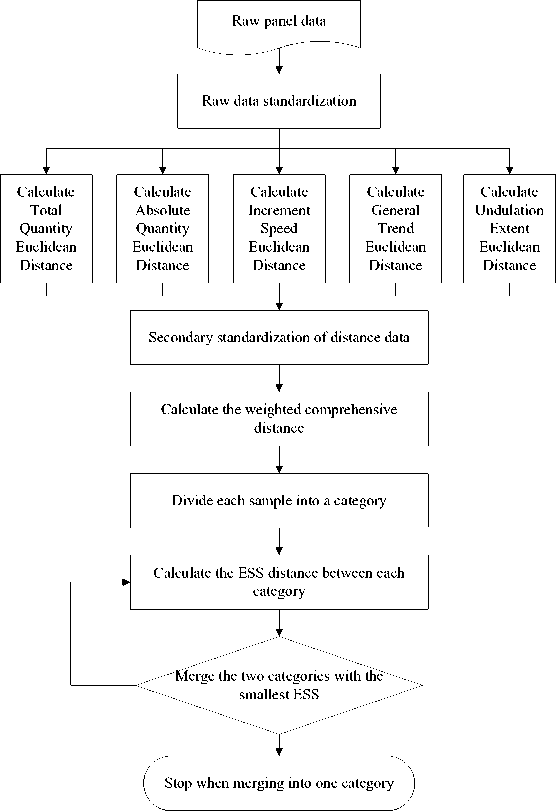
Fig. 1. Steps of panel data clustering method
Where i is a sample point, a(i) is the average distance between sample points and other points in the same class as the degree of dissimilarity within the class, and b(i) is the minimum average distance between sample points and other classes as the degree of dissimilarity between classes. The value range of silhouette coefficient is [-1,1]. The closer the value is to 1, the smaller the distance between classes, the larger the distance between different classes, and the better the clustering result. Conversely, the closer the value is to -1, the worse the clustering result will be.
The data in this study are from the multidimensional Panel data of GDP categories of 31 regions from 2012 to 2021 released by the National Bureau of Statistics[32]. The data involves 13 indicators, namely: Primary sector of the economy added value, Secondary sector of the economy added value, Tertiary sector of the economy added value, agriculture, forestry, animal husbandry and fishery added value, industrial added value, construction added value, wholesale and retail added value, transportation, warehousing and postal added value, financial added value, real estate added value, other industries added value, per capita Gross regional product, etc. The data is shown in the figure. This article uses Python and R programming environments to implement the proposed algorithm and experimental process. Partial data is shown in in table 1.
Table 1. Partial dataset
|
Region&Ye ar |
Indicator 1 |
Indicator 2 |
Indicator 3 |
|||||||||
|
2014 |
2015 |
2016 |
.... .. |
2014 |
2015 |
2016 |
...... |
2014 |
2015 |
2016 |
... |
|
|
Bejjing |
159.2 |
140.4 |
129.8 |
... |
4433 |
4419.8 |
4665.8 |
... |
18333.9 |
20218.9 |
22245.7 |
... |
|
Tianjin |
158.8 |
162.3 |
168.5 |
... |
4615.5 |
4489.6 |
4368 |
... |
5866.3 |
6227.6 |
6940.8 |
... |
|
Hebei |
3164.7 |
3100.5 |
3082.5 |
... |
11476.9 |
11519.5 |
12332.3 |
... |
10567.3 |
11778.4 |
13059.3 |
... |
|
Shanxi |
736.6 |
726.2 |
724.3 |
... |
6378 |
5219.7 |
5113.6 |
... |
4980.1 |
5890.5 |
6108.5 |
... |
|
Neimenggu |
1638 |
1630.2 |
1650.6 |
... |
5114.4 |
5269.5 |
5579.8 |
... |
5405.8 |
6049.2 |
6558.9 |
... |
|
Liaoning |
2002 |
2053.7 |
1841.2 |
... |
9038.8 |
8344.6 |
7865.7 |
... |
8984.9 |
9811.9 |
10685.6 |
... |
|
Jilin |
1270.2 |
1270.6 |
1130.1 |
... |
3901.4 |
3837.8 |
3901.4 |
... |
4891.5 |
4909.6 |
5395.5 |
... |
|
Heilongjian g |
2691 |
2712.2 |
2751.2 |
... |
3689.7 |
3926.9 |
3689.7 |
... |
4607.4 |
5050.9 |
5454 |
... |
|
Shanghai |
132 |
125.5 |
114.3 |
... |
8570.2 |
8408.7 |
8570.2 |
... |
16504.5 |
18352.8 |
21202.4 |
... |
|
Jiangsu |
3607.4 |
3952.5 |
4039.8 |
... |
35041.5 |
33371.8 |
35041.5 |
... |
30174.3 |
33931.7 |
38269.6 |
... |
|
... |
... |
... |
... |
... |
... |
... |
... |
... |
... |
... |
... |
... |
5.2 Calculated Distance
6. Results and Discussion
6.1 Results
After standardizing the GDP data of 13 indicators in 31 regions over the past 10 years, calculate the five distances defined above, and then use the entropy weight method to obtain the distance weights. Finally, the comprehensive distance is obtained by weighted summation of the five distances. The calculated distance weights are shown in table 2.
Table 2. Distance weights
|
distance |
dtJ(TAED) |
d ij (TQED) |
dtJ(ISED) |
diJ(GTED) |
diJ(UEED) |
|
weight |
0.340 0 |
0.268 5 |
0.146 9 |
0.144 1 |
0.107 0 |
Calculate the comprehensive d tj (WSED') by weighting the five defined distances , d tj (WSED') combines the "absolute quantity", "comprehensive quantity", "growth rate", "overall trend", and "volatility" together. The comprehensive distance fully considers the differences between indicators, the differences in time series development trends, and the degree of sample fluctuation differences of the samples. The comprehensive distance matrix of some cities is shown in table 3.
Table 3. Comprehensive distance matrix of some cities
|
Region |
Beijing |
Tianjing |
Hebei |
Liaoning |
|
Beijing |
0 |
0.434 |
0.457 |
0.432 |
|
Hebei |
0.457 |
0.400 |
0 |
0.340 |
|
Jilin |
0.447 |
0.275 |
0.359 |
0.291 |
|
Liaoning |
0.432 |
0.322 |
0.341 |
0 |
On the basis of obtaining the comprehensive distance of each city, Ward clustering method is used for clustering, and the clustering results of each city are shown in Figure 2.
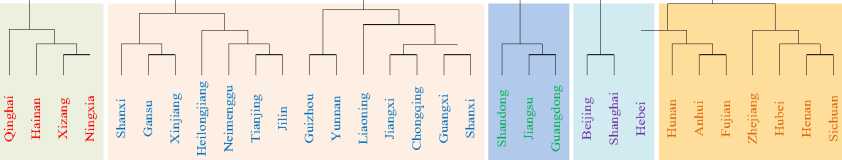
Fig. 2. Adaptive clustering results based on multidimensional feature extraction
According to the clustering results in Fig 2, the 31 regions are divided into five categories based on the similarity of 13 economic indicators. Beijing and Shanghai are grouped together, and these two regions belong to China's first tier cities with the highest level of economic development; Shandong, Jiangsu, and Guangzhou are grouped together, most of which are coastal provinces and cities with relatively developed economies; Hebei, Hunan, Anhui and other regions are grouped together, with most of these provinces and cities being inland cities with economic strength at the national average level; Shanxi, Gansu, Yunnan and other regions are grouped together, with more provinces and cities in this category, most of which are located in western China, and the level of economic development is slightly lower than the national average; Regions such as Qinghai and Hainan are grouped together, with more ethnic minorities and relatively low levels of economic development. The clustering results are consistent with the actual economic level in China, indicating that the method proposed in this study has certain application value.
-
6.2 Comparison of Panel data Clustering Models
In order to verify the effectiveness of the panel data adaptive clustering method based on multi-dimensional feature extraction proposed in this paper, a comparison experiment was conducted between the method and the clustering method based on Euclidean-style distance, the clustering method based on feature extraction and the clustering method based on adaptive weight. The difference between these methods mainly lies in the different measurement methods of similarity between samples, and different distance calculation methods were defined.
-
(1) Clustering based on Euclidean distance (ED)
This method uses Euclidean distance to measure the similarity between samples, which is a classical distance method.
-
(2) Clustering based on feature extraction (FD)
The method defines the characteristics of "absolute quantity", "fluctuation", "skewness", "kurtosis" and "trend" of samples. Then the above five features are standardized, and the five features are weighted to get the feature vector of the sample. Finally, clustering is carried out according to the feature vector.
-
(3) Clustering method based on adaptive weights (AW)
This method defines the "absolute" distance, "growth rate" distance and "fluctuation" distance of samples, and fully considers the numerical difference between samples, the growth trend and fluctuation degree in time series. Then the entropy weight method is used to automatically determine the weights of the three distance functions and get the "comprehensive" distance, which is used to measure the similarity of samples. Then clustering is carried out.
The silhouette coefficients of the four methods are calculated as shown in Table 4, and the clustering results are shown in Figures 3 to 5.
Table 4. Silhouette coefficients of the four clustering methods methods ED FD AW Method Proposed
SC 0.258 5 0.442 3 0.482 3 0.603 7
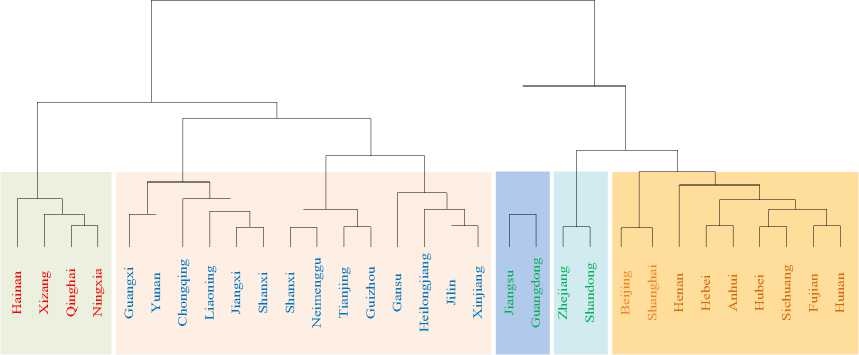
Fig. 3. Clustering based on Euclidean distance
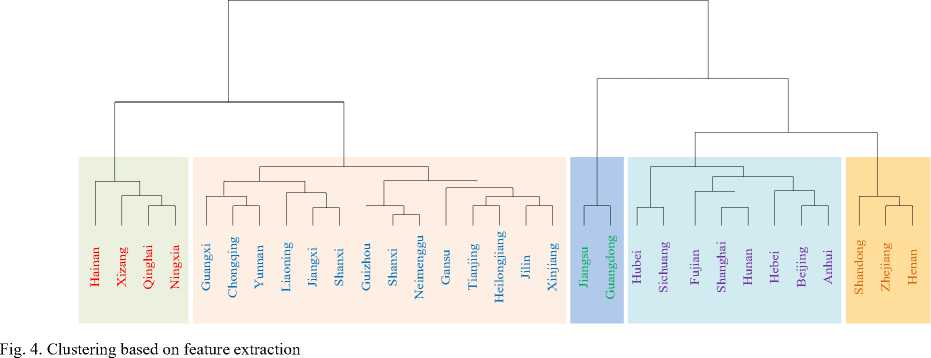
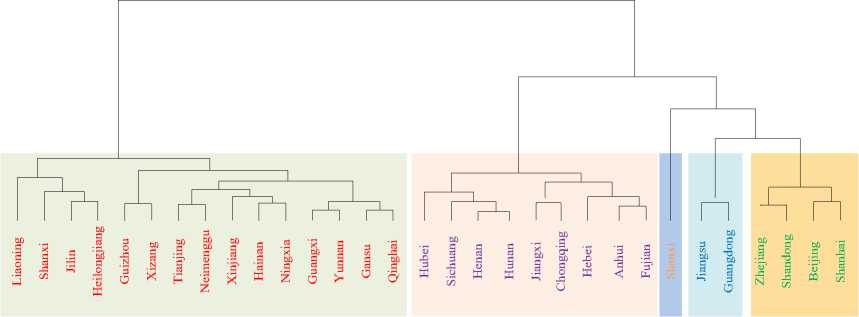
Fig. 5. Adaptive clustering method based on multidimensional feature extraction
According to the silhouette coefficient, the contour coefficient value of the Panel data adaptive model for multidimensional feature extraction proposed in this study is 0.6037. Compared with the other three methods, the clustering effect is significantly improved. From the clustering results, the results of clustering are also more consistent with the actual situation, which also shows that the model proposed in this study is more suitable for clustering Panel data.
Next, the clustering model based on adaptive weights with high profile coefficients and the clustering results of the model proposed in this study will be explained and analyzed. Based on the clustering results in figures 5 and 6, when the number of clustering categories is set as 5, the clustering results are shown in tables 5 and 6.
Table 5. Clustering results based on adaptive weights category Region
I Shanxi
П Jiangsu, Guangdong
Ш Zhejiang, Shandong, Beijing, Shanghai
IV Hubei, Sichuang, Henan, Hunan, Jiangxi, Chongqing, Hebei, Anhui, Fujian
V Liaoning, Shanxi, Jilin, Heilongjiang, Guizhou, Xizang, Tianjing, Neimenggu, Xinjiang, Hainan, Ningxia, Guangxi, Yunnan, Gansu,
Qingai
Table 6. Adaptive clustering results based on multidimensional feature extraction category Region
_________I______________________________________________________ Shandong, Jiangsu, Guangdong _________________________________________ _________П________________________________________________________________ Beijing, Shanghai ___________________________________________________
________ Ш _______________________________________ Hebei, Hunan, Anhui, Fujian, Zhejiang, Hubei, Henan, Sichuang __________________________
V Shanxi, Gansu, Xinjiang, Heilongjiang, Neimenggu, Tianjing, Jilin, Guizhou, Yunnan, Liaoning, Jiangxi, Chongqing,
Guangxi, Shanxi
V Qinghai, Hunan, Xizang, Ningxia
In the clustering model based on adaptive weights, Shaanxi Province is combined with the second and third categories as a single category. It can be seen that the second and third categories are provinces and cities with high GDP and fast growth rate. Shanxi Province is grouped together with these two categories, the explanation is not strong, does not conform to the actual life experience. The adaptive model for multidimensional feature extraction proposed in this study clusters Shandong, Jiangsu, and Guangdong provinces with fast GDP growth and high GDP into one category. Two rapidly developing regions, Beijing and Shanghai, converge into one category. In the third category, most of them are regions with less rapid development and the GDP is higher but not as high as the first category. The clustering results are closer to life experience, easier to explain, and more in line with the requirements of close within the class, far between the classes.
6.3 Method Application Expansion
To verify the clustering effect of this method on other datasets, the application field of the method was expanded, and air quality data in the environmental field was introduced as an experimental dataset. This dataset comes from an air quality monitoring website, containing air quality data for 12 months of 2023 in 31 cities in China. The data involves seven indicators, namely: AQI, PM2.5, PM10, CO, NO2, SO2, and O3. The same experimental process was implemented for this dataset, and the results are shown in Table 7.
7. Conclusions
Table 7. Silhouette coefficients of the four clustering methods methods ED FD AW Method Proposed
SC 0.404 8 0.429 5 0.476 6 0.582 6
According to the silhouette coefficient, the silhouette coefficient value of the clustering method proposed in this study is 0.5826, which has a significant improvement in clustering effect compared with the other three methods. This indicates that this method also has a good clustering effect in other application fields.
Considering the three-dimensional characteristics of Panel data, this study extracted the "comprehensive quantity" feature, "absolute quantity" feature, "growth rate" feature, "general trend" feature, and "volatility" feature of sample data. On this basis, the "weighted comprehensive distance" was obtained by weighting the five features, and an adaptive model of multi-dimensional feature extraction for Panel data was proposed. The advantages of this model are as follows: The advantages of this model are as follows:
-
(1) Considering the difference in the importance of the Panel data indicator dimension and the time series dimension, the model is weighted during feature extraction.
-
(2) At the same time, considering multiple feature differences between samples, and avoiding the occurrence of one feature value being too large to "cover up" another feature.
-
(3) The experimental results show that the clustering results of this model are more explanatory, with greater intra class similarity and inter class distance, which better meet the clustering requirements.
The aspects worthy of further exploration in this study are summarized as follows:
-
(1) Taking into account the dynamism and complexity of the three-dimensional structure of panel data, the similarity statistics proposed in this paper from several perspectives cannot fully extract the valuable information implied in the data. Researchers can further design other similarity statistics.
-
(2) The systematic clustering method cannot control the number of clusters, and currently can only refer to the scree plot and the actual research background, which has great subjectivity. This issue is worth further discussion and research.
-
(3) Clustering, as an unsupervised learning process, currently lacks a mature and complete set of rules for evaluating clustering effectivenesss. Therefore, the research on clustering evaluation models is of great significance.
References Adaptive Clustering Method for Panel Data Based on Multi-dimensional Feature Extraction
- Pesaran, M. Hashem. Time series and panel data econometrics. Oxford University Press, 2015.
- Y Wang. An improved prediction model based on grey clustering analysis method and its application power load forecasting. International Journal of Control and Automation, no.8, pp.432-451, 2015.https://www.earticle.net/Article/A254637
- J Ren , S Shi. Multivariable Panel Data Ordinal Clustering and Its Application in Competitive Strategy Identification of Appliance-wiring Listed Companies. 2009 International Conference on Management Science and Engineering. IEEE, 2009. DOI: 10.1109/ICMSE.2009.5317442
- Y Chen , Z Zhang , X Song , et al. Coherent Clustering Method Based on Weighted Clustering of Multi-Indicator Panel Data. IEEE Access, 7, 43462-43472,2020.DOI: 10.1109/ACCESS.2019.2907270
- X M Li, K W Hipel, Y G Dang. An improved grey relational analysis approach for panel data clustering. Expert Systems with Applications, vol.42, no.23, pp.9105-9116, 2015. DOI:10.1016/j.eswa.2015.07.066
- S Aghabozorgi, S.A Seyed, Teh Y. Time-series clustering-A decade review. Information Systems, no.53, pp.16-38, 2015. DOI:10.1016/j.is.2015.04.007
- X Zhang , J Liu , Y Du , et al. A novel clustering method on time series data. Expert Systems with Application, vol.38, no.9, pp.11891-11900, 2011. DOI:10.1016/j.eswa.2011.03.081
- M.A. Juarez, M.F. Steel. Model-based clustering of non-Gaussian panel data based on skew-distributions. Journal of Business & Economics Statistics, vol.28, no.1, pp.52-66, 2010. DOI:10.1198/jbes.2009.07145
- H T Zhang, Z H Li, Y Sun, et al. New similarity measure method on time series. Computer Engineering & Design, 35(4) :1279-1284. DOI:10.16208/j.issn1000-7024.2014.04.032.
- Y G Li, Dai Y, X Q He. Panel data clustering method based on adaptive weight. System Engineering Theory and Practice, vol.33, no. 02, pp.388-395, 2013.
- Y G Dang, D Q Hou. Multi index Panel data clustering method based on feature extraction. Statistics and Decision, no.19, pp.68-72,2016. DOI:10.13546/j.cnki.tjyjc.2016.19.018.
- L J Zhang, H Peng. Research on weighted cluster analysis method of Panel data. Statistics and Information Forum, vol.32, no. 04, pp.21-26, 2017.
- D Y Dai, G M Deng. Clustering method of Panel data based on principal component feature extraction. Statistics and Decision, vol.34, no. 21, pp.72-76, 2018. DOI:10.13546/j.cnki.tjyjc.2018.21.017.
- Z D Wang, G M Deng. Discussion on Panel data clustering method based on trend distance. Statistics and Decision, vol.35, no. 08, pp.35-38, 2019. DOI:10.13546/j.cnki.tjyjc.2019.08.008.
- B Liu, C L Zheng. Adaptive clustering method for high-frequency Panel data based on EMD feature extraction. Statistics and Decision, vol.38, no. 10, pp.16-20, 2022. DOI:10.13546/j.cnki.tjyjc.2022.10.003.
- C Hsiao, C. Analysis of panel data (No. 64). Cambridge university press, 2022.
- A. Berrington, P. Smith and P. Sturgis. An overview of methods for the analysis of panel data, National Centre for Research Methods, School of Social Sciences, University of Southampton, 2006.
- M. Barandas, D. Folgado, L. Fernandes, S. Santos ,Abreu, M., Bota, P., & Gamboa, H. TSFEL: Time series feature extraction library. SoftwareX, 11, 100456,2020.
- B. K.Chandar, A. Hortaçsu, J. A. List, et al. Design and analysis of cluster-randomized field experiments in panel data settings. No. w26389. National Bureau of Economic Research, 2019. DOI:10.2139/ssrn.3473409
- V. Verdier. Estimation of Dynamic Panel Data Models with Cross‐Sectional Dependence: Using Cluster Dependence for Efficiency. Journal of Applied Econometrics, vol.31, no.1, pp. 85-105, 2016. DOI:10.1002/jae.2486
- A. Jaeger, D. Banks. Cluster analysis: A modern statistical review. Wiley Interdisciplinary Reviews: Computational Statistics, vol.15, no.3, e1597, 2023. DOI:10.1002/wics.1597.
- H P Zhang. Application on the entropy method for determination of weight of evaluating index in fuzzy mathematics for wine quality assessment. Advance Journal of Food Science and Technology, vol.7, no.3, pp. 195-198, 2015.
- R A Johnson , D W Wichern. Applied multivariate statistical analysis. New Jersey: Prentice Hall, 2013.
- J Abonyi, B Feil. Cluster Analysis for Data Mining and System Identification. Springer Science & Business Media, 2007.
- S. T. Wierzchoń, M. A. Kłopotek. Modern algorithms of cluster analysis .Vol. 34. Springer International Publishing, 2018.
- C. C. Aggarwal. "An introduction to cluster analysis." Data clustering. Chapman and Hall/CRC, 2018. 1-28.
- X C Zhang. Data Clustering. Beijing: Science Press, 2022.
- E. S. Dalmaijer, C. L. Nord, D. E. Astle. Statistical power for cluster analysis. BMC bioinformatics, vol.23, no.1, pp.1-28, 2022. DOI:10.1186/s12859-022-04675-1
- B S.Duran, L. Patrick Odell. Cluster analysis: a survey. Vol.100. Springer Science & Business Media, 2013.
- C Hennig, M Meila, F Murtagh, et al. Handbook of Cluster Analysis. Boca Ration: CRC Press, 2016.
- E. J. Bynen. Cluster analysis: Survey and evaluation of techniques .Vol. 1. Springer Science & Business Media, 2012.
- National Bureau of Statistics-China Statistical Yearbook, website: http://www.stats.gov.cn/sj/ndsj/
