Adaptive Image Enhancement Using Image Properties and Clustering

Author: Nithyananda C R, Ramachandra A C
Journal: International Journal of Image, Graphics and Signal Processing(IJIGSP) @ijigsp
Article in issue: 8 vol.8, 2016.
Free access
Image Enhancement is the method of improving the visibility of given image. Image Properties are used for the analysis of Quality of the given image. Various image Properties considered to improve the quality of the image. The Classification or grouping of images can be made by applying unsupervised image Classification algorithm. In our proposed method, various image properties are studied and an Adaptive K-means Clustering method is applied for Fractal image with Entropy Properties. The images are to enhanced on the basis of its grouping automatically. The resulted Classification can be acceptable by the user since the grouping is made on the type of the image i.e., Good Visible, Moderate and Blur images.
Image Enhancement, Image Property, Normalization, Image Classification
Short address: https://sciup.org/15014001
IDR: 15014001
Text of the scientific article Adaptive Image Enhancement Using Image Properties and Clustering
Published Online August 2016 in MECS DOI: 10.5815/ijigsp.2016.08.02
Image Enhancement is required in medical, defense, security, space borne and other applications where the quality of visibility of images are needed. Enhancement can be done by edge sharpening, reducing noise, gray level manipulation, magnifying, pseudo coloring etc.,. There is no single image enhancement algorithm which can enhance all type of images. Image enhancement is subjective. Image Properties are used to extract the quality of the given image. Each image contains its own properties.
Image Classification algorithms are used to group the similar quality images into separate clusters. The images with same quality are grouped into a common cluster. Unsupervised image classification reduces the burden of user interaction for image classification. K-means Clustering algorithm classify the images into cluster with or without user interaction. Adaptive image enhancement algorithm enhances the images without user interaction based on the quality of image which are obtained by image properties.
In this paper, Section II provides the Literature survey details for Image Features, Image Enhancement, Adaptive algorithms and Image Classification. Section III provides the proposed method for image Enhancement and Classification. Section IV represents the basic Image properties which can be extracted from any image. In Section V, the approach to implement the proposed method is briefly explained. Basic Image Properties are described in Section V. Section VI provides sample output values with input images. Section VII briefs about the Conclusion of the proposed method.
-
II. Related Works
Discrete Robert M Haralick et.al.,[1] introduced Textural features for gray tone spatial dependencies. Three different images namely Earth Resources Technology Satellite multi-special images, hotomicrograph images and panchromatic aerial photograph images are used. A Fast Algorithm to enhance Finger print images automatically was proposed by Lin Hong et. al., [2]. The algorithm identifies the corrupted ridges of online fingerprint system for verification. Un-coverable areas are removed and improve the minutiae extraction. Estimated orientation for valleys and ridges are implemented by partial valid regions.
J Alex Stark[3] proposed an Adaptive contrast enhancement of Image using Generalization of Histogram Equalization. Cumulative Function is used to generate gray level mapping. Different variety of enhancements are obtained by selecting alternative cumulative functions. Bei Tang et.al.,[4] proposed Enhancement of color Images by separating color data into brightness and Chromaticity. Authors represented n-dimensional vector in which magnitude indicates pixel brightness and vector’s direction for chromaticity. Authors also presented isotropic and anisotropic diffusion flows. Discrete Cosine Transform ( DCT ) based image contrast measure is presented in [5]. Image enhancement algorithm for compressed images such as MPEG2 , JPEG and H.261 is implemented. The proposed algorithm enhances the image in decompression stage and has low computational complexity.
The Curvelet Transform image enhancement is presented in [6]. Authors specify that the Curvelet Transform is suitable for multi-scale edge enhancement and represents edges better than wavelets. Authors also mention that the algorithm is not suitable for noiseless images. Zhou Wang et.al., [7] introduced Quality assessment based on Structural information of the image. Local luminance and contrast are used since these are independent of average Luminance and contrast of the image.
By the similarity information, cluster based image retrieval is proposed by Yixin Chen et.al.,[8]. Image retrieval is based on graph and Systematic Similarity Measure. Eun Kyung Yun et. al., [9] proposed an Adaptive Image Enhancement with image Quality Analysis for Fingerprint images. Authors considered four quality measures i.e., Mean, Variance, Block Directional Difference, Ridge Valley thickness ratio and Orientation change. Mean is used to measure the whole gray level, Variance for uniformity of gray values, Block Directional Difference for distinctness between ridges and valleys, Ridge Valley thickness for measurement of ratio for ridge and valley thickness Orientation change for measurement of ridge continuity.
Global kernel k-means algorithm is proposed in [10] in which one cluster is added at each stage. This algorithm does not require Cluster initialization and locates the optimal solutions with less computation. Automatic Registration based on Temporal change [11] detection and multisensors fusion was proposed by Anna Brook et. al.,. Speedup Robust Feature method is use do extract the buildings and roads of the input images. Topological Map matching Algorithm is applied to find the control points of Space borne and airborne images. Robustness and Feature complexity are compromised which are main parameters for deformations.
Hongzhao Yuan et. al., [12] proposed an enhancement of Infrared images by using Adaptive Contrast enhancement. Images are separated into ground and sky part with Enhanced Vision System. The Threshold is obtained by the intensity of sky part for Plateau HE. Then for the ground part, Adaptive Plateau HE is applied. M Z Rashad et.al., [13 ] proposed a classification of plant based on their textural properties by using Learning Vector Quantization and Radial Base function. Authors states that the classification of plant can be made by considering small part of the leaf. Le Hoang Thai et. al., [14 ] introduced a method to classify an image by combining Support Vector Machine (SVM) and Artificial Neural Network(ANN). Feature vector obtained by ANN is further classified by SVM Classifier.
Chun-Ming Tsai [15] proposed an adaptive local power law transformation method for enhancing color images with high performance and low computational complexity. The proposed method is very efficient method to compute the local mean with low complexity. Hongteng Xu et. al.,[16] introduced an image enhancement method by generalized equation model generated by integrating contrast enhancement and white balancing using Histograms. The algorithm is suitable for tone correction and de-hazed images post processing. Zhi Zhou et al., [17] introduced an adaptive image enhancement method to improve the signal-to-noise ratio of images based on detecting the salient features of fibrous structures. Authors have shown that 3D morphologies of neurons and brain vasculatures can be more accurately and efficiently reconstructed using their adaptive enhancement method.
Sundararajan and Karthikeyan [18] proposed a method to classify the images by combination of Dynamic K-means and Firefly Algorithm. The approach can be used for known number of clusters as well as unknown number of clusters. Reduction of dimensions with accurate feature extraction methods in k-means clustering is proposed by Christos Boutsidis et. al., [19]. Authors specify that the approach is based on low rank approximations to form a cluster.
-
III. Proposed Methodology
In the Proposed method, the images with different visibility for the human eye i.e., good visible, Moderate and blur images are considered from the image depository as the test input images. Image Properties such as Standard Deviation, Entropy, Skewness, Spatial Frequency, Kurtosis, Brightness, Visibility and seven Moments are calculated. Classification Algorithm is used to classify the images automatically depending on the input image Properties. The Block diagram of Proposed method is given in Fig.1.
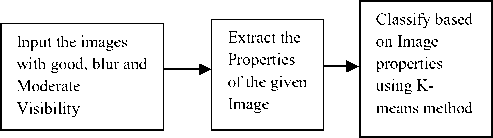
Fig.1. Block Diagram of Proposed Method
-
IV. Image Properties
Some of the basic Image Properties are obtained by following equations:
-
Std.Devittion = -^^о^о^ц- T^ (1)
Where 1ц represent the intensity of (ij)111 element, M and N represent the dimension of image and T is the average intensity of an image.
Entr ору = -^Pk I оg2 Pk for к = 11 о I (2)
where Pkis the Probability value for random value k.
Mean and Mode or Mean and Median are used to find the Skewness.
S к ewn e ss = —^■ m2?
1l iti (* i -x)3 gEF = i (x; - xy ] f
where second and third moments are represented by m 2 and m 3, For i h element, xt is the Median. x represent sample mean.
Spatial Frequency is measured as:
Spatial Prequency = ^RF2 + CF2
where Row Frequency ( RF ) and Column Frequency ( CF )
can be represented by equations (5) and (6).
RF = Д^Г^^^М(5)
CF = J^Z^=1S?=1[/(m,n) - t(rn - 1,n)]2
where M and N are size of the Image I.
Kurtosis (x) = E {-(^^}(7)
where p is Standard Deviation , о is deviation and E is Expectation for x random variable.
Sm=lSn=i;(™.n)
Brightness = 1 (8)
where M and N are the dimension of the image I.
For Maximum and Minimum luminance ( Imax and Imin ), Visibility is calculated by the following formula:
V is i b i I i ty = ^zzzti™.(9)
Ьмх^ I min
Image Moments are used to calculate the image properties such as Centroids, Variance, Kurtosis, Skewness etc.,. Gray Image Moments re calculated by the equation (10).
Mij = ZxZy xly1 ((x,y) (10)
where X and у are the center of mass can be calculated by equation (11) and (12).
X-= Mw and у = — Moo
Normalization is used to assign uniform values in the given range for different set of values. It can be calculated by equation (13).
Normalize(x) = x Mm (13)
v 7 Max-Min v '
where x is the element to be considered, Min and Max represents minimum and maximum value of the given set.
-
V. Approach
The images with different visibility to user with various sizes are stored in Image depository. Fractal, Weibull, Contrast and Intensity images are extracted for the given test images. The Image Properties such as Brightness, Contrast, Entropy, Skewness, Separability, Kurtosis, Spatial Frequency etc., are calculated for the resulted images. K-means Algorithm is used to classify the images in to separate groups. The number of Clusters can be defined by the user. The grouping is made on the basis of nearest cluster.
-
VI. Results
In Image depository, different sizes of images are stored. Different images with good visible, moderate visible and blur images also stored in the depository. For the test input, 512X512 size images of Lena (Good Visible), Baboon, Airplane and Lena(Blur) are used and its Intensity, Contrast, Weibull and Fractal images are generated as in Fig. 2 to 6.
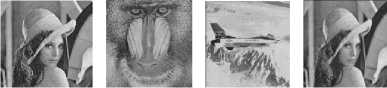
Fig.2. Lena (Good Visible), Baboon, Airplane and Lena (Blur) original Images
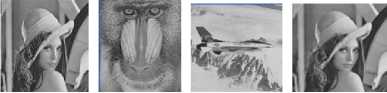
Fig.3. Lena (Good Visible), Baboon, Airplane and Lena (Blur) Intensity Images
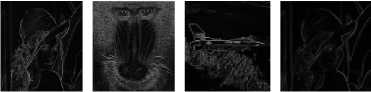
Fig.4. Lena (Good Visible), Baboon, Airplane and Lena (Blur): Contrast Images
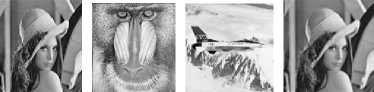
Fig.5. Lena (Good Visible), Baboon, Airplane and Lena (Blur) Weibull Images


Fig.6. Lena (Good Visible) Baboon, Airplane and Lena (Blur) Fractal Images
The Image Properties such as Brightness, Standard Deviation, Entropy, Skewness, Kurtosis, Separability, Spatial Frequency, Visibility, and Seven Moments for Test images are tabulated in Table 1 to 5. Normalized Outputs for Table 1 to 4 are tabulated in Table 6 to Table 9 respectively.
Table 1. Intensity Properties
|
Sl. No. |
Property Name |
Airplane |
Baboon |
Lena |
|
1 |
Brightness |
169.89 |
127.32 |
124.05 |
|
2 |
Standard Deviation |
39.866 |
36.345 |
47.857 |
|
3 |
Entropy |
6.486 |
7.139 |
7.446 |
|
4 |
Skewness |
1.165 |
0.554 |
0.288 |
|
5 |
Kurtosis |
0.714 |
0.642 |
-0.815 |
|
6 |
Separability |
0.832 |
0.682 |
0.699 |
|
7 |
Spatial Frequency |
15.559 |
31.433 |
14.531 |
|
8 |
Visibility |
2276.10 |
3371.42 |
4653.8 |
|
9 |
Moment 1 |
6.898 |
6.656 |
6.618 |
|
10 |
Moment 2 |
21.229 |
19.539 |
18.950 |
|
11 |
Moment 3 |
17.691 |
16.846 |
16.756 |
|
12 |
Moment 4 |
16.526 |
15.687 |
15.600 |
|
13 |
Moment 5 |
33.634 |
31.954 |
31.778 |
|
14 |
Moment 6 |
27.141 |
25.515 |
25.078 |
|
15 |
Moment 7 |
39.710 |
35.348 |
36.802 |
Table 3. Weibull Properties
|
Sl. No. |
Property |
Airplane |
Baboon |
Lena |
|
1 |
Brightness |
195.026 |
156.103 |
118.009 |
|
2 |
Standard Deviation |
55.540 |
48.451 |
57.550 |
|
3 |
Entropy |
6.920 |
7.517 |
7.701 |
|
4 |
Skewness |
1.230 |
0.735 |
0.309 |
|
5 |
Kurtosis |
1.420 |
0.036 |
-0.814 |
|
6 |
Separability |
0.811 |
0.651 |
0.696 |
|
7 |
Spatial Frequency |
22.825 |
21.935 |
16.649 |
|
8 |
Visibility |
2486.58 |
3164.64 |
6044.90 |
Table 4. Fractal Properties
|
Sl. No. |
Property |
Airplane |
Baboon |
Lena |
|
1 |
Brightness |
141.972 |
120.158 |
147.472 |
|
2 |
Standard Deviation |
22.110 |
19.399 |
22.307 |
|
3 |
Entropy |
4.231 |
5.813 |
5.396 |
|
4 |
Skewness |
1.752 |
1.458 |
1.631 |
|
5 |
Kurtosis |
1.566 |
11.051 |
14.185 |
|
6 |
Separability |
0.626 |
0.523 |
0.545 |
|
7 |
Spatial Frequency |
19.889 |
18.920 |
20.388 |
|
8 |
Visibility |
1298.655 |
1671.508 |
1416.723 |
Table 2. Contrast Properties
|
Sl. No. |
Property |
Airplane |
Baboon |
Lena |
|
1 |
Brightness |
17.278 |
41.178 |
16.995 |
|
2 |
Standard Deviation |
26.789 |
29.451 |
20.909 |
|
3 |
Entropy |
5.225 |
6.587 |
5.233 |
|
4 |
Skewness |
1.680 |
1.042 |
1.804 |
|
5 |
Kurtosis |
8.813 |
1.395 |
14.323 |
|
6 |
Separability |
0.741 |
0.695 |
0.672 |
|
7 |
Spatial Frequency |
19.296 |
20.921 |
15.430 |
|
8 |
Visibility |
47921.29 |
16399.22 |
37661.48 |
Table 5. Lena (blur) Image Properties
|
Sl. No. |
Property |
Intensity |
Contrast |
Weibull |
Fractal |
|
1 |
Brightness |
122.910 |
9.499 |
120.29 |
157.865 |
|
2 |
Standard Deviation |
45.636 |
12.914 |
56.230 |
26.800 |
|
3 |
Entropy |
7.392 |
4.558 |
7.678 |
5.393 |
|
4 |
Skewness |
0.135 |
1.995 |
0.231 |
1.354 |
|
5 |
Kurtosis |
-0.838 |
28.541 |
-0.798 |
7.651 |
|
6 |
Separability |
0.599 |
0.605 |
0.695 |
0.703 |
|
7 |
Spatial Frequency |
6.582 |
6.343 |
13.125 |
20.364 |
|
8 |
Visibility |
4518.26 |
59607.8 |
5742.9 |
1747.51 |
t able 6. i mage p roperties - i ntensit y
|
Im. No. |
Brt |
St. Dv |
Entr |
Skn |
Krt |
Spb |
Spt. Frq |
Vis b |
|
1 |
0.84 |
0.02 |
0.14 |
0.25 |
0.34 |
0.37 |
0.01 |
0.01 |
|
2 |
0.98 |
0.11 |
0.46 |
0.11 |
0.15 |
0.39 |
0.06 |
0.06 |
|
3 |
0.13 |
0.69 |
0.9 |
0.88 |
0.32 |
0.68 |
0.63 |
0.75 |
|
4 |
0 |
0.7 |
0.91 |
1 |
0.5 |
0.57 |
0.66 |
0.83 |
|
5 |
0.24 |
0.33 |
0.79 |
0.52 |
1 |
0 |
0.59 |
0.3 |
|
6 |
0.49 |
0.04 |
0.26 |
0.64 |
0.4 |
0.34 |
0.01 |
0.03 |
|
7 |
0.88 |
0.02 |
0.12 |
0.38 |
0.43 |
0.62 |
0.01 |
0.01 |
|
8 |
0.14 |
0.81 |
0.97 |
0.8 |
0.18 |
0.88 |
0.39 |
0.89 |
|
9 |
0.98 |
0.01 |
0.15 |
0.41 |
0.44 |
0.2 |
0.02 |
0.01 |
Table 7. Image Properties- Contrast
|
Im. No. |
Brt |
St. Dv |
Entr |
Skn |
Krt |
Spb |
Spt. Frq |
Visb |
|
1 |
0.01 |
0.01 |
0.08 |
0.93 |
0.85 |
0.69 |
0.01 |
0.58 |
|
2 |
0.08 |
0.2 |
0.28 |
0.57 |
0.17 |
0.69 |
0.21 |
0.8 |
|
3 |
0.51 |
0.75 |
0.79 |
0.14 |
0.01 |
0.36 |
0.61 |
0.45 |
|
4 |
0.6 |
0.79 |
0.83 |
0.12 |
0.01 |
0.41 |
0.73 |
0.33 |
|
5 |
0.74 |
0.73 |
0.9 |
0.11 |
0.01 |
0.3 |
0.65 |
0.1 |
|
6 |
0.02 |
0.01 |
0.12 |
0.9 |
0.79 |
0.61 |
0.01 |
0.64 |
|
7 |
0.01 |
0.18 |
0.04 |
0.65 |
0.23 |
1 |
0.2 |
1 |
|
8 |
0.37 |
0.59 |
0.7 |
0.2 |
0.01 |
0.36 |
0.46 |
0.54 |
|
9 |
0.04 |
0.02 |
0.14 |
0.92 |
0.84 |
0.63 |
0.02 |
0.45 |
Table 8. Image Properties- Weibull
|
Im. No. |
Brt |
St. Dv |
Entr |
Skn |
Krt |
Spb |
Spt. Frq |
Visb |
|
1 |
0.24 |
0.06 |
0.27 |
0.15 |
0.37 |
0.31 |
0.17 |
0.21 |
|
2 |
0.77 |
0.57 |
0.98 |
0 |
0.14 |
0.43 |
0.34 |
0.21 |
|
3 |
0.39 |
0.6 |
0.82 |
0.81 |
0.23 |
0.67 |
0.52 |
0.53 |
|
4 |
0.23 |
0.63 |
0.84 |
1 |
0.34 |
0.61 |
0.68 |
0.73 |
|
5 |
0.52 |
0.06 |
0.14 |
0.47 |
1 |
0 |
0.47 |
0.01 |
|
6 |
0.1 |
0.01 |
0.12 |
0.25 |
0.39 |
0.33 |
0.02 |
0.26 |
|
7 |
0 |
0 |
0 |
0.55 |
0.17 |
0.78 |
0.1 |
0.43 |
|
8 |
0.44 |
0.79 |
0.79 |
0.76 |
0.14 |
0.86 |
0.69 |
0.62 |
|
9 |
0.65 |
0.14 |
0.36 |
0.24 |
0.67 |
0.07 |
0.35 |
0.01 |
Table 9. Image Properties- Fractal
|
Im. No. |
Brt |
St. Dv |
Entr |
Skn |
Krt |
Spb |
Spt. Frq |
Visb |
|
1 |
0.05 |
0.04 |
0.07 |
0.96 |
0.94 |
0.95 |
0.04 |
0.57 |
|
2 |
0.1 |
0.04 |
0.16 |
0.91 |
0.86 |
0.86 |
0.06 |
0.4 |
|
3 |
1 |
0.93 |
0.85 |
0.67 |
0.38 |
0.38 |
0.87 |
0.01 |
|
4 |
0.94 |
0.84 |
0.92 |
0.57 |
0.27 |
0.12 |
0.92 |
0.02 |
|
5 |
0.67 |
0.78 |
1 |
0.25 |
0 |
0.15 |
0.83 |
0.14 |
|
6 |
0.49 |
0.08 |
0.34 |
0 |
0.47 |
0 |
0.27 |
0.01 |
|
7 |
0.17 |
0 |
0 |
0.84 |
0.81 |
0.79 |
0.08 |
0.19 |
|
8 |
0.97 |
0.78 |
0.81 |
0.64 |
0.4 |
0.27 |
0.77 |
0 |
|
9 |
0 |
0.05 |
0.1 |
1 |
1 |
1 |
0 |
1 |
K-means Clustering is unsupervised clustering method. The given set of data can be grouped by providing the number of clusters required. The grouping is made on the basis of nearest neighbour cluster centroid by calculating the distance between given data with centroid. Fig. 7 represents the Clustering of Fractal images with Entropy Properties for different number of clusters.
|
No. Of Clusters |
Centroids |
Clustering |
|
2 |
C1 = 0.1 C2 = 0.8 |
Group 1: 0.07, 0.16, 0.34, 0, 0.1 Group 2: 0.85, 0.92, 1, 0.81 |
|
3 |
C1 = 0 C2 = 0.3 C3 = 0.8 |
Group 1 : 0.07, 0.16, 0, 0.1 Group 2 : 0.34 Group 3 : 0.85, 0.92, 1, 0.81 |
|
4 |
C1 = 0 C2 = 0.3 C3 = 0.8 C4 = 0.9 |
Group 1: 0.07, 0.16, 0, 0.1 Group 2: 0.34 Group 3: 0.85, 0.81 Group 4: 0.92, 1 |
Fig.7. K-Means Clustering of Fractal Images with its Entropy Property for different number of Clusters.
-
VII. Conclusions
The Contrast images, Intensity Images, Fractal images and Wiebull images are extracted from the Image depository. Image depository contains the good visible, moderate visible and blur images with different image sizes. Image Properties are obtained for these resulted images. K-means clustering s applied to Fractal Images with Entropy property is calculated. We observed that combination of two or more properties give the better classification method. The proposed method gives the adaptive classification of images which can be acceptable by the users for grouping of images. The rule based image enhancement algorithm is used to enhance the image depending the particular cluster.
References Adaptive Image Enhancement Using Image Properties and Clustering
- Robert M Haralick, K Shanmugam and Its'hak Dinstein, "Textural Features for image Classification," IEEE Transactions on Systems, man an Cybernetics,vol. SMC-3, pp. 610-621, 1973.
- Lin Hong, Yifei Wan and Anil Jain, "Fingerprint Image Enhancement: Algorithm and Performance Evaluation," IEEE Transactions on Pattern Evaluation and Machine Intelligence, vol. 20, pp. 777-789, 1998.
- J Alex Stark, "Adaptive Image Contrast Enhancement Using Generalizations of Histogram Equalization," IEEE Transactions on Image on Image Processing, vol. 9, pp. 889-896, 2000.
- Bei Tang, Guillermo Sapiro and Vicent Caselles, "Color Image Enhancement via Chromaticity Diffusion," IEEE Transaction on Image Processing, vol.10, pp. 701-707, 2001.
- Jinshan Tang, Eli Peli and Scott Action, "Image Enhancement Using a Contrast Measure in the Compressed Domain," IEEE Signal Processing Letters, vol.10, pp. 289-292, 2003.
- Jean-Luc Starck, Fionn Murtagh, Emmanuel J Candès and David L Donoho, "Gray and Color Image Contrast Enhancement by the Curvelet Transform," IEEE Transaction on Image Processing, vol.12, pp. 706-717, 2003.
- Zhou Wang, Alan C Bovik, Hamid R. Sheikh, and Eero P Simoncelli, "Image Quality Assessment: From Error Visibility to Structural Similarity," IEEE Transactions on Image Processing, vol. 13, pp. 1-14, 2004.
- Yixin Chen, James Z Wang and Robert Krovetz, "CLUE: Cluster-based Retrieval of Images by Unsupervised Learning," IEEE Transactions on Image Processing, vol. 14, pp. 1187-1201 2005.
- Eun Kyung Yun and Sung Bae Cho, "Adaptive Fingerprint Image Enhancement with Fingerprint Image Quality Analysis," Elsevier Image and Vision Computing, vol. 24, pp.101-110, 2006.
- Grigorios F Tzortzis and Aristidis C. Likas, "The Global Kernel k-Means Algorithm for Clustering in Feature Space," IEEE Transactions on Neural Networks, vol. 20, pp. 1181-1194, 2009.
- Anna Brook, Eyal Ben-Dor, "Automatic Registration of Airborne and Space borne images by Topology Map matching with Surf Processor Algorithm," International Journal of International Society of Photogrammetry and Remote Sensing Technical Commission 7 Symposium, vol. 38, pp. 98-102, 2010.
- Hongzhao Yuan, Zhisheng Gao, Jun Yang, Xiuqiong Zhang and Xiaofeng Li, "An Adaptive Infrared Image Enhancement Algorithm for Enhanced Vision System," International Journal of Computational Information Systems, vol. 7, pp. 4090-4097, 2011.
- M Z Rashad, B S el-Desouky and Manal S Khawasik, "Plants Images Classification Based on Textural Features using Combined Classifier," International Journal of Computer Science & Information Technology, vol. 3, pp. 93-100, 2011.
- Le Hoang Thai, Tran Son Hai and Nguyen Thanh Thuy, "Image Classification using Support Vector Machine and Artificial Neural Network," International Journal of Information Technology and Computer Science, vol. 5, pp. 32-38, 2012.
- Chun-Ming Tsai, "Adaptive Local Power-Law Transformation for Color Image Enhancement," Applied Mathematics & Information Sciences, pp. 2019-2026, 2013.
- Hongteng Xu, Guangtao Zhai, Xiaolin Wu and Xiaokang Yang, "Generalized Equalization Model for Image Enhancement," IEEE Transactions on Multimedia, vol. 16, pp. 68-82, 2014.
- Zhi Zhou, Staci Sorense, Hongkui Zeng, Michael Hawrylycz and Hanchuan Pe, "Adaptive Image Enhancement for Tracing 3D Morphologies of Neurons and Brain Vasculatures," Springer Science Business Media, 2014.
- Sundararajan S and Karthikeyan S, "An Efficient Hybrid Approach Data Clustering using Dynamic k-means Algorithm and Firefly Algorithm," Asian Research Publishing Network Journal of Engineering and Applied Sciences, pp 1348-1353, 2014.
- Christos Boutsidis, Anastasios Zouzias, Michael W. Mahoney and Petros Drineas, "Randomized Dimensionality Reduction for k-Means Clustering," IEEE Transactions on Information Theory, vol. 61, pp. 1045-1062, 2015.
