Adaptive Quantization Index Modulation Audio Watermarking based on Fuzzy Inference System

Author: Sunita V. Dhavale, Rajendra S. Deodhar, Debasish Pradhan, L.M. Patnaik
Journal: International Journal of Image, Graphics and Signal Processing(IJIGSP) @ijigsp
Article in issue: 3 vol.6, 2014.
Free access
Many of the adaptive watermarking schemes reported in the literature consider only local audio signal properties. Many schemes require complex computation along with manual parameter settings. In this paper, we propose a novel, fuzzy, adaptive audio watermarking algorithm based on both global and local audio signal properties. The algorithm performs well for dynamic range of audio signals without requiring manual initial parameter selection. Here, mean value of energy (MVE) and variance of spectral flux (VSF) of a given audio signal constitutes global components, while the energy of each audio frame acts as local component. The Quantization Index Modulation (QIM) step size Δ is made adaptive to both the global and local features. The global component automates the initial selection of Δ using the fuzzy inference system while the local component controls the variation in it based on the energy of individual audio frame. Hence Δ adaptively controls the strength of watermark to meet both the robustness and inaudibility requirements, making the system independent of audio nature. Experimental results reveal that our adaptive scheme outperforms other fixed step sized QIM schemes and adaptive schemes and is highly robust against general attacks.
Discrete Cosine Transform, Spectral Flux, Adaptive Audio Watermarking, Quantized Index Modulation, Fuzzy Inference
Short address: https://sciup.org/15013259
IDR: 15013259
Text of the scientific article Adaptive Quantization Index Modulation Audio Watermarking based on Fuzzy Inference System
Published Online February 2014 in MECS DOI: 10.5815/ijigsp.2014.03.01
Digital audio watermarking is one of the promising ways for the protection and enforcement of intellectual property rights for digital audio. Existing audio watermarking techniques are broadly categorized into time domain and transform domain techniques [1]. Time domain techniques [2] are simple to realize, but they are less robust compared to transform domain techniques [38]. According to International Federation of the Phonographic Industry (IFPI), any audio watermarking should meet the following requirements [1]: 1) Perceptual transparency i.e. the watermark must be embedded without quality degradation and the Signal to Noise Ratio (SNR) for watermarked audio should be more than 20 dB. 2) Robustness i.e. the embedded watermark should survive most of the common audio signal processing operations. These two conflicting requirements present great challenges.
Chen and Wornell proposed QIM, a class of nonlinear methods that can reject the host-signal interference [910]. As a result, these methods have good performance characteristics in terms of their achievable trade-offs among the robustness of the embedding, the degradation to the host signal caused by the embedding, and the amount of data embedded. But in case of these traditional methods, the quantization step size Δ is fixed without taking into account the audio signal properties [5-9]. Also these methods are highly sensitive to amplitude scaling attacks and lead to poor fidelity in some areas of the host signal [11]. To make use of the host signal properties and improve the transparency along with the robustness, Δ can be made adaptive based on the Human Auditory System (HAS) properties. In fact, the strength of watermark should be adaptive to the host signal energy so that higher embedding strength can be achieved while keeping the induced distortion under perceptible levels.
Further, many adaptive schemes focus only on local audio segment features which change with each segment but not on the overall or global characteristics of an audio. Foo, Yeo, and Huang proposed the adaptive and content-based audio watermarking system based on echo hiding [12]. Here, by adaptively modifying the decay rate in each audio segment according to the psycho-acoustic model, a significant improvement in audio quality is achieved. But the watermark detection accuracy depends on the amplitudes of echoes embedded and the decoder needs the information about the positions of the watermarked segments for effective synchronization. Li Zhang and Sun [13] used SNR to determine watermark strength and the watermark is embedded in the wavelet domain. Though the system is robust to many attacks but it requires the original audio signal in the detection process. Sriyingyong and Attakitmongcol [14] used the adaptive tabu search (ATS) to find optimal intensity of watermark. Besides lower SNR values to achieve the same robustness, the time complexity of the system greatly depends on the number of iterations required for convergence of ATS. Wang et al. [3] have proposed an algorithm to embed the watermark into host audio by adaptive quantization based on the local audio correlation and the frequency masking effect of the HAS. Here the quantization step of each audio segment depends on mean energy of DWT-DCT coefficients of that segment. Bhat et al. [15] have discussed the blind adaptive audio watermarking algorithm based on singular value decomposition (SVD) in the discrete wavelet transform domain using adaptive quantization steps.
Though all the above mentioned schemes are based on the fact that the watermark can be embedded with higher strength in the high energy frames compared to other frames, they only focus on local audio segment properties. This makes them less robust to work in the case of dynamic range of audio signals having different characteristics. Apart from the local features, the global characteristics of an audio can also be used while deciding suitable QIM step size Δ. Here, we introduce a novel, fuzzy logic based audio watermarking algorithm that is adaptive in nature. Unlike other methods, the proposed watermarking method considers both the global and the local characteristics of an audio in order to decide suitable value of Δ. A Fuzzy Inference System (FIS) is developed to determine the global component of Δ based on the global characteristics of an audio signal automatically, to process different types of audio signals, and thus making our system generalized on wide variety of audio signals. The energy of each frame representing the local segment decides the local component of Δ for that segment. This provides good tradeoff between imperceptibility and robustness constraints along with the simplicity of the implementation of scheme.
Low level, energy and spectral features can be used to describe the global characteristics. The various low-level features are available in the literature [16-17], e.g. ZeroCrossing Rate (ZCR), Linear Prediction Coefficients, Short Time Energy Ratio, Spectral Centroid, Spectral Flux (SF), Spectral Roll-off Frequency, Mel Frequency Cepstral Coefficients, Variance of Spectral Flux (VSF)
[18], Mean Value of Energy (MVE) that denotes average energy content of an audio etc. and are effectively used in most of the music genre characterization applications. Depending upon the average energy content, audio signals can be broadly classified into high energy, mid energy and low energy signals.
For high energy signals it is possible to embed watermark with higher strength by selecting high value of Δ. So depending on the average energy of the signal a suitable range of Δ values can be chosen to achieve more robustness. Further pure speech differs from music signals in its spectral properties. Simple features like ZCR, SF (that denotes the difference in the magnitude of the spectrum from the preceding frame) and VSF can be adopted successfully to distinguish speech from music. It is found that the VSF of speech tends to be much larger than that of music [18]. Hence along with the MVE, VSF can also be used in deciding the range of Δ. In our case, both the features MVE and VSF have been found effective for deciding a global component of Δ.
In watermark embedding stage, the binary watermark image is first permuted using Arnold Transform in order to increase the secrecy of embedded watermark. To achieve robustness against cropping attacks, synchronizing codes are added along with the watermark bits. In our algorithm, we embed the watermark bits using QIM technique by modulating mean of few DCT low frequency sub-band coefficients of non-silent frames. As DCT low frequency sub-band coefficients contain most of the signal energy, strong robustness can be achieved against common audio signal processing attacks; without degrading the acoustical quality of original host audio signals.
A brief outline of this paper is as follows. In Section II, we discuss the outline of the proposed algorithm for embedding and extraction of binary watermark in an audio. Section III deals with the experimental results and comparison with other schemes. In the end, we discuss the conclusions of our results in Section IV.
-
II. PROPOSED SCHEME
In this section, an adaptive digital audio watermarking algorithm is proposed on the basis of local and global audio features. The proposed scheme consists of watermark processing stage and audio processing stage as shown in Fig.1. Audio processing stage in turn, consists of selection of QIM step size and watermark embedding. All these steps and watermark detection procedure are described in this section.
-
A. Watermark Preparation
The details of watermark processing stage are shown in Fig.1. Here the binary logo watermark {B = {b(i, j) | b(i, j) e {0,1},0 < i < m,0 < j < n )} is first permuted using the Arnold Transform [8] in order to enhance the security of the system.
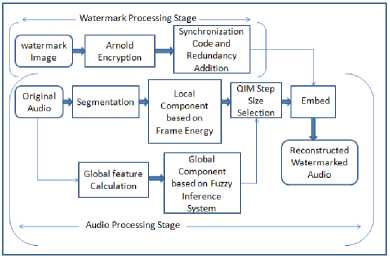
Figure 1. Watermark Embedding Process
The resulting watermark is then converted into one dimensional binary bit stream and synchronization codes are added in this bit stream to avoid false synchronization. Here 13 bit barker code is used as the synchronization code Let W = { w ( i ) | w ( i ) e {0,1},0 < i < L} be the final processed watermark bit stream with length L = ( m x n + 13) .
-
B. Selection of QIM step size Δ
In audio processing stage, the original host audio X = {x(i);x(i) e[-1.0,+1.0],0 < i < N} is first segmented into non-overlapping audio frames of size l samples each. For an audio frame (x ,x ,..., x ) , the energy of the frame is given by, l2
E = 7 Dx|| l '■' (1)
According to HAS temporal domain masking property, the large aberrance in high energy audio frames is undetectable. Hence relatively large values of Δ can be selected for these frames. Hence energy of a frame is used in deciding the QIM step size. The energy Ek of kth frame act as local component of QIM step size Δk for kth frame.
However it is observed that the mean value of energy varies significantly from one audio signal to another depending on the contents. A good tradeoff between imperceptibility and robustness can be achieved by making Δ adaptive to the signal properties and contents. In this scheme QIM step size Δ for a given frame of an audio signal is selected based on both the frame as well as the complete audio segment used for embedding the watermark. Average energy content of an audio signal, represented by MVE, is given by
MV"15 = N L .s^ E k-
where, Ek represents the energy of the kth frame and Ns is total number of frames. The value of MVE will be high in case of an audio signal containing more perceptually significant components. In this case, larger QIM step size Δ can be chosen and watermark bit is embedded effectively in more robust manner without sacrificing any imperceptibility. However in remaining cases, smaller Δ has to be chosen in order to retain transparency of the embedded watermark. Experimentally, it is found that the value of MVE is small in case of signals like classical and speech audio signals. Hence MVE is selected as one of the global features for deciding the global component β of QIM step size.
Typically an audio signal requiring watermarking consists of either a speech signal or some type of music. Experimentally it is observed that the QIM step size Δ which can be used for speech signal is significantly different from that of music. One of the important characteristic of a signal which differentiates music from speech is VSF [18].
Spectral Flux (SF) is defined as the 2-norm of difference in successive magnitude spectra and is given by, l-1
SF ( n ) = .E (| F [ n , k ]| — | F [ n - 1, k ]|) 2
\ k = 0
where F[n,k] is the kth frequency of the spectrum of the nth length ‘ l ’ frame of a signal.
It is found that SF value is low in case of low energy classical audio signals. Speech alternates between transient and non-periodic speech to short-time stationary and periodic speech. On the other hand, music has more constant rates of change compared to speech. This indicates that the variance of SF of speech is larger than that of music [18] and hence is useful in differentiating speech from music. We take VSF as another global parameter for deciding the global component β of the QIM step size.
We define the QIM step size Δ k of kth frame of an audio signal as,
A. = [а* Б. + в
where, [ ] represents the rounding off operator and gives the nearest integer of the argument subject to the condition that it is not exceeding the predefined maximum value Δ max . In the case when nearest integer is greater than Δ max , [ ] returns Δ max . The SNR of each audio frame is ensured to be greater than 20dB by selecting appropriate Δmax. Embedding strength can be controlled using parameter α.
Like their definition, the boundaries between low, mid or high energy music or speech signals are fuzzy [16]. Choice of Δ depends on the type of audio signal through its global component β. Hence Fuzzy logic based system can be used for modeling β. In this paper, Fuzzy Inference System (FIS) is designed to calculate β based on the properties of the section of an audio signal in which the whole watermark is to be embedded.
Unlike image/video watermarking, audio watermarking has no standard audio data set which is open and commonly used. Therefore, in order to generalize our system on wide variety of music, different types/genres of audio sequences are used while designing the system. Some representative examples are shown in Fig.2. Here each audio sample is 60 second duration, 16-bit mono audio signal CD quality in the .wav format sampled at 44100 Hz. The audio sequences were selected to cover most of the possible combinations like high energy music signals (like Western Rock, Indi-pop songs), mid energy music signals (like Classical, Blue, Metal genre songs, Instrumental music), speech signals with high VSF, low energy music signals ( like Jazz, Country, Classical genre songs, South Indian Carnatic music and North Indian Hindustani music) etc.
To design fuzzy rules, objectives are defined based on seeking the best trade-off between two critical design parameters, robustness and imperceptibility. Here robustness measures the ability of watermark to resist the attacks and imperceptibility asserts how perceptually similar the watermarked and original content are. To measure imperceptibility, we use SNR of digital audio signal. Normalized Correlation (NC) and Bit Error Rate (BER) between the original watermark and the extracted watermark are used as an objective measure for the robustness.
Thus MVE,VSF and optimal initial QIM step size values are experimentally determined for all types of audio sequences with the objective defined as, SNR of watermarked audio should be >=25dB, required NC value >=0.9 and required BER value <=5% always. These are given in Table I.
It is observed that, compared to low energy songs, high energy songs require large QIM step size for best tradeoff between SNR and BER. Pure speech signals have completely different requirement of QIM step size.
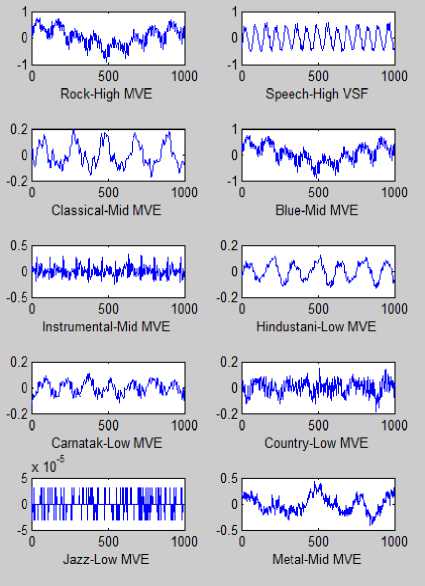
Figure 2. Samples from each of 10 different audio genres used in our research
TABLE I. MVE, VSF VALUES ALONG WITH SUITABLE QIM STEP SIZE OBTAINED MANUALLY
|
Audio Genre |
MVE range |
VSF range |
QIM step size |
Remarks |
|
Rock |
0.048-0.150 |
<4000 |
150 |
High Energy |
|
Speech |
0.007-0.049 |
>6000 |
50 |
High VSF |
|
Classical |
0.008-0.047 |
<1500 |
100 |
Mid Energy |
|
Blue |
0.007-0.030 |
<500 |
100 |
Mid Energy |
|
Country |
0.001-0.005 |
<2000 |
25 |
Low Energy |
|
Jazz |
0.003-0.005 |
<5500 |
25 |
Low Energy |
|
Metal |
0.009-0.049 |
<500 |
100 |
Mid Energy |
|
Instrumental |
0.007-0.042 |
<4000 |
100 |
Mid Energy |
|
Carnatic |
0.001-0.007 |
<2000 |
25 |
Low Energy |
|
Hindustani |
0.001-0.005 |
<1000 |
25 |
Low Energy |
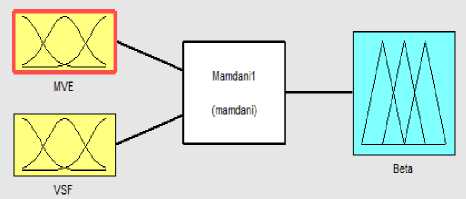
Figure 3. Designed Fuzzy Inference System
Adjusting QIM step size manually for each audio is tedious job. Hence a system is developed to adaptively select suitable QIM step size as given in (4). Using the experimental data, a fuzzy system is designed to automatically determine the global component β of (4), based on MVE and VSF of the given audio signal. The block diagram of fuzzy system is shown in Fig. 3. The Fuzzy system developed here is of Mamdani type.
In this system, the input variable MVE takes the linguistic values HighMVE, MidMVE and LowMVE while the input variable VSF takes the linguistic values LowVSF and HighVSF respectively. The output variable β, i.e., the global component of Δ to be used for a particular audio has linguistic values β VeryLow , β Low , β Mid and β High . The domain of the output variable β is from 10 to 160, which is based on the observations obtained during initial experiments. The range of output variable β is defined by analyzing the output performance of the watermarking system.
To deal with the dynamic changes in audio signal properties over a given time period, our fuzzy system calculates output β over an audio section required to embed the whole watermark data, as genre can change within an audio signal. e.g. after some audio sections in songs, a speech can appear and vice versa.
As stated earlier, it is important to realize that this approach in turn enables adjustment of QIM step size so as to best fit the audio properties. e.g the value of Δ must be high in case of high energy signals compared to the low energy signals in order to achieve good tradeoff between imperceptibility and robustness. The requirement of Δ value in case of speech signals differ from that of music.
The input membership functions are determined by statistical data analysis, by sampling different audios at different times. As given in Table1, values of MVE range from 0.001 to 0.15 while values of VSF range from 100-40000. Thus membership functions are defined over these intervals as shown in Fig. 4.
The fuzzy values HighMVE, LowMVE, HighVSF and LowVSF are defined using trapezoidal membership functions while MidMVE is defined using triangular membership function. The extreme points are defined to cover the MVE and VSF ranges observed. Four different fuzzy values are defined for output variable β as shown in Fig. 5.
R1: If the MVE is high and VSF is low or high, then it resembles high energy music signals (like western rock, indi-pop songs etc.) and a high value of β is selected.
R2: If the MVE is low and VSF is low, then it resembles low energy music signals (like Hindustani/ Carnatic audios etc.) and a very low value of β is selected.
R3: If the MVE is mid and VSF is low, then it resembles mid energy music signals (e.g. Classicals, Gazals) and a mid value of β is selected.
R4: If the MVE is mid/low and VSF is high, then it resembles speech signals and a low value of β is selected.
C. Watermark Embedding
According to the HAS frequency domain masking property, the modification in frequency coefficients are difficult to perceive. Here we apply one dimensional Discrete Cosine Transform (DCT) to each of selected non-silent audio frame. Calculate mean of mid frequency band coefficients as in (5),
Mk =
l 2
1 C ( i )
( 1 2 - 1 1 + 1) ^ k'
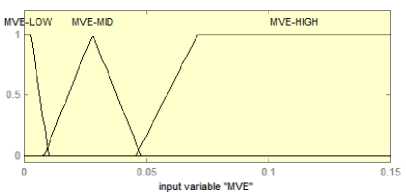
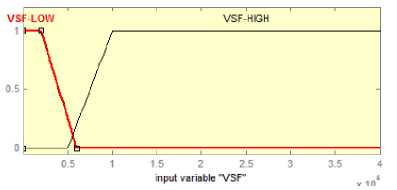
Figure 4. Fuzzy definitions for MVE and VSF
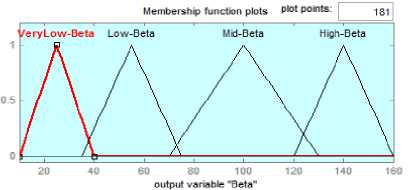
Figure 5. Fuzzy definitions for output variable β
where, C k (i) is the i th DCT coefficient of the kt h audio frame. Also instead of selecting all DCT coefficients, it is found that applying mean quantization to selected sub-band of DCT coefficients ( l1-l2 ) can result into good SNR verses BER tradeoff. Due to the energy compaction property of DCT, both low and mid frequency DCT coefficients contain most of the energy in the frame. Though embedding in low frequency coefficients increases robustness, it affects imperceptibility. Thus, embedding watermark in mid frequency coefficients will give a good tradeoff between robustness and inaudibility. In our experiment, for an audio frame size of 512 samples, a sub-band of only 4 mid frequency DCT coefficients from 112 to 115 is found sufficient to achieve our objective.
Watermark is embedded in each audio frame by modulating the mean Mk of selected DCT sub-band using quantization index modulation technique. QIM refers to embedding information by first modulating an index or sequence of indices with the embedded information and then quantizing the host signal with the associated quantizer or sequence of quantizers [9]. Depending upon the watermark bit, M k is quantized using following quantizers as,
M k * =
where,
In order to calculate β using Mamdani fuzzy system, following simple fuzzy rules are defined,
Mk - Mod(Mk, Ak) + 0.25* Ak
Mk - Mod ( Mk , Ak ) + 0.75* At
Mod ( M k , A k ) =
M k + 4( - M . /A . ) J + 1)* A .
lf W = 0
If W = 1
Mk ^ 0
if Mk < 0
where ^ . J is the floor function and Ak denotes the step size/embedding strength. The minimum distance between the sets of reconstruction points of these two different quantizers determines the robustness as well as the amount of embedding induced distortion [9].
The difference between M k and M k * is calculated as,
DiJf k = M k — M k * (7)
This difference Diff is added to all the above selected DCT coefficients in order to change the mean. Thus watermark is embedded in frequency domain in a robust manner.
Apply inverse Discrete Cosine Transform to embedded audio frames and combine them to get watermarked audio signal X .
-
D. Watermark Extraction Process
The extraction algorithm consists of all the audio processing steps that are carried out at the time of embedding the DCT frames. First watermarked audio signal X ' = { x '( i ); x '( i ) e [ — 1.0, + 1.0],0 < i < N } is segmented into non-overlapping frames of size l samples each. Then calculate the energy of each frame,
MVE, VSF and estimate the QIM step size value At .
Here at the watermark embedding stage, the QIM step size Ak is derived from the host signal X and at watermark detection stage, QIM step size value Ak is estimated from the received signal r = x + w + n as shown in Fig 6.
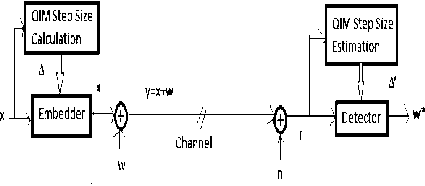
Figure 6. QIM step size estimation at decoder
QIM step size Δ is proportional to the local energy of audio segment as,
A =
a v 2 о
7 5 x + в
At decoder side, the estimated QIM step size is given as,
A ' = 7 5 ( x i + W + n ) + в 7 Ы
i = 1
Empirically it is observed that, for most of the attacks в ~ в . The estimation error £ = A — A ' tends to 0 for increasing values of l and robustness of the estimation of Δ depends on l . For l =1024 samples, the relative estimation error R^ = (_£ / A ) *100 is found to be less than 0.3% experimentally.
Fig.7 shows the histogram of estimation error £ , which is closer to 0 for all watermarked frames, in case of mp3-64Kbps attack with SNR of an attacked audio=16.91dB. Due to the rounding function used in the calculation of Δ in (5), Re is found to be reduced '
further. After estimating Ak , calculate the mean of mid frequency DCT sub band coefficients from 112 to 115 and extract the watermark as, wk*
-
1 if Mod ( Mk , A k ) >A k /2
= 5
[ 0 if Mod ( M k , A k ) k /2
Once all the bits are extracted, the watermark binary logo image can be reconstructed by detecting the synchronization codes and then descrambling using Arnold decryption algorithm. The original audio DCT coefficients are not required in the extracting process and thus the proposed algorithm is blind.
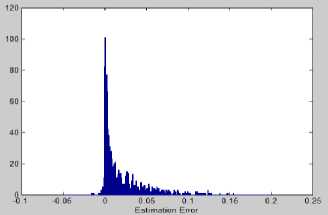
Figure 7. Histogram of estimation error ϵ for watermarked frames
-
III. EXPERIMENTAL RESULTS
-
A. Experimental Setup
To assess the performance of the proposed audio watermarking scheme, we have performed extensive simulations using MATLAB 7.1 on different mono audio signals of length 60 seconds each. Each audio is a 16-bit mono audio signal in the WAV format sampled at 44100 Hz.
Unlike image/video watermarking, audio watermarking has no standard audio data set, which is open and commonly used. Therefore, in order to measure the performance of our system, we choose wide variety of music with different styles as our audio data set. The vocal music dataset contains samples from each genre, Western rock, Indi-pop, new Hindi songs and Indian classical music. The Indian classical music dataset further belongs to both South Indian
Carnatic music and North Indian Hindustani music while the pure speech dataset includes the voices of both females and males. These audio signals are categorized into following categories; high energy audio signals e.g. Western rock, Indi-pop, new Hindi songs etc., mid energy signals like Blue, Jazz genre music, Gazal songs, low energy audio signals e.g. Classical, Country, South Indian Carnatic music, North Indian Hindustani music and speech signals as shown in Fig.2.
In watermark preparation stage, we used 32x32 sized binary watermark images along with 13 bit barker code as the synchronization code. The window length of 1024 and step of 100 is used to calculate VSF values. We have chosen α =120 in our experiment.
Mamdani-type Fuzzy Inference system is designed to calculate β using Matlab 7.1 Fuzzy Toolbox. The fuzzy rules and the membership functions were developed so as to achieve good tradeoff between SNR and BER values.
-
B. Perceptual Quality Measures
To measure imperceptibility, we use SNR of digital audio signal. The average SNR s are calculated only on the portion of an audio signal, where actual watermark bits are embedded. The distortion caused is not perceptually audible as only few DCT coefficients are modified from each frame. It was observed that four DCT coefficients per frame of 512 samples can be used without affecting the perceptual audio quality of the host signals. The experimental results show that after embedding the watermark information, the stego audio signal gives SNR value more than 30 dB in all types of audio signals.
Along with SNR, we also employ a subjective measure called Mean Opinion Score (MOS). The five-point impairment scale is applied for MOS, 5.0 for imperceptible, 4.0 for perceptible but not annoying, 3.0 for slightly annoying, 2.0 for annoying, and 1.0 for very annoying. Here, eight listeners were involved in the actual listening test to estimate the subjective MOS grade of the watermarked audio signals. After presenting with the pairs of original audio signal and the watermarked audio signal, each listener was asked to report any difference detected between the two signals. The average grade for each pair from all listeners is taken as the final grade for that pair. Table II lists the corresponding SNR values, along with MOS grades obtained by conducting listening test.
The evaluation result shows that the watermarked and original audios are perceptually undistinguishable.
-
C. Robustness Test
Both Normalized cross-correlation (NC) and Bit Error Rate (BER) between the original watermark w and the extracted watermark w are used as an
E Nw(i, j) wy, j) i=1
NNNN
EEw2(i, j)A EEw'2(i, j) i =1 i=1 i=1
Here besides NC, BER is also used to measure the number of erroneously detected bits as,
No _ of _ Bits _ in _ Error
BER =-----~ ~---=—=-------x 100%
Total No of Bits Embedded
The performance of the proposed algorithm is compared with the other watermarking algorithms proposed by Wang X. and Zhao H. [8] and Vivekananda Bhat, Indranil Sengupta, Abhijit Das [15]. The results are summarized in Table 3. We implemented these systems with the parameters specified in [8,15] and compared the performance of our algorithm against MP3 attacks. For fair comparison, we compared these schemes on same audio dataset with same amount of embedded watermark bits corresponding to our watermark image (see Fig. 8.(a)).
It is found that all these schemes exhibits equal amount of robustness against MP3-112kbps attack, but the SNR values and embedding capacity of our scheme are always higher compared to the schemes in [8] and [15] for the same amount of watermark bits embedded. Also the performance of our algorithm is maintained equally well in all types of audio, making our scheme generalized to all audio types. The objectives mentioned while designing the system are also achieved here. i.e. in all types of audio signals, SNR is maintained more than 25dB with NC>=0.9 and BER<=5%. Embedding in DWT followed by DCT domain in [8] or embedding in DWT followed by SVD domain in [15], increases computational complexity. Also other algorithms mentioned above demand manual tuning of many parameters which is not required in our method. One time effort in designing the fuzzy system to obtain Δ has removed the necessity of tuning parameters for each signal.
Fig. 8 shows both original and extracted watermark, when an audio is subjected to mp3-112Kbps attack.
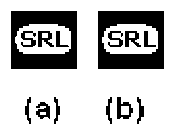
Figure 8. Original (a) and Extracted watermark (b) against mp3-112Kbps Attack
In order to assess the robustness of the proposed watermarking schemes, the watermarked audio signal is subjected to several standard audio processing attacks and results are summarized in Table IV.
|
Audio File |
Low Energy Music |
Mid Energy Music |
High Energy Music |
Pure Speech |
|
Notation |
A1 |
A2 |
A3 |
A4 |
|
SNR(dB) |
34.11 |
31.64 |
33.85 |
35.14 |
|
MOS |
4.750 |
4.625 |
5.000 |
4.625 |
TABLE III. ALGORITHM COMPARISON
|
Algorithm |
Our |
[8] |
[15] |
|
|
Domain used |
DCT |
DWT-DCT |
DWT-SVD |
|
|
Technique used |
Adaptive |
Fixed |
Adaptive |
|
|
A1 Audio |
SNR dB |
33.61 |
20.02 |
20.01 |
|
NC |
0.99 |
0.98 |
0.99 |
|
|
BER |
0.25 |
0.33 |
0.24 |
|
|
A2 Audio |
SNR dB |
29.11 |
27.30 |
24.31 |
|
NC |
0.99 |
0.82 |
0.96 |
|
|
BER |
0.12 |
12.84 |
1.75 |
|
|
A3 Audio |
SNR dB |
31.21 |
41.13 |
27.87 |
|
NC |
0.99 |
0.50 |
0.95 |
|
|
BER |
0.80 |
41.90 |
1.92 |
|
|
A4 Audio |
SNR dB |
32.52 |
28.20 |
23.70 |
|
NC |
0.99 |
0.85 |
0.99 |
|
|
BER |
0.30 |
1.13 |
0.08 |
|
|
payload in bps |
86.13 |
86.13 |
45.9 |
|
TABLE IV. NC VALUES OF EXTRACTED WATERMARKS FOR VARIOUS ATTA3CKS
|
Attacks |
Algorithm |
Rock |
Classical |
Speech |
|||
|
SNR |
NC |
SNR |
NC |
SNR |
NC |
||
|
No Attack |
Our |
33.97 |
1.00 |
28.34 |
1.00 |
30.52 |
1.00 |
|
[8] |
35.05 |
1.00 |
20.01 |
1.00 |
20.25 |
1.00 |
|
|
[15] |
28.25 |
1.00 |
22.11 |
1.00 |
22.45 |
1.00 |
|
|
AWGN -40dB |
Our |
33.25 |
1.00 |
28.05 |
1.00 |
30.18 |
1.00 |
|
[8] |
35.01 |
1.00 |
16.68 |
1.00 |
20.23 |
1.00 |
|
|
[15] |
25.66 |
0.99 |
18.36 |
0.98 |
19.33 |
1.0 |
|
|
AWGN -20dB |
Our |
21.15 |
0.99 |
19.44 |
1.00 |
20.89 |
1.00 |
|
[8] |
20.05 |
1.00 |
14.99 |
1.00 |
18.12 |
1.00 |
|
|
[15] |
19.46 |
0.99 |
16.19 |
0.98 |
17.03 |
1.00 |
|
|
Re-sample 22.05KHz |
Our |
20.39 |
1.00 |
26.18 |
1.00 |
30.45 |
1.00 |
|
[8] |
33.42 |
1.00 |
16.64 |
1.00 |
20.27 |
1.00 |
|
|
[15] |
18.75 |
0.99 |
18.00 |
0.98 |
19.37 |
1.00 |
|
|
Re-sample 11.025KHz |
Our |
16.34 |
0.95 |
23.19 |
1.00 |
28.79 |
1.00 |
|
[8] |
28.83 |
1.00 |
16.45 |
1.00 |
20.00 |
1.00 |
|
|
[15] |
15.02 |
0.99 |
17.32 |
0.98 |
19.22 |
1.00 |
|
|
Re-sample 22.05KHz +AWGN-20dB |
Our |
18.05 |
0.95 |
19.46 |
0.99 |
21.30 |
0.99 |
|
[8] |
20.35 |
1.00 |
15.13 |
1.00 |
18.30 |
1.00 |
|
|
[15] |
16.75 |
0.99 |
16.13 |
0.98 |
17.21 |
1.00 |
|
|
Mp3-224K |
Our |
29.96 |
1.00 |
27.35 |
1.00 |
29.02 |
1.00 |
|
[8] |
33.64 |
0.99 |
16.81 |
0.99 |
20.22 |
1.00 |
|
|
[15] |
27.07 |
0.99 |
19.43 |
1.00 |
20.60 |
1.00 |
|
|
Mp3-160K |
Our |
21.11 |
0.99 |
20.33 |
1.00 |
24.38 |
1.00 |
|
[8] |
19.22 |
0.83 |
15.89 |
0.80 |
19.46 |
0.98 |
|
|
[15] |
21.48 |
0.99 |
18.10 |
0.98 |
20.08 |
1.00 |
|
|
Mp3-112K |
Our |
17.66 |
0.98 |
16.83 |
1.00 |
22.73 |
1.00 |
|
[8] |
16.47 |
0.65 |
13.99 |
0.57 |
19.06 |
0.98 |
|
|
[15] |
17.50 |
0.99 |
15.84 |
0.98 |
17.51 |
1.00 |
|
|
Mp3-64K |
Our |
15.01 |
0.90 |
14.24 |
0.97 |
18.56 |
0.99 |
|
[8] |
13.70 |
0.50 |
12.96 |
0.51 |
16.32 |
0.82 |
|
|
[15] |
14.99 |
0.99 |
13.88 |
0.98 |
14.75 |
1.00 |
|
|
6th order Butterworth LPF 35 kHz |
Our |
25.33 |
0.99 |
26.82 |
1.00 |
27.30 |
1.00 |
|
[8] |
32.01 |
1.00 |
24.03 |
1.00 |
25.74 |
1.0 |
|
|
[15] |
22.39 |
0.99 |
18.18 |
0.98 |
19.01 |
1.00 |
|
|
2% Amplitude Scaling |
Our |
30.88 |
1.00 |
27.14 |
1.00 |
28.77 |
1.00 |
|
[8] |
30.05 |
0.99 |
16.42 |
0.99 |
19.92 |
1.00 |
|
|
[15] |
23.62 |
0.99 |
17.31 |
0.98 |
18.13 |
1.00 |
|
|
5% Amplitude Scaling |
Our |
25.31 |
1.00 |
23.83 |
1.00 |
24.57 |
1.00 |
|
[8] |
26.00 |
0.93 |
15.77 |
0.93 |
18.92 |
0.99 |
|
|
[15] |
20.70 |
0.99 |
15.78 |
0.98 |
16.43 |
1.00 |
|
|
LPF 35 kHz + 5% Amplitude Scaling |
Our |
22.53 |
0.99 |
23.20 |
0.99 |
23.45 |
1.00 |
|
[8] |
25.18 |
0.93 |
15.69 |
0.93 |
18.56 |
0.99 |
|
|
[15] |
19.28 |
0.99 |
15.67 |
0.98 |
16.24 |
1.00 |
|
From the results, it can be seen that the proposed audio watermarking scheme is robust to most of the common audio processing attacks. It gives good SNR values along with good amount of embedding capacity and lower bit error rates in all types of audio dataset. The NC values are always above 0.9 for most of the common audio processing attacks. As the local component varies along with the amplitude scaling, invariance towards amplitude scaling attacks is also proved.
Fig.9 shows the robustness of the system in estimation of QIM Step size when the MP3 compression-32bps attack is performed on the watermarked audio. The SNR of attacked audio is 16.91dB with NC=0.99 and BER=0.02%. Even the watermarked signal is degraded up to 16.91 dB; estimated QIM step size follows the original step size closely. Hence the BER of an extracted watermark is less.
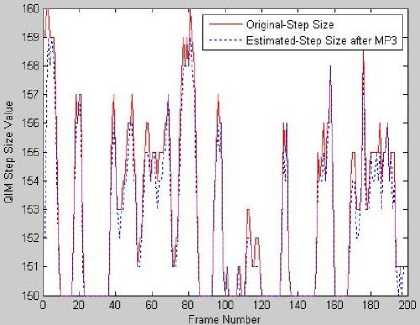
Figure 9. Result of MP3-64Kbps Attack on QIM Step Size Estimation with SNR of Attacked/Degraded Audio=16.91dB
-
D. AWGN Attack Analysis
After checking the robustness of the system against AWGN attack with different standard deviations σ =0.005 to 0.05 and mean =0 for different audios, it is found that with increase in σ , the NC value of speech drops more rapidly compared to music signals. Here, Watermark detection can be considered as a communication related problem requiring reliable transmission and detection of a watermark signal through a noisy channel. Thus, the watermark detection problem can be formulated as a hypothesis test where,
H : Audio signal does not contain watermark
H : Audio signal contains watermark
H0 being the null hypothesis states that received signal is not watermarked and the alternate hypothesis H1 states that received signal is watermarked, respectively. The problem of hypothesis testing is to decide whether the statistic extracted from received signal supports alternate hypothesis. Due to noisy communication channels, usually it is not possible to separate all watermarked and un-watermarked audios perfectly. There is a small probability pFP of accepting H1 when H0 is true (false positive) and a small probability pFN of accepting H0 when it is false (false negative).
For the AWGN channel, e(n) is Gaussian random process and statistically independent from embedded watermark w(n). The normalized cross-correlation ( NC ) between the original watermark and the extracted watermark given in (12) can be used as test statistic. The distribution of NC under the hypothesis H0 and H1 is estimated using simulations. For a rock music audio, under the hypothesis H0 , we simulated 1000 AWGN patterns with standard deviation varying from 0.005 to 0.05, and constructed the received signal in each case. Then statistic NC was evaluated for each of them. The distribution NC is shown in Fig.10 (a) and is observed to be approximately normal with mean 0.3762 with variance of 0.0155. On the other hand, under the hypothesis H1, we embedded watermark into the rock audio and we subsequently applied the detection process after simulating awgn attack with different standard deviations σ=0.005 to 0.05 and mean=0. The distribution NC in this case is shown in Fig.10 (b) and is observed to be approximately normal with mean 0.9985 with variance of 0.0038. The value of NC computed for extracted watermark can be compared with the acceptance threshold T =0.5 in order to detect if received signal is watermarked or not. The probability of false positive p FP is zero and p FN is 2.621474*10-07. It is observed that both NC distributions are well separated. Similar phenomenon is observed in other types of audio signals.
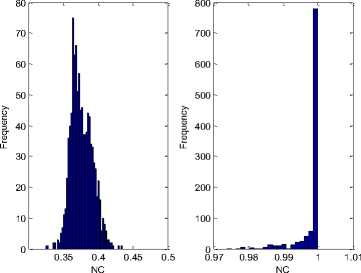
Figure 10. Distributions of the NC under the H0 and H1 for rock audio
-
IV. CONCLUSIONS
The main purpose of this paper is to automate the selection of an optimal QIM step size Δ based on features of given audio signal in order to get good tradeoff between imperceptibility and robustness. Here, embedding strength i.e. QIM step size Δ is made adaptive to both the local and global components of a given audio signal. The MVE and VSF are used as global features to characterize a given audio in order to decide initial selection of Δ, while the energy of each frame constitutes the local component. Making Δ adaptive in nature according to dynamic signal properties enhances the SNR without compromising robustness. In addition to the simplicity, less computational burden and ease of implementation, importance of fuzzy logic to calculate global component is also established. Fuzzy rules developed here helps to generalize our system on wide variety of audio signals.
The experimental results show that the embedded watermark is perceptually transparent and the proposed adaptive scheme is robust against different types of attacks. For most of the attacks, the normalized correlation coefficient is more than 0.9.
References Adaptive Quantization Index Modulation Audio Watermarking based on Fuzzy Inference System
- S. Katzenbeisser, F.A.P. Petitcolas (Eds.), "Information Hiding Techniques for Steganography and Digital Watermarking", Artech House Inc., 2000.
- Foo, S.W., Muh, H.S. and Mei, N.M., "Audio watermarking using time frequency compression expansion", IEEE International Symposium on Circuits and Systems, May 2004, Vol. 3, pp. 201-204.
- Xiangyang Wang, Wei Qi, and Panpan Niu, "A New Adaptive Digital Audio Watermarking Based on Support Vector Regression", IEEE Transactions on audio, speech and language processing, Nov 2007, Vol. 15, No. 8, pp. 2270 - 2277.
- D. Kirovski and H. S. Malvar, "Spread spectrum watermarking of audio signals," IEEE Transactions on Signal Processing, Apr. 2003, vol. 51, no. 4, pp. 1020-1033.
- Shaoquan Wu, Jiwu Huang, Daren Huang and Shi, Y.Q., "Self-Synchronized Audio Watermark in DWT Domain", In Proceedings of the International Symposium in Circuits and Systems, May 2004, vol.5, pp. 712-715.
- Shaoquan Wu, Jiwu Huang, Daren Huang and Yun Q. Shi, "Efficiently Self-Synchronized Audio Watermarking for Assured Audio Data Transmission", IEEE Transactions on Broadcasting, 2005, Vol. 51, No. 1, pp. 69-76.
- Zhiping Zhou and Lihau Zhou, "A Novel Algorithm for Robust Audio Watermarking Based on Quantification DCT Domain", In 3rd International Conference on Intelligent Information Hiding and Multimedia Signal Processing, Nov 2007, vol.1, pp. 441-444.
- Wang, X., and Zhao, H., "A novel synchronization invariant audio watermarking scheme based on DWT and DCT", IEEE Transactions on Signal Processing, Dec 2006, vol. 54, no.12, 4835-4840.
- Brian Chen and G. W. Wornell, "Quantization Index Modulation Methods for Digital Watermarking and Information Embedding of Multimedia", Journal of VLSI Signal Processing Systems for Signal Image and Video Technology, Kluwer Academic Publishers, Netherlands, Feb 2001, Vol. 27, pp. 7-33.
- B. Chen and G.W. Wornell, "Quantization Index Modulation: A Class of Provably Good Methods for Digital Watermarking and Information Embedding," IEEE Transactions on Information Theory, May 2001, Vol 47, no. 4, pp. 1423-1443.
- Qiao Li, "Using Perceptual Models to Improve Fidelity and Provide Resistance to Valumetric Scaling for Quantization Index Modulation Watermarking", IEEE Transactions on Information Forensics and Security, June 2007, Vol. 2 , No. 2, pp. 127-139.
- Foo, S.W., Yeo, T.H. and Huang, D.Y., "An adaptive audio watermarking system", In Proceeding of the IEEE International Conference on Electrical and Electronic Technology, 2001, Vol.2, pp. 509-513.
- X. Li, M. Zhang and S. Sun, "Adaptive audio watermarking algorithm based on SNR in wavelet watermarking scheme," Natural Language Processing and Knowledge Engineering, 2003, pp. 287 - 292.
- N. Sriyingyong and K. Attakitmongcol, "Wavelet-Based Audio Watermarking Using Adaptive Tabu Search", First International Symposium on Wireless Pervasive Computing, 16-18 Jan. 2006, pp. 1-5.
- Vivekananda Bhat K., Indranil Sengupta, Abhijit Das, "An adaptive audio watermarking based on the singular value decomposition in the wavelet domain", Digital Signal Processing, Elsevier Inc., 2010, 1547-1558.
- Nicolas Scaringella, Giorgio Zoia, and Daniel Mlynek, "Automatic Genre Classification of Music Content: A survey", IEEE Signal Processing Magazine, Mar. 2006, Vol. 23, No. 2, pp. 133-141.
- G. Tzanetakis and P. Cook, "Musical genre classification of audio signals," IEEE Transactions on Speech Audio Processing, July 2002, vol. 10, no. 5, pp. 293-302.
- Tao Yu, and John H. L. Hansen, "Automatic Beamforming for Blind Extraction of Speech from Music Environment using Variance of Spectral Flux-Inspired Criterion", IEEE Journal of Selected Topics in Signal Processing, Vol. 4, No. 5, Oct. 2010, pp. 785-797.
