Adaptive Remote Sensing Texture Compression on GPU

Author: Xiao-Xia Lu, Si-Kun Li
Journal: International Journal of Image, Graphics and Signal Processing(IJIGSP) @ijigsp
Article in issue: 1 vol.2, 2010.
Free access
Considering the properties of remote sensing texture such as strong randomness and weak local correlation, a novel adaptive compression method based on vector quantizer is presented and implemented on GPU. Utilizing the property of Human Visual System (HVS), a new similarity measurement function is designed instead of using Euclid distance. Correlated threshold between blocks can be obtained adaptively according to the property of different images without artificial auxiliary. Furthermore, a self-adaptive threshold adjustment during the compression is designed to improve the reconstruct quality. Experiments show that the method can handle various resolution images adaptively. It can achieve satisfied compression rate and reconstruct quality at the same time. Index is coded to further increase the compression rate. The coding way is designed to guarantee accessing the index randomly too. Furthermore, the compression and decompression process is speed up with the usage of GPU, on account of their parallelism.
Texture compression, self-adaptive, Human Visual System, vector quantizer, GPU
Short address: https://sciup.org/15012029
IDR: 15012029
Text of the scientific article Adaptive Remote Sensing Texture Compression on GPU
Published Online November 2010 in MECS
Using remote sensing images as textures for large-scale terrain rendering can enhance rendering quality. But these high precision images have huge size, which is conflicted with limited amount of graphics memory and bandwidth available. At the same time, texture bandwidth is one of the most common bottlenecks in graphics performance that will affect real-time rendering [1], even using optimized out-of-core techniques to load textures in advance. Time waiting for textures loaded from external storage to memory and graphics memory, especially when the texture are large, will make the rendering side unacceptable. Thus, finding a compression method support fast decompression remote sensing texture without hurting the visual facticity is a key for real-time rendering large scale terrain.
The aim of this work is the development of a vector quantization (VQ) based compression method optimized for remote sensing textures. The method can deal with different remote sensing images and various resolutions without artificial auxiliary.
-
II. Related works
Utilizing the redundancy and coherency of images, the compression technique satisfies various requirements such as storage or transmission. Lots of methods are available in image compression including the JPEG 2000 standard, wavelet coding using multi-resolution analysis[2], and fractal coding extracting the image’s self-similarity[3] etc. But these methods are not suite for texture compression in real-time rendering, as they do not offer random access to individual pixels from the compressed texture. Beers first solve the problem by VQ [4], which can decode the compressed image in the graphics hardware and satisfy the real-time requirement. Most VQ compression need long time of training. Tang proposes an incremental texture encoding algorithm to overcome the long training time problem [5], but the quantizer is not optimized in the algorithm. As Euclidean distance is used to measure similarity in many VQ algorithm, threshold has to be tried for different images manually.
There is another problem in compressing remote sensing textures: the remote sensing image has large regional difference and lack of local correlation than static images. Methods based on wavelet and dimensional reduction [6] designed to overcome the problem, aim at high compression rate or detail maintenance. They don't offer pixel random access, which is very important for decompression process. It is hard for compression method to satisfy compression ratio, quality of reconstructed image and real-time decompression requirements at the same time.
As Berg points out, if an optimal vector quantizer is found for a given performance objective, no other coding system can achieve a better performance [7]. In this paper, a novel quantizer is presented. The HVS-optimized similarity measurement function and threshold value can fit different and various resolution remote sensing textures automatically. An adaptive compression process considering the property of remote sensing image is also designed to enhance the vector quantized code book accuracy. As the method is based on VQ, the decompression can satisfied the real-time requirement, especially with the help of GPU. GPU is also used to speed up the compression.
Ш. Adaptive HVS-optimized vector quantizer
In general, a vector quantizer is defined as a mapping from a k-dimensional Euclidean space Rk into a N-entries code words set, called codebook, as Q: R k ^ R N . Using VQ in image compression, the image is first divided into n*n blocks, constructing the Rk. Then, code word is selected from Rk to represent a cluster of blocks in the original set. The clustering process is based on similarity measurement, which commonly use the pixels’ Euclidean distance between blocks. But the Euclidean distance can not tell the visual difference between blocks very well. That is why image with small MSE sometimes has bad visual quality. And it is hard to set a “perfect” threshold measuring the similarity for different images. These are what we will handle next.
-
A. Adaptive similarity measurement function
The factor infects the VQ compression quality most are: the similarity measuring method between blocks; and the threshold value determining whether two blocks are similar enough. These two correlative factors decide whether one block can be substituted by the other. To decrease precision loss caused by such substitution in compression, the following facts of human visual system (HVS) from biological sciences are used. First, the properties affecting the quality of image are mainly brightness, contrast, colorfulness and sharpness [8]. Second, human visual system is sensitive to local luminance contrasts [9]. Third, the visual cortex neuron is more active to the change direction and amplitude of contrast [10]. These factors make our method pay more attention to brightness and contrast.
The remote sensing image used in this work is in RGB mode. First we convert it to YCrCb mode to reduce the coherence between colors. This transform is also convenient for us to utilize brightness value of pixel. Thus, the similarity measurement function used to evaluate the similarity between two blocks (B, B') is nPixel
M = £ a *Y Yj ./nnjCj -iC bb r., k = 1
The k here is the pixel index in a pixel block. In the function, parameters α, β and γ are the adjustment factors of brightness and two chromatism, α+β+γ=1. The setting of α, β and γ is based on the ideas we mentioned above. As human visual is sensitive to the change amplitude of contrast, we evaluate the change amplitude of Y, Cr and Cb in the image. Then, α, β and γ is calculated according to these change amplitude. The design considers the effect of contrast which is independent of brightness. Contrast definition is:
contrast = (max -

Based on this, α, β and γ is:
Y - Y C r - C r. C b - C b • .
N = max mm +— max^—min +-- max^—min , //For normalization
YC r C b
Y - Y _ C r - C r. Cb - Cb .
а _ 1 max 1 min /N в _ r max _____ r min I Nr у _ b max _____ b min j N
~ Y / Cr / ’ Cb /
The simulation in part W shows such definition is efficient. To further simplify the computation, a basic value for every block is set:
nPixel
-
B= ^ [ a *Y k2 + e *Cr k2 + Z * C b k2 ] k=1
The k here is the pixel index in a pixel block.
Thus, the similarity measurement function changed to: nPixel
M' = У а*(Yk2-Yk2)+e*(Crk2-Crk2)+Z*(Cbk2-Cbk2) kk k k k k k=1
= B-B'
Let the difference between pixels in two blocks be △ ( △ Y, A Cr, A Cb), then the similarity is changed from:
nPixel
M = £ а *( А Y ) k 2 + в *( А Cr ) k 2+ Г *( А Cb ) k 2 k = 1
to:
-
M' = M+ P£ 2 а Y ' k А Y k+2 e Crk А Cr k+2 Z C b ' k А Cb k k = 1
From the formula above, we can see that the changed similarity measurement function is just larger than the original value. It can be adjusted by augment the threshold value. Applying the simplification, we get two benefits: (1) the base value computation for pixel block is only once per block, (2) the similarity measurement during the compression process only needs a simple comparison of two blocks’ base value. That can make the compression quicker. And the computation turn to suit for parallel implementation on GPU, as the base value can be calculated parallel between blocks.
The setting of α, β and γ is calculated from the image. They exhibit the variation amplitude of different components and weighted the effects to the similarity. Adjustment factors varied from one image to another. This design is the first adaptive capacity of the algorithm.
-
B. Adaptive threshold value setting
After the similarity measurement function is decided, the threshold value will be the key to satisfy the compression rate and reconstruct quality requirement.
Most VQ compression methods don’t describe the way how to set threshold, and some need user to try and set many times to different image. With high volume of images pending to compress, it will be a miscellaneous work to set proper threshold for each image to balance the compression rate and quality of reconstruct image. Here we design an automatically threshold setting method based on the image property. As the second adaptive process in the algorithm, it cooperates well with the similarity measurement function.
During the setting of threshold, there are two adaptive treatments: (1) the threshold is automatic set according to different images; (2) in view of different area in an image, the threshold is adjusted to fit the local character adaptively.
Since the design of similarity measurement function mainly considers the effect of contrast, the threshold adopts the variation amplitude between pixels to fit the function. The threshold is set through two steps:
-
1. count the variation amplitude between pixels through whole image, get the statistical value E;
-
2. using E and an adjust ratio δ to get base threshold T.
E = ZV [( Y +i,j - Y , j )2 + ( Cr +u - Cr , j )2 + ( cbM-j - Cb j +
-
i , J = 0
( Y ,,+ — Y J2 + ( C j — c j + ( Cb ij+i — Cb j +
( Y+kf + 1 - Y j )2 + ( ^+1 - Cr , Jf + ( Cb i+j - Cb i, J)^
T = 5 *
(
E 3* N * N
)
Adjust ratio δ give user a choice to obtain whether higher compression rate or reconstruct quality. The δ used in our experiments is set to 1.
Remote sensing images have properties like large regional difference and weak local correlation, the complexity varies from one area to another. Thus, it will produce distortion in reconstruct images when the image is complicated, if the threshold is kept unchangeable. Adjust the threshold according to complexity of the handled area is a good way to solve the problem.
Experiments show when pixels change rapidly, the human visual is unconscious to the error of the reconstructed image, and is able to adjust the compression rate higher. To the contrast situation, lower the compression rate can make the reconstruct quality better for HVS. According to such character, the threshold is set through compute the difference between the pixel and its “future” pixels within range R. Thus, we get A E to adjust threshold according to the local property.
-
p , q = R
A E = [ z B i+p J+q - B i j ] /[( R * R )*( n * n )]
-
p , q =1 /
The B here is the basic value for a block we defined earlier, R is rang take into account, and n is the block size. The “future” directions are showed in Figure 1, according to the compression direction.
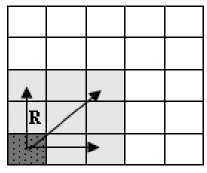
Figure 1. Pixel and its “future” pixels
With the setting method, a threshold can be calculated automatically based on the image’s self property. That can also be parallel calculated on GPU, eliminates the user’s fussy work. Different resolution images are used to test the efficiency of the method in part W .
-
C. Index coding
For those code method based on VQ, the size of index will influence compression rate too. For those large resolution images, size of index is even larger than code book. Thus, good index coding can improve the compression rate.
A simple method is Huffman encoding for index. However, it can only support decoding in sequence. Therefore, random access is unavailable during the process of decoding.
Through the analyzing of code book, it has been found that for the self-similarity of image, only a small part codes keep those low-frequency information, and remains keep high-frequency information. Thus, all codes are sorted according to the amount that they substitute. Codes keeping low-frequency information are called “lucky codes”. They are recorded directly in the index file. Codes keeping high-frequency information are recorded “0” in the index file. Those high-frequency codes maintain their substitutions by recording the substituted blocks’ position in the image. According to the statistics of experiments, “lucky codes” represent more than 90% texture. The scheme of encoding is illustrated as figure 2.
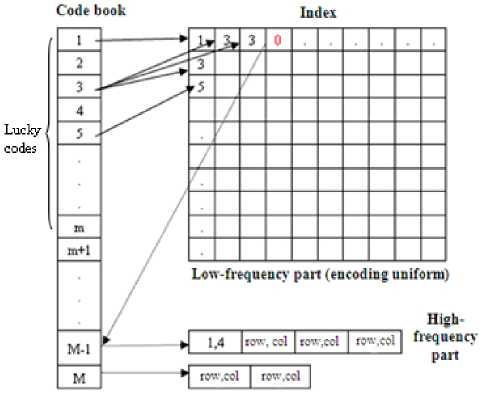
Figure 2. Encoding scheme of the index
During the process of decoding, the positions substituted by high-frequency part are less and searching among different code can be executed in parallel. So, less cost are needed to fulfill searching.
-
D. Compression Steps
Just like most other VQ compression methods, the image is first partitioned into small m*m blocks set. If K-SOM is applied for VQ, greater reconstruct quality can be achieved after long time training, as the codeword is optimized by the side effect in the same cluster. We add such lateral association to Tang’s incremental texture encoding algorithm; optimize codeword with one-pass process. Thus, the new process we present here utilizes the virtue of SOM and incremental algorithm, constructing code book fast and optimized. With the similarity measurement function and value setting method we described above, the compression process can implement a self-adapted process to those images with large regional difference.
Let the pixel blocks partitioned from input image is S={p 1 , p 2 ,…, p n }. The compression process needs three main steps which form three levels’ processing grid. The first level computes the local threshold value, G={g 1 , g 2 , …g k }, with g i calculate pixels’ difference in a block. The grid figures out difference in local region of radius R. The result is used to guide the adjustment of threshold value: increase the threshold with big difference, and decrease on the contrary. The second grid is used to find the similar code words with minimal error. G'={g 1 ', g 2 ', …} is an increasable grid with g i ' handles a code word in current codebook. If the minimum error is lager than the threshold, the input block will be added to the codebook. Or else, the input block go through the third grid G"={g 1 ", g 2 ", …g l "}. All blocks in G" are represented by same code word now. The function of G" is to optimize the code word to get minimal error represents all blocks of the cluster. The three level grids and the blocks they handle are showed in Figure 3.
Pixel bolck set to be match Code-woid set Blocks be «placed
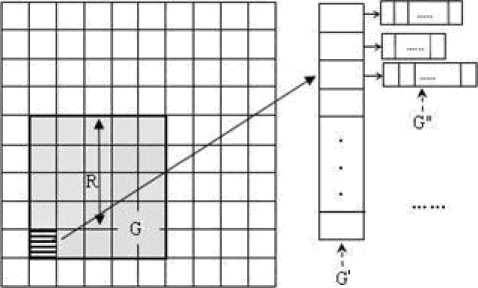
Figure 3. The three level processing grid
The compression work does not need train any more. One-pass process can build the codebook. And the code words are optimized through the processing in grid G" with lateral effect is imposed on code words.
Ⅳ. Experiments and analysis
Hardware platform of our experiments includes Intel dual-core 1.8GHz CPU, 512 M memory and Nvidia Geforce 8600 graphics card. Three types of remote sensing images including Terra [12], QuickBird [13] and CBERS-1 are used in the experiments of compression. Through experiments, some key parameters of our method are decided and the validity of our method is verified.
Just using the statistical errors of pixels as MSE doesn’t consider the coherence between pixels in the same area. Wang etc. presents a criterion--SSIM to compare the structural similarity between images [11], taking advantage that visual is more susceptible to the structure change. For paying more attention to the visual accordance between the original image and the reconstructed one, we use SSIM to judge the reconstruct quality together with MSE.
-
A. The effectiveness of similarity measurement function and threshold value setting
Three adjustment factors α, β and γ are very important in similarity measurement function. We compare three ways of setting including our method (M), random selection(R) and Euclidean distance based (E), as shown in Table 1. Principal component analysis (PCA) with VQ is also compared in Table 1 because it is an efficient method for dimensionality reduction [14]. We use the 4*4 block partition, as that will produce less input blocks. And the compression time is less than using 2*2 partitions. Your goal is to simulate the usual appearance of papers in a Journal of the Academy Publisher. We are requesting that you follow these guidelines as closely as possible.
As the contrast difference between Cr and Cb is small, we set β=γ in random setting, and α=0.9 to emphasize the importance of luminance. Since less code-word means higher compression rate in VQ-based compression, “Proportion of code” in table 1 (means the proportion of code-words in all input blocks) exhibits the compression capability. From the values in table 1, we can see that under the same threshold, our method of setting can get satisfied compression rate and reconstructed quality at the same time. Other setting methods can not work well with arbitrary image.
TABLE I. Adjustment factors’ effect on compression rate and reconstructed quality
|
Picture Name |
Adjustment Factors (α : β : γ) |
Proportion of code |
MSE |
SSIM (%) |
||
|
R |
G |
B |
||||
|
CBERS-1coastland (19.5m precision) |
0.85 : 0.08 : 0.07(M) |
0.031 |
9.344 |
84.20 |
86.87 |
79.75 |
|
0.9 : 0.05 : 0.05(R) |
0.047 |
9.473 |
84.19 |
86.49 |
79.06 |
|
|
0.33 : 0.33 : 0.33(E) |
0.025 |
9.842 |
80.05 |
82.41 |
77.92 |
|
|
0.40:0.38:0.22(PCA) |
0.012 |
11.762 |
76.37 |
76.83 |
73.80 |
|
|
Iberian Pernisula (500m precision) |
0.79 : 0.09 : 0.12(M) |
0.116 |
16.53 |
77.27 |
78.68 |
76.41 |
|
0.9 : 0.05 : 0.05(R) |
0.196 |
15.23 |
78.14 |
79.812 |
77.38 |
|
|
0.33 : 0.33 : 0.33(E) |
0.045 |
22.91 |
63.07 |
63.38 |
60.67 |
|
|
0.38:0.34:0.28(PCA) |
0.276 |
14.38 |
78.66 |
79.69 |
77.68 |
|
|
Fires in Indochina (500m precision) |
0.46-0.16-0.38(M) |
0.0061 |
6.938 |
84.181 |
87.15 |
85.45 |
|
0.9 : 0.05 : 0.05(R) |
0.0060 |
7.908 |
83.11 |
89.07 |
84.53 |
|
|
0.33 : 0.33 : 0.33(E) |
0.0054 |
7.125 |
82.90 |
85.66 |
83.83 |
|
|
0.43:0.32:0.25(PCA) |
0.0016 |
16 |
70.88 |
75.83 |
72.53 |
|
TABLE II. Efficiency of the automatically computed threshold to different resolution images
|
Image Name |
Proportion of code |
MSE |
SSIM (%) |
||
|
R |
G |
B |
|||
|
Iberian Pernisula 1Km |
0.14 |
17.924 |
80.89 |
83.62 |
81.31 |
|
Iberian Pernisula 500m |
0.12 |
18.378 |
79.43 |
82.48 |
80.08 |
|
Iberian Pernisula 250m |
0.035 |
12.651 |
73.73 |
77.84 |
73.91 |
|
Australia Fires 2.4m |
0.125 |
13.164 |
70.60 |
77.14 |
76.03 |
The setting of the threshold is another key in the quantizer. In Table 2, we compress four remote sensing images with different resolution. The threshold measure the similarity is set using the method we described in Part 2. The automatically computed threshold can get a compression ratio larger than 6 and the SSIM value more than 70% with all images of different resolution.
-
B. Performance of the compression process
As our compression process is an improved incremental algorithm, we compare the reconstructed
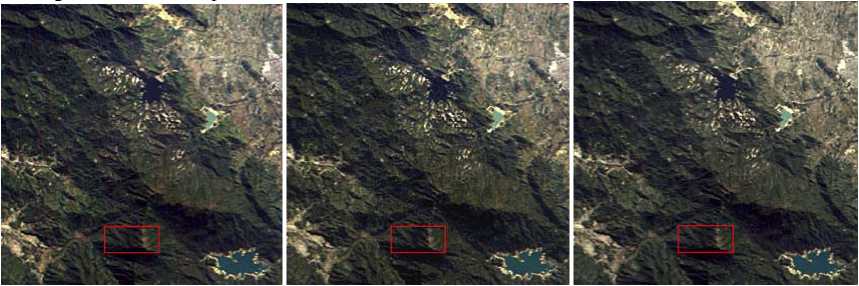
remote sensing images with Tang’s algorithm with the same compression rate in Figure 4. Due to the introduction of lateral association optimization to code words and self-adapted process in the compression, the reconstruction quality of our method is much better than the original incremental algorithm, especially to the area with lower contrast changing. The SSIM value in Table 3 also confirm that the structural similarity between original image and our method reconstructed one is much higher than the incremental reconstructed one.
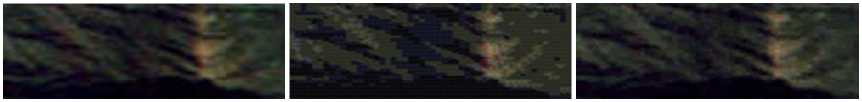
Original Image
Incremental algorithm
Our algorithm
(a) CBERS-1 coastland
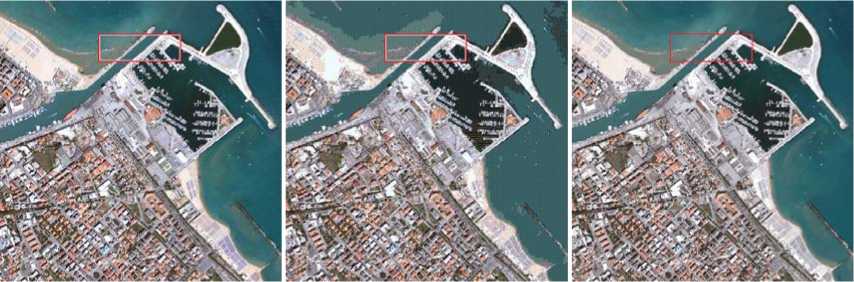
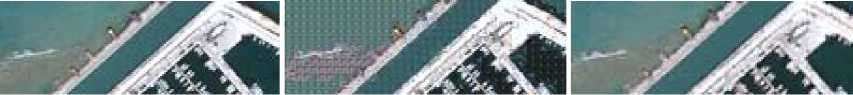
Original Image
Incremental algorithm (b) QuickBird Pescara, Italy
Our algorithm
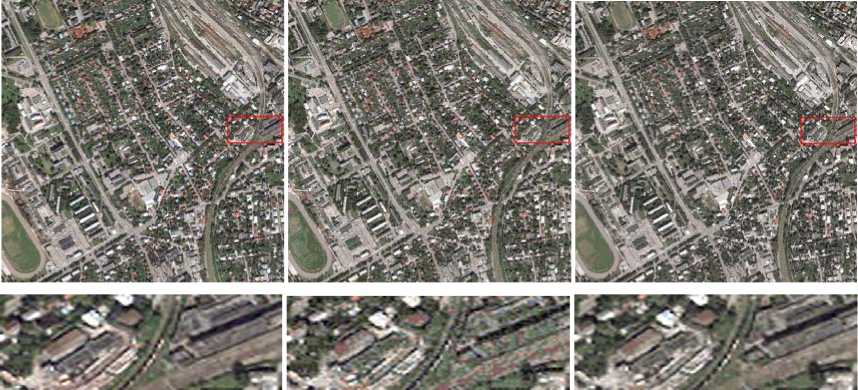
Original Image
Incremental algorithm
Our algorithm
(c) QuickBird Tallinn, Estonia
Figure 4. Comparison of reconstructed image between incremental algorithm and our algorithm
TABLE III. The SSIM of different quantizer
From the comparison in table 3 of SSIM value, conclusion can be made that the HVS-optimized method can get better reconstruct images even without self adaption during the compression. And the self adaptive process can further enhance the code book accuracy. r^-^vt^we
Original JPEG Our algorithm
-
Figure 5. Comparison of image quality with Lena
The compression algorithm can handle static images as well. The Fig. 5 shows the reconstruct Lena compressed by JPEG and our algorithm under the same compression rate. The index file is also compressed using Huffman Coding for our method in this work.
As we described in section 2.2, some part of compression can be done parallel between blocks. With help of CUDA [15], the GPU DRAM could be read in a general way. So, these parallel works are assigned on GPU easily, with one thread handles transactions of a block—the transform of the mode from RGB to YCrCb, the computation of basic value, and the setting of local threshold. The decompression can also be speed up by GPU as the VQ compression is designed to support the pixel random access. Each thread deals with the codeword searching of a block, and transforms the pixels in the block from YCrCb mode back to RGB mode. From Table 4 and 5, we can see that the compression time and
TABLE IV. Comparison of compression time (in millisecond)
|
Image size |
CPU-only |
GPU-assistant |
|
512*512 |
2756 |
1859 |
|
1024*1024 |
18327 |
16000 |
|
2048*2048 |
269906 |
253328 |
|
4096*4096 |
3477436 |
3369781 |
TABLE V. Comparison of decompression time (in millisecond)
|
Code book size |
CPU-only |
GPU-assistant |
|
About 800 |
9.478 |
0.8751 |
|
About 1200 |
9.0625 |
0.8691 |
|
About 1800 |
9.0452 |
0.8673 |
As shown in Table 4, the compression still needs long processing time when image size is large, even with the help of GPU. The reason is partly caused by the work on the code-words’ optimizing. The other reason is that VQ is computationally expensive when the vectors are long. That is why split VQ is used by many studies to handle large images.
V. Conclusions
We have proposed a self-adaptive HVS-optimized texture compression algorithm. The main contributions of this work are: (1) the similarity measurement function and threshold constructed automatically can fit different and various resolution images; (2) the self-adaptive threshold adjustment works well remote sensing textures with large regional difference; (3) GPU is used to speed up the compression and decompression process.
However, the code word searching time is still very long if very large image is handled. It can be deal with by carefully chosen tree-structured codebook and good searching algorithms. Our future work will focus on cutting down the code word searching time.
Acknowledgment
Thanks to the support by the Major State Basic Research Development Program of China (973 Program) (No. 2009CB723803)
Xiao-xia Lu Xiao-xia Lu was born in Changsha, China in 1977. She received M.S. degree of computer science in National University of Defense technology in 2005 and is pursuing Ph. D in there. The research areas include virtual reality and computer graphics.
Si-kun Li is the professor of NUDT and guider of Ph. D candidate. The research areas include EDA, SOC design methodologies, virtual prototype and distributed virtual reality.
References Adaptive Remote Sensing Texture Compression on GPU
- K. Roimela, T. Aarnio and J. Itäranta, “Efficient high dynamic range texture compression,” in Proc. of the 2008 symposium on Interactive 3D graphics and games, Redwood city, California, 2008, pp. 207-214.
- J. Wang, T. T. Wong, P. A. Heng, and C. S. Leung, “Discrete wavelet transform on GPU,” in Proc. ACM Workshop General-Purpose Computing on Graphics Processors, 2004. pp. C–41.
- H. Jiao, G. Chen, “A color image fractal compression coding method,” Journal of Software, vol. 14(4), pp. 864-868, 2003.
- A. C. Beers, M..Agrawala, N. Chaddha, “Rendering from compressed textures,” in Proc. of ACM SIGGRAPH, New Orleans, Louisiana, 1996, pp. 373-378.
- Y. Tang, H. X. Zhang, M. Y. Zhang, “GPU-based texture encoding and real-time rendering,” Chinese Journal of Computers, vol. 30(2), pp. 272-280, 2007.
- C. Zhao, W. Chen, L. Zhang, “A compression algorithm of hyper spectral remote sensing image based on vector quantization,” Journal of Harbin Engineering University, vol. 27(3), pp. 843-848, 2006.
- A. P. Berg, and W. B. Mikhael, “A survey of mixed transform techniques for speech and image coding, ” in Proc. of the IEEE International Symposium on Circuits and Systems(ISCAS ’99), 1999, vol. 4, pp. 106-109.
- I. Heynderickx, E. Langendijk, “Image-quality comparison of PDPs, LCDs, CRTs and LCoS projection displays,” In Proc. of SID, Boston, 2005, pp. 1502-1505.
- Toet A., Van Ruyven L. J., Valeton J. M. 1989. Merging Thermal and Visual Images by a Contrast Pyramid. Optical Engineering, 28, 7(Jul.), 789-792.
- Wang Y. 2009. http://baike.bbioo.com/doc-view-414.htm
- Z. Wang, A. C. Bovik, “Mean Squared Error: Love it or leave it?,” IEEE Signal Processing Magazine, vol. 26, (1), pp. 98-117, 2009.
- “NASA Terra satellite remote sensing image,” http://modis.gsfc.nasa.gov/galiery. 2009, Feb.
- “QuickBird satellite remote sensing image,” http://www.digitalglobe.com/. 2004.
- Yu Y. D., Kang D. S., Kim D. 1999. Color image compression based on vector quantization using PCA and LEBLD. In Proceedings of the IEEE Region 10 Conference(TENCON 99), Cheju island, South Korea, 2, 1259-1262.
- NVDIA CUDA Programming Guide. http://www.nvidia.com/object/cuda_develop.html, 2007.
